Clear Creek County is a mountain county where the 2025 land-cover layer is dominated by forest rather than agriculture or broad urban surfaces. Forest accounts for 61.45% of the mapped area, with shrubland at 16.94%, grassland at 12.13%, barren cover at 4.63%, and wetlands at 2.39%. The most developed surfaces appear as narrow corridors and small clusters cutting through a much larger matrix of forest and open high-country cover.
The page pairs four views of the same county: current land cover, forest and farmland, impervious/developed surface, and a 1985–2025 class comparison. After reviewing the patterns on screen, you can download the four original JPG maps in one ZIP file. The set is useful when you need to separate broad forest cover from alpine openings, trace where hard surfaces concentrate, or compare current conditions with long-term classification differences.
Table of Contents
A narrow developed corridor inside a heavily forested county
The general land-cover map makes the contrast between natural cover and development unusually clear. Dark green forest fills much of the center and east, while shrubland, grassland, and barren ground become more common toward the west and southwest. Red developed cover is not spread evenly across that landscape. Instead, it forms a thin connected line through the northern half of the county, with a few larger clusters where the line widens or branches.
That shape matters more than the developed percentage alone. Developed cover is 2.20% of the county, a small share compared with forest, but its linear pattern makes it visually prominent because it crosses long distances. A visitor looking only at the county total might miss this difference between area and arrangement. The map shows that human-built surfaces can be spatially important even when they occupy a modest percentage of the county.
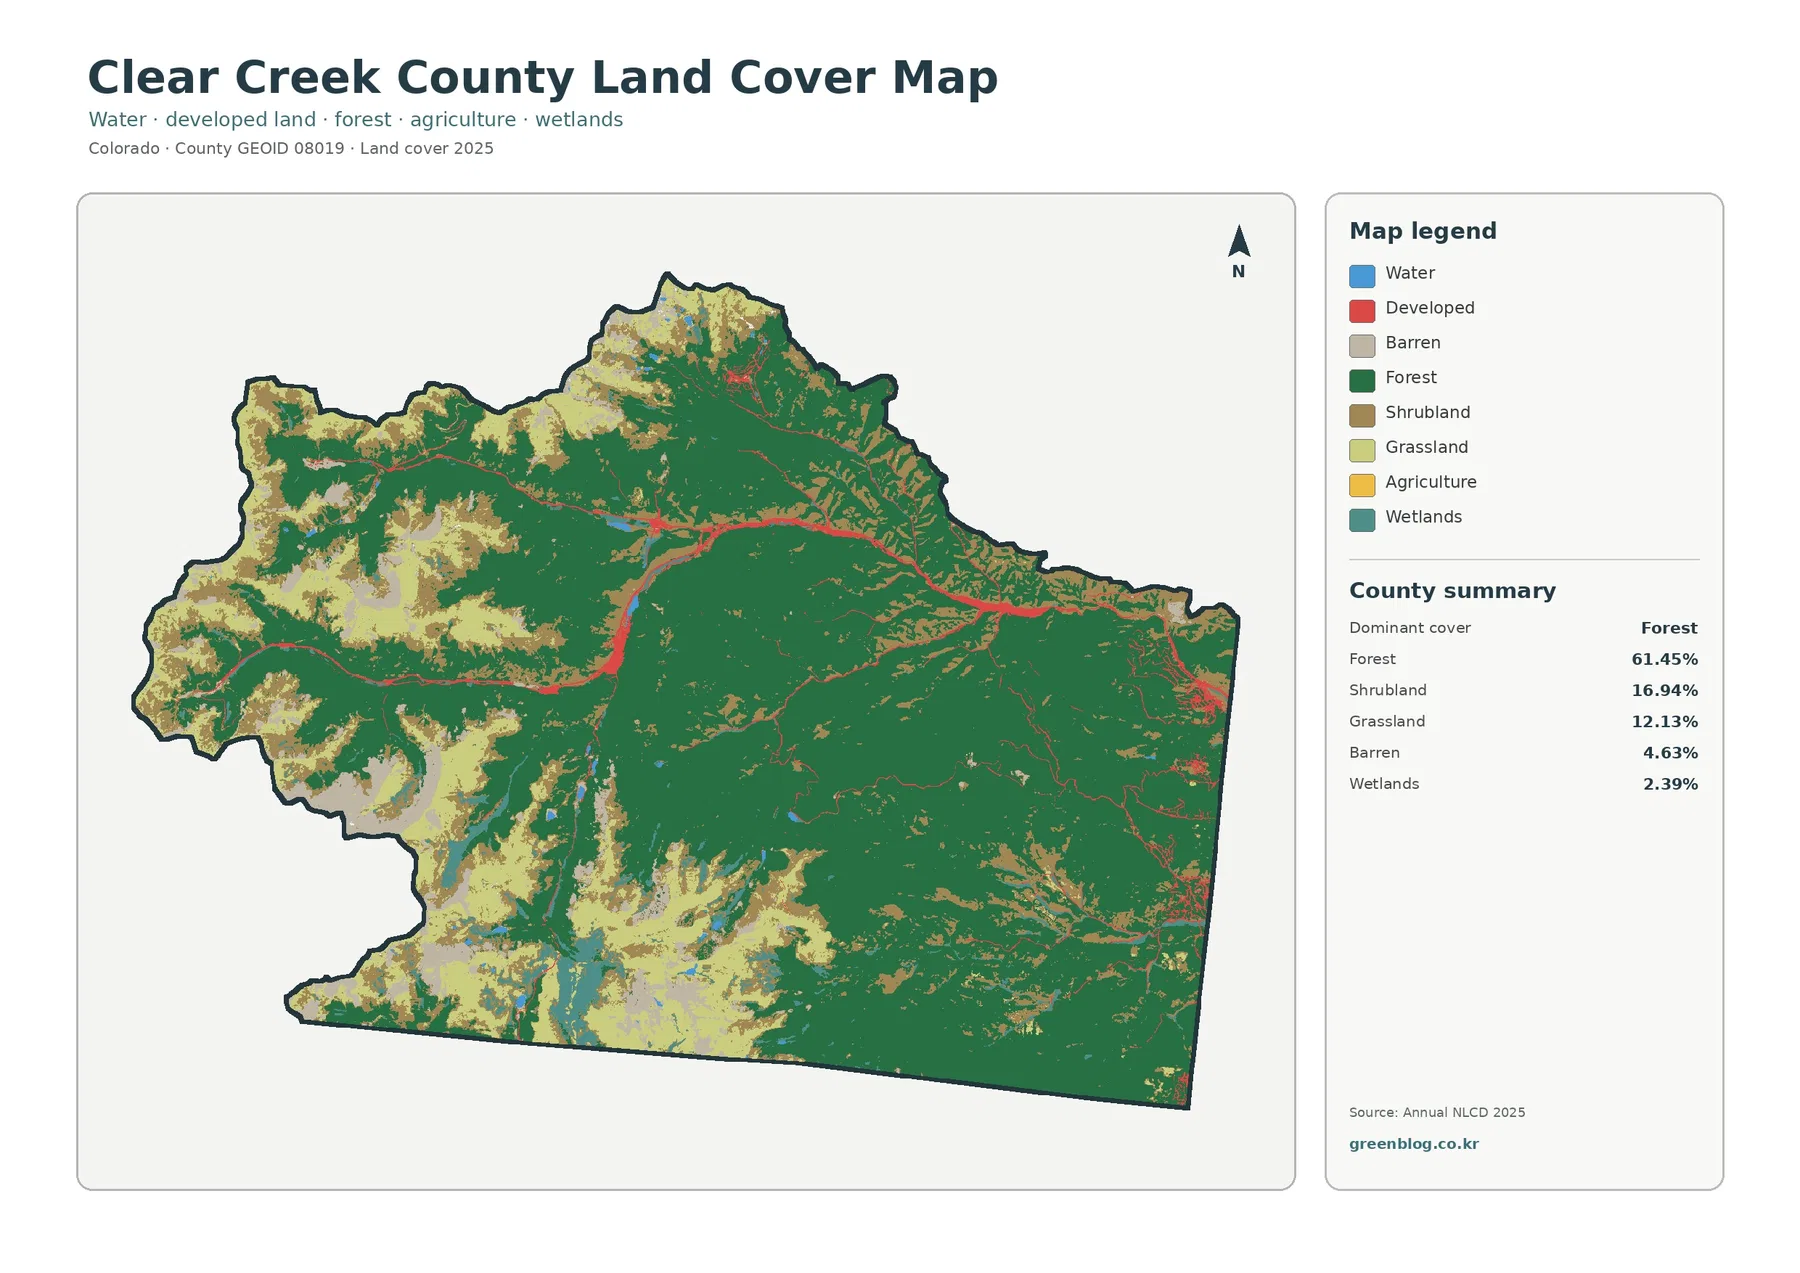
The county map does not print road names, so a red line should not automatically be labeled as a specific highway. Official Clear Creek County pages provide useful context, however. Georgetown and Idaho Springs pages identify Interstate 70 within their municipal limits, and the Empire page identifies a segment of U.S. Highway 40. Those references support a cautious reading in which major transportation and settlement corridors help explain why impervious and developed surfaces form long narrow bands rather than a broad urban block.
Water is only 0.22% of the 2025 summary, but wetlands are much more extensive at 2.39%. On the map, wetland color appears in elongated patches, especially in southern and southwestern portions of the county, while open water remains limited to small features. A wetland is not simply another way to draw a lake or stream. It is a distinct land-cover class associated with saturated ground and wetland vegetation, so the two categories should remain separate in a report or classroom exercise.
Forest gives way to shrub, grass, and barren alpine openings
The forest-and-farmland view simplifies the county into categories that are easier to compare across mountain slopes and openings. Forest still dominates, but the map also reveals large tan and light-green areas where shrub and grass replace continuous tree cover. These openings are especially noticeable in western and southwestern parts of the county and around higher-looking terrain, creating an irregular edge between wooded slopes and more exposed surfaces.
Agriculture is reported at 0.00% in the supplied 2025 summary. That makes this map very different from a plains-county farmland map filled with rectangular crop blocks. Here, its value is in comparing forest to shrub/grass, wetlands, water, and the combined developed/other background. The absence of a measurable agriculture class is itself useful information because it prevents a misleading assumption that every “forest and farmland” product contains significant cropland.
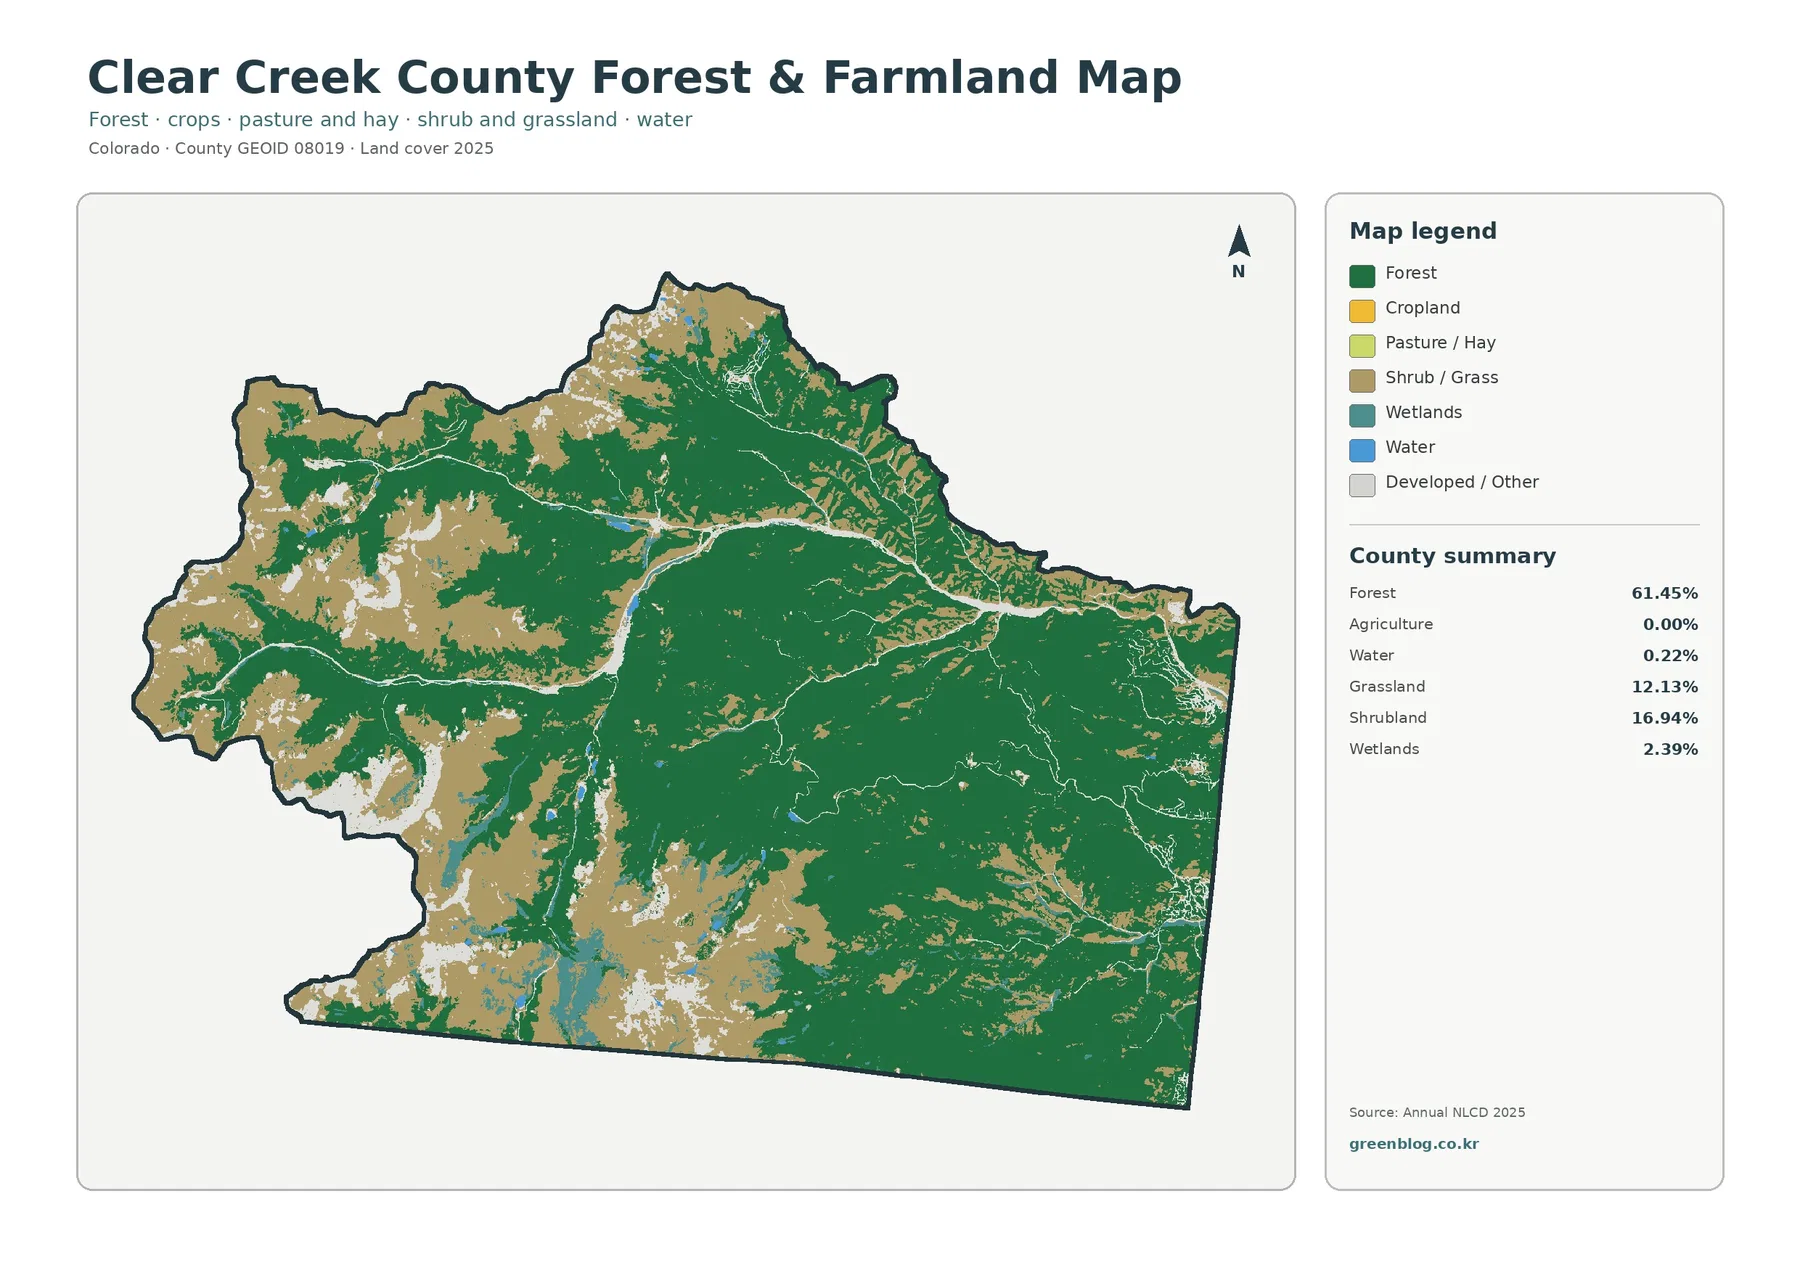
A 0.00% agriculture value should not be read as proof that no garden, small cultivated plot, or other minor agricultural use exists anywhere in the county. Annual NLCD classifies raster cells at a generalized scale, and a very small use can be absorbed into the dominant cover of a cell. The map also does not identify ownership, grazing rights, or agricultural zoning. Those questions require parcel records, agricultural statistics, or local land-use documents.
Clear Creek County’s Open Space Commission describes its mission in terms of protecting streams, woodlands, meadows, wildlife habitat, prominent vistas, geologic features, and other resources. That official description is helpful context for why a forest-and-wetland map matters in this county. It does not mean every green or teal cell belongs to county open space. Conservation boundaries are management boundaries, while NLCD colors describe physical cover on the ground.
Hard surfaces stay concentrated along roads and settlements
The impervious-surface map removes most land-cover colors and focuses on the fraction of each cell covered by pavement, rooftops, parking areas, and similar surfaces that do not readily absorb water. The countywide mean is 0.61%, and only 0.22% of the county is mapped at 50% or greater imperviousness. Most of the county therefore remains close to the zero end of the legend.
The stronger orange and red values form a recognizable network rather than a large continuous urban area. One main line crosses the northern half of the county, with branches and clusters at several points; an eastern cluster is larger than most of the others. Against the nearly white mountain background, these narrow features are easy to trace. Their concentration is consistent with a county where four small municipalities—Empire, Georgetown, Idaho Springs, and Silver Plume—sit within a landscape dominated by public lands, forest, and steep terrain.
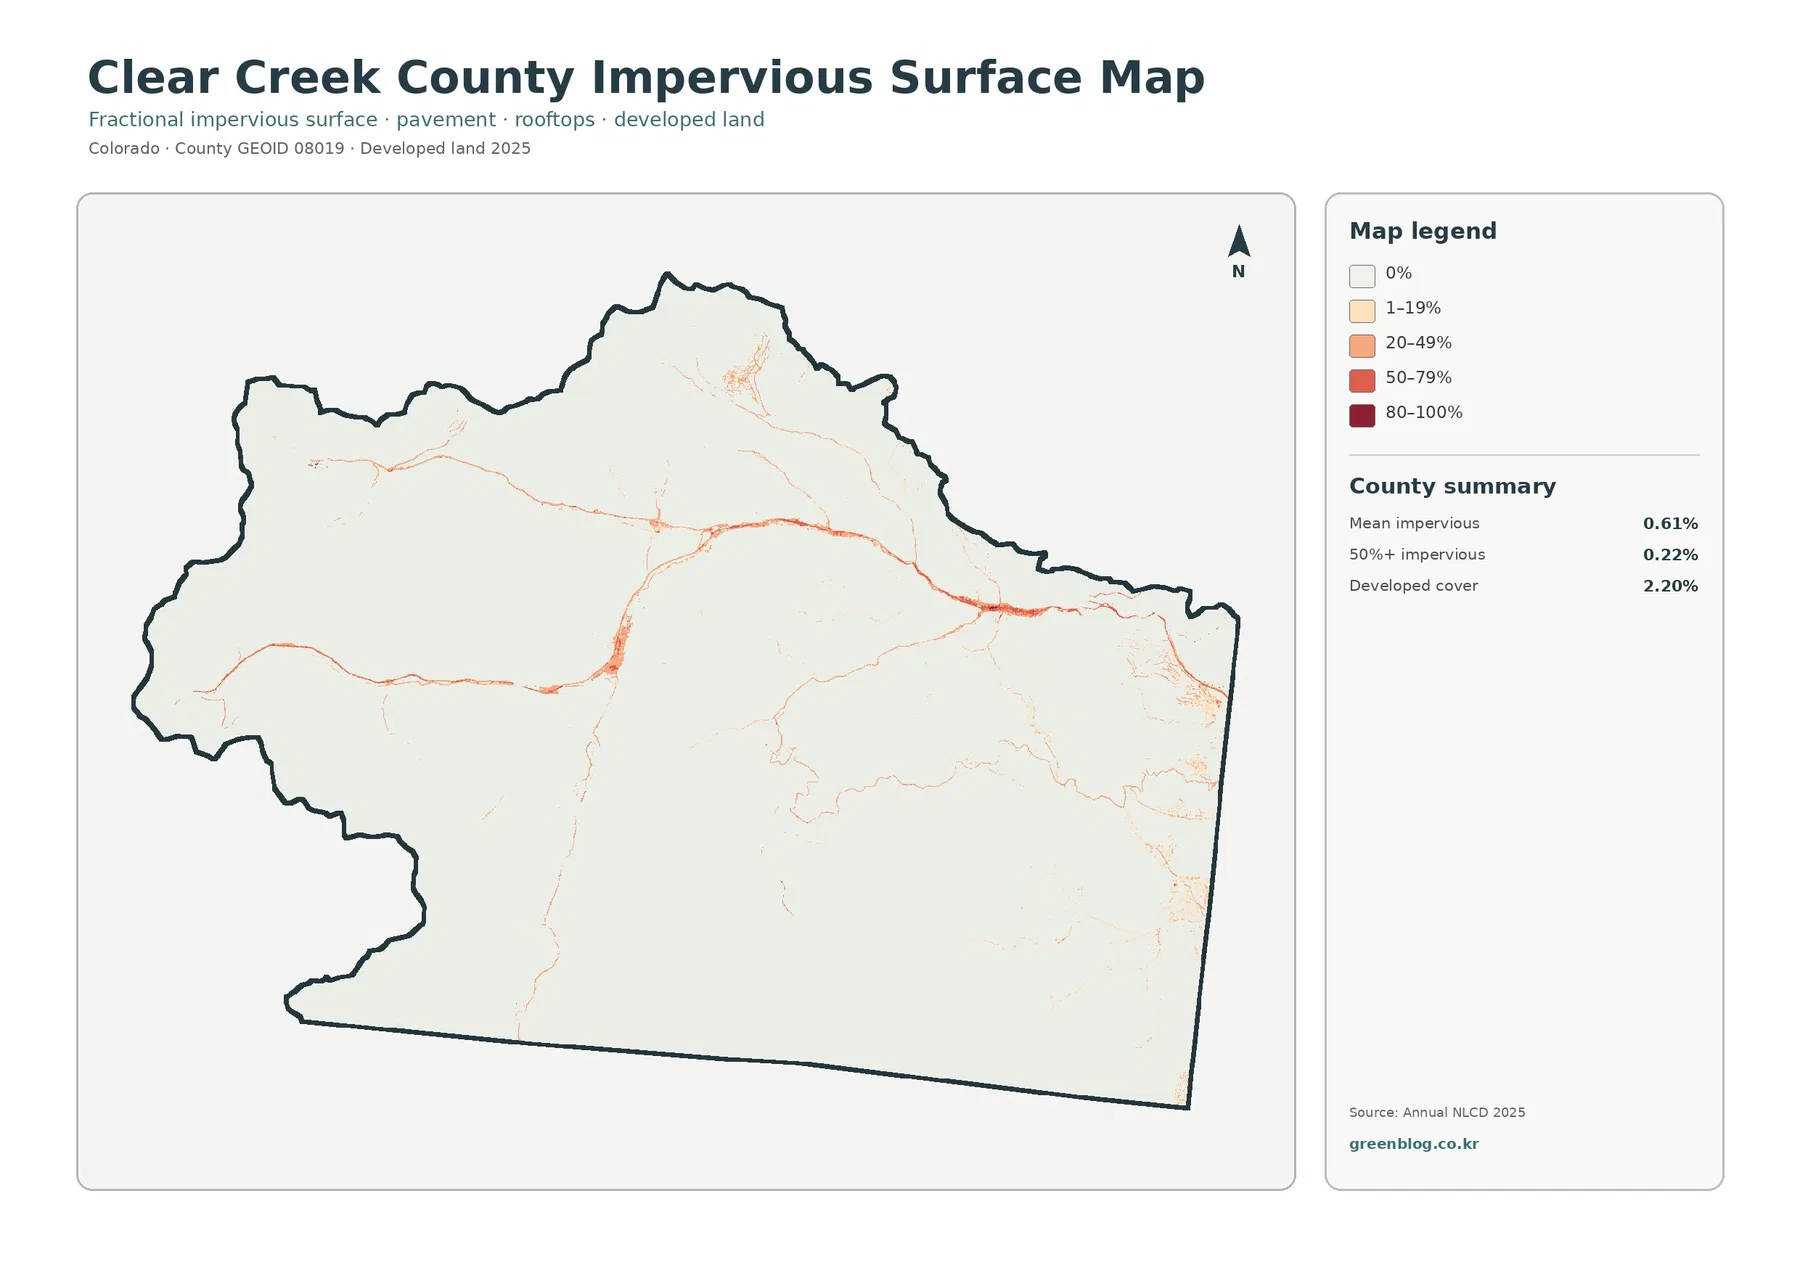
Developed cover at 2.20% is not the same statistic as mean imperviousness at 0.61%. A developed land-cover class can include lawns, soil, trees, and other permeable surfaces mixed with buildings and pavement. Imperviousness asks a different question: how much of each cell is actually covered by hard, water-shedding material. The two layers should therefore be used together rather than treated as competing measurements.
This distinction is useful for watershed or runoff discussions. The impervious layer can identify where hard surfaces are concentrated at county scale, but it does not calculate stormwater flow, drainage capacity, or flood risk. Narrow roads can also appear wider or fragmented because of raster generalization. Anyone studying drainage at a specific site would need elevation, engineering, stream, and infrastructure data in addition to this map.
Most cells keep the same class in the 1985–2025 comparison
The change map summarizes class differences between 1985 and 2025. Only 5.32% of the county is marked as having a different class, leaving more than 94% in the “no class difference” background. The named components include 4.28% other class difference, 0.60% forest loss, 0.41% change to developed, and 0.00% agricultural loss. Small wetland-difference patches are visible as well, although the supplied summary does not print a separate percentage for that category.
Purple “other difference” areas are scattered rather than forming one countywide front. They appear more densely in some northern areas and in several southern or central patches. Orange forest-loss cells are limited, with visible pockets in the southeast and smaller spots elsewhere. Red change-to-developed areas generally stay close to the same corridor pattern that stands out in the current developed and impervious layers.
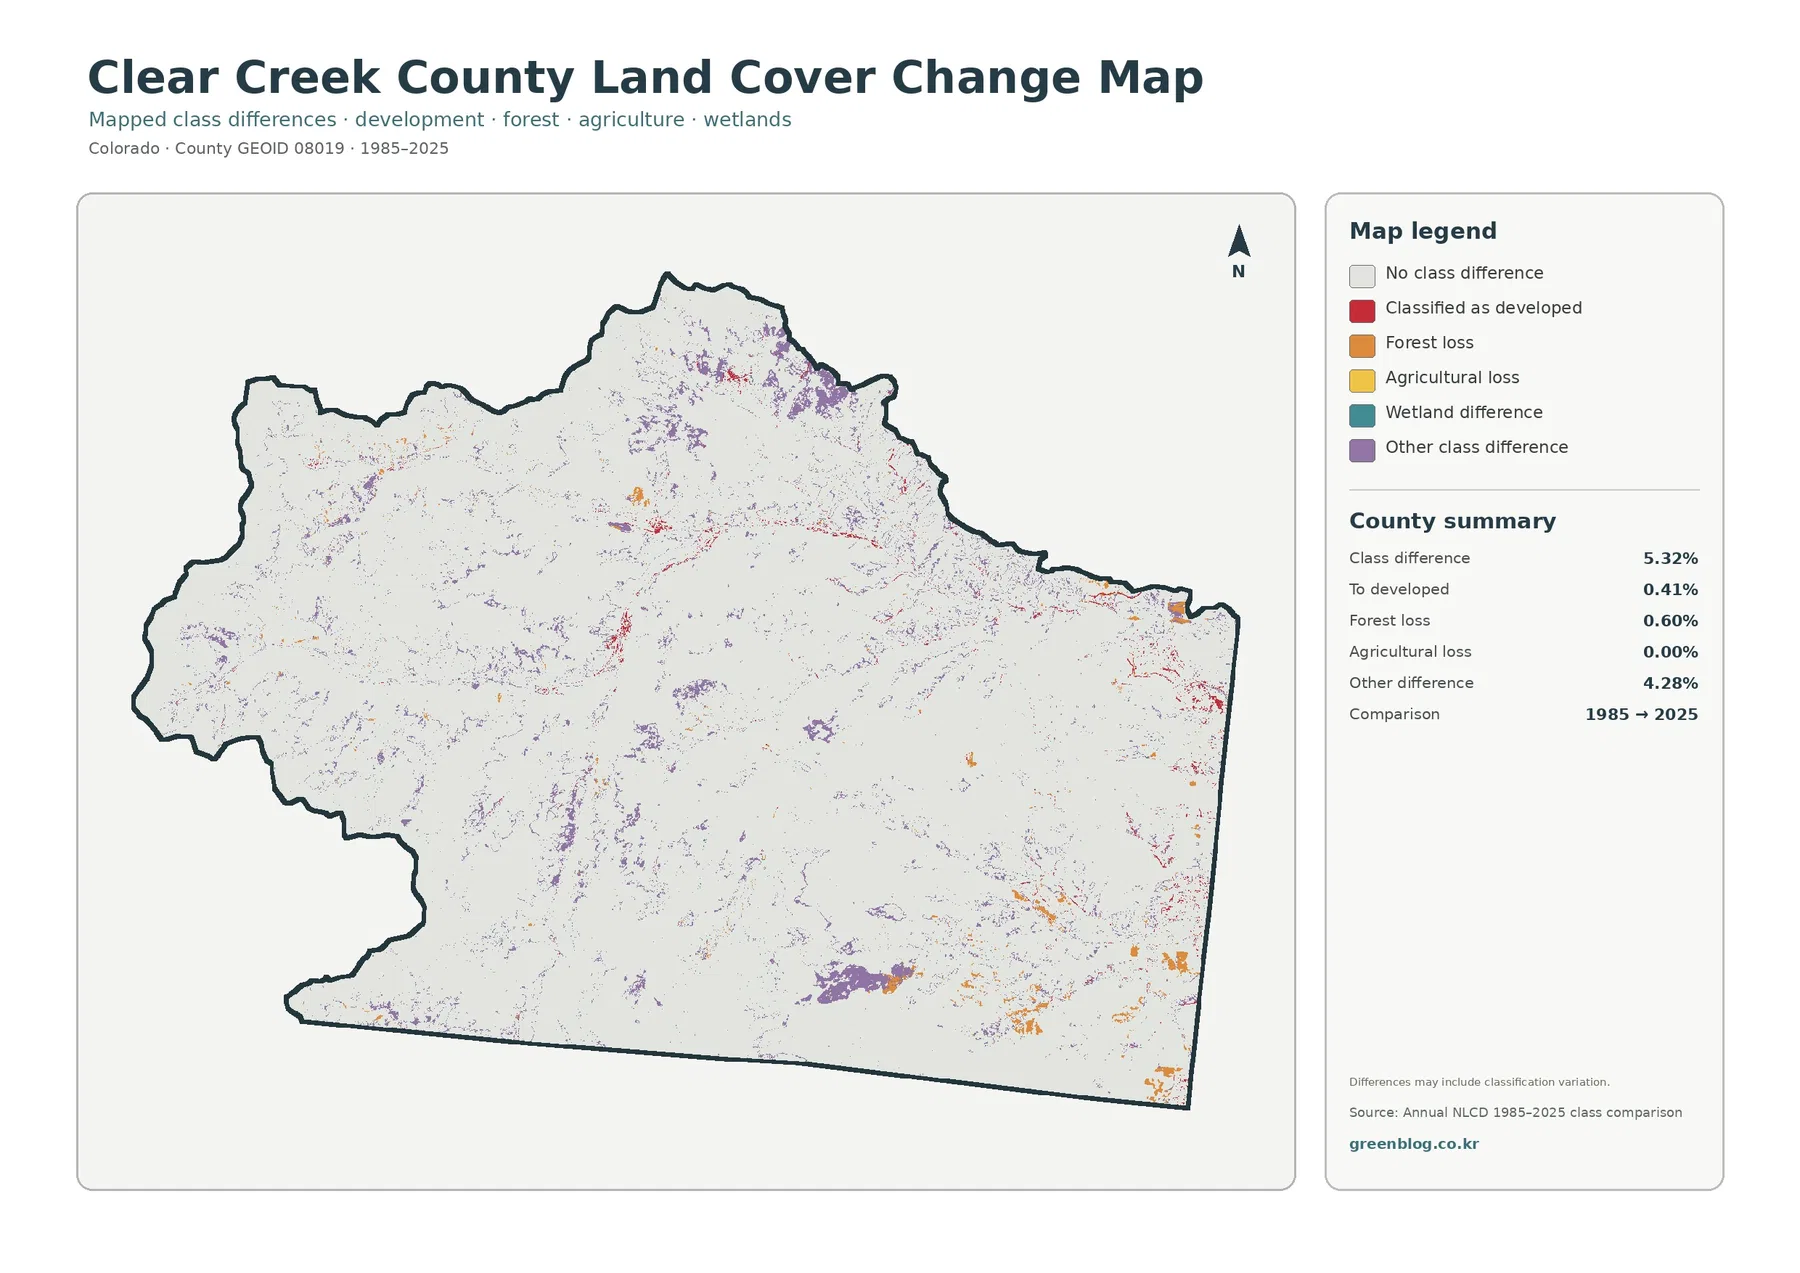
The 0.60% forest-loss category should not be presented as a measured logging total, wildfire footprint, or permanent loss of tree cover. It simply identifies cells assigned to the forest-loss category in this two-date comparison. The map itself warns that class differences may include classification variation. Determining cause would require evidence such as fire records, forest-management history, construction records, or time-series imagery.
Current forest at 61.45% and forest loss at 0.60% also belong to different statistical frames. One describes the 2025 condition, while the other describes a change category between two endpoint years. Subtracting 0.60 from 61.45 does not reconstruct the 1985 forest share because the supplied summary does not provide a full transition matrix for every land-cover class.
Wetlands and open high-country cover add important detail
Forest is the headline number, but the smaller classes make the county map more informative. Shrubland and grassland together account for 29.07%, which is large enough to form broad visible openings around the forest. Barren cover adds another 4.63%. These categories create much of the mottled western and southwestern appearance and help distinguish exposed or sparsely vegetated high-country surfaces from continuous forest.
Wetlands at 2.39% are also significant compared with open water at 0.22%. Their elongated shapes often follow low areas within the mountain terrain rather than forming large compact blocks. For an environmental education project, a useful exercise is to locate a wetland strip on the general map, check the same place on the forest-and-farmland map, and then see whether the change layer marks any class differences nearby. That comparison teaches both spatial reading and the limits of categorical data.
Clear Creek County’s official open-space pages list protected lands such as Saxon Mountain, Waldorf Basin, and Geneva Basin/Iron Fens, and describe goals that include wildlife habitat, water resources, geologic features, and prevention of development in selected places. Those named sites should not be mapped from the NLCD colors alone, but they show why county-specific conservation information is a useful companion to a broad land-cover classification.
How to read raster classifications in steep mountain terrain
Annual NLCD is raster data: the landscape is divided into grid cells, and each cell receives a land-cover class or an impervious fraction. Real mountain features rarely fit those cells perfectly. A road, stream, forest edge, rock outcrop, and grassy opening can all meet within a short distance. When more than one surface occurs in the same cell, the result is often called a mixed pixel, and the mapped boundary becomes a generalized version of the real one.
That issue is especially important when interpreting small water bodies, narrow wetlands, roads, and isolated buildings. A feature may disappear at full-county scale, appear wider than it is on the ground, or switch classification near a sharp boundary. The maps are designed for county-level comparison, not for measuring the width of a road, locating a parcel corner, or deciding whether a structure lies inside a wetland.
Barren cover also needs careful wording. The 4.63% barren class describes exposed or sparsely vegetated surface; it does not mean vacant property, unused land, or land available for development. Likewise, forest cover does not tell you whether the land is public, private, protected, or zoned for a particular use. Surface cover and legal land status are different kinds of information.
The 2025 layer is an observation-year product, not a live map. Construction, vegetation changes, fire effects, or restoration after that year may not be represented. The 1985–2025 map compares endpoints and does not identify the exact year when a class changed. For a year-by-year question, use additional Annual NLCD years, historical imagery, or local records instead of assuming the change happened steadily across the full period.
Match the map to the question before downloading
Use the general land-cover map when you need one overview of forest, shrub, grass, barren ground, wetlands, water, and development. Choose the forest-and-farmland layer when the project centers on the boundary between wooded and open mountain cover or when you need to show that agriculture is not a measurable countywide class in the supplied 2025 summary. The impervious map is the clearest choice for discussing pavement and rooftops, while the change map belongs in a historical comparison.
For a county profile, the most useful current figures are forest 61.45%, shrubland 16.94%, grassland 12.13%, barren cover 4.63%, wetlands 2.39%, developed cover 2.20%, and water 0.22%. Those values describe the current 2025 classification. Keep them separate from the change statistics—5.32% total class difference, 0.60% forest loss, and 0.41% change to developed—so readers do not confuse a current share with a long-term transition category.
The four JPG files are provided at their original 2480×1754-pixel dimensions. The package manifest does not mark them as meeting its A3 high-resolution reference, so this page does not claim a larger print specification. They can still be useful for on-screen reference, classroom material, reports, and presentation graphics, especially when the goal is to compare the same county across the four layers rather than enlarge a single image beyond its source resolution.
Frequently Asked Questions
Why does the forest-and-farmland map report 0.00% agriculture?
The supplied 2025 county summary does not assign a measurable countywide share to the agriculture class. The same map design is used across counties, but the categories that matter vary by place. In Clear Creek County, the useful comparison is forest versus shrub/grass, wetlands, water, and other mountain surfaces. A 0.00% county share does not prove that every small garden or cultivated patch is absent.
Is the long red impervious corridor definitely Interstate 70?
The land-cover image does not label roads, so the red line should not be identified solely from the raster map. Official county pages do confirm I-70 segments in Georgetown and Idaho Springs and U.S. Highway 40 in Empire. Those references support the broader interpretation that hard surfaces concentrate along transportation and settlement corridors, but a labeled transportation map is needed for exact road identification.
What does the 0.60% forest-loss category mean?
It is the share of the county placed in the forest-loss category in the supplied 1985–2025 class comparison. It is not automatically a wildfire area, logging total, or permanent deforestation estimate. Because classification variation can contribute to mapped differences, the cause of any specific patch should be checked against historical imagery and official land-management, fire, or development records.
Map File Information
The ZIP contains the four original Clear Creek County JPG maps for current land cover, forest/farmland, impervious/developed land, and 1985–2025 change.
- File Type: Four JPG files in one ZIP archive
Related Maps
- Adams County Colorado Land Cover Map
- Alamosa County Colorado Land Cover Map
- Arapahoe County Colorado Land Cover Map
Sources and References
- MRLC Annual NLCD Data — official access point for Annual NLCD land-cover products.
- USGS Annual NLCD Land Cover Classification — definitions for forest, developed land, grassland, wetlands, and related classes.
- U.S. Census Bureau TIGER/Line Shapefiles — official reference for county boundaries.
- Clear Creek County Open Space Program — county information on open-space lands, planning, and protected resources.
- Clear Creek County Municipalities — official links for Empire, Georgetown, Idaho Springs, and Silver Plume.
- Clear Creek County Planning Department — official planning context for growth and natural-resource protection.
Green Map creates custom-edited map images using open geographic data sources such as geoBoundaries, Natural Earth, OpenStreetMap, and government open data.
These maps are edited visual materials, not raw data files, and are provided for education, documents, presentations, and graphic reference.