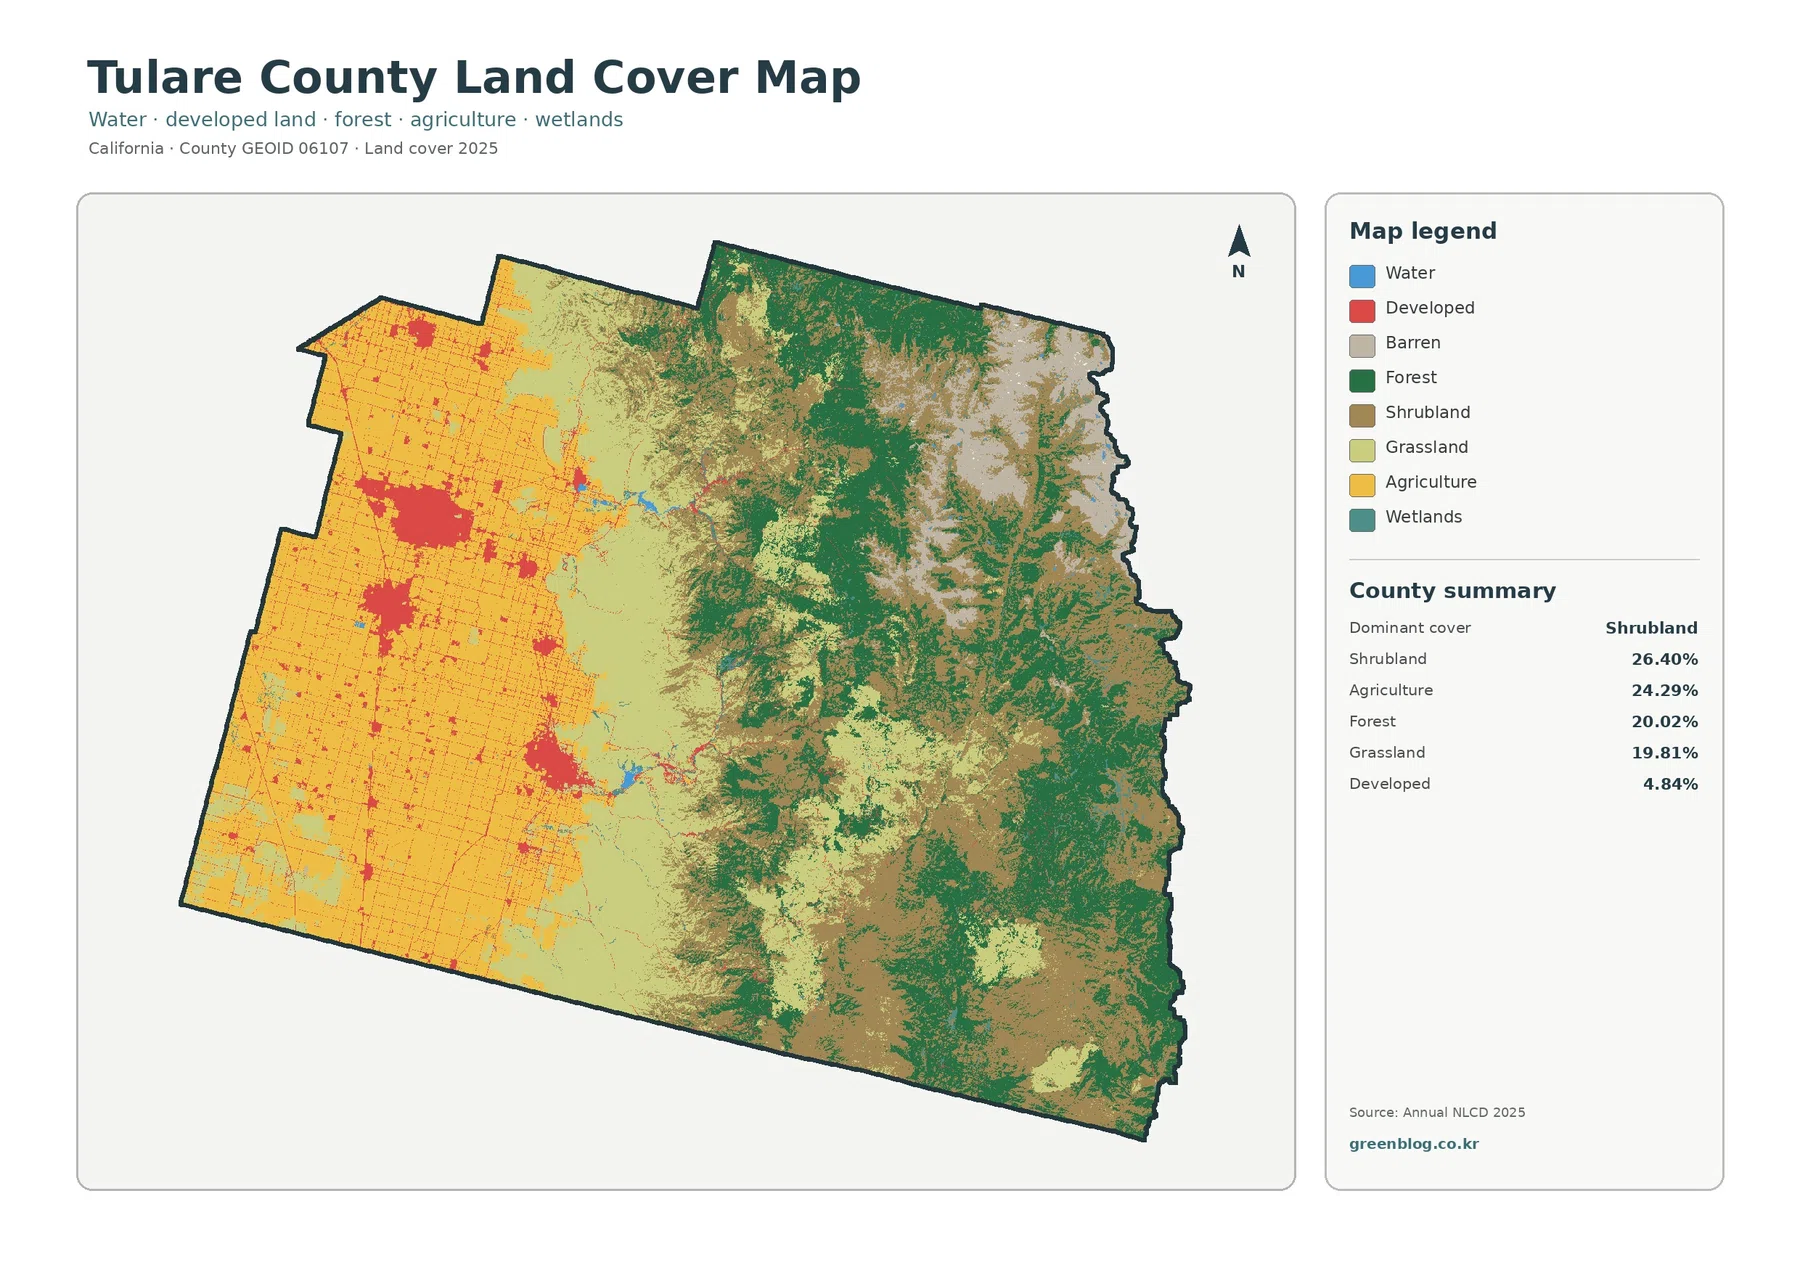
A Tulare County California Land Cover Map makes one of the county’s strongest geographic contrasts easy to see. Broad agricultural cover dominates much of the western valley, while the eastern half breaks into shrubland, grassland, forest, and higher barren terrain toward the Sierra Nevada. The 2025 summary is unusually balanced: shrubland accounts for 26.40%, agriculture 24.29%, forest 20.02%, and grassland 19.81%, so no single class explains the county by itself.
This page compares four views of the same county: general land cover, forest and farmland, impervious surface and developed land, and mapped class differences from 1985 to 2025. WebP images provide quick on-page previews, while the four original JPG maps are available together in one download below. The set works best as a county-scale reference for comparing the Central Valley side of Tulare County with its foothill and Sierra landscapes.
Table of Contents
Agricultural West and Mountain East Divide the County Visually
The general land-cover view is the best place to start because the county changes character across the map. Yellow agricultural cover spreads across much of the west, with red developed areas and small water features embedded within the farmed landscape. Moving eastward, agriculture becomes less dominant. Shrubland and grassland occupy broad transitional areas, and darker forest cover becomes increasingly common through the mountain side of the county.
The far eastern terrain is more varied still. Forest alternates with shrubland, grassland, and light barren classes rather than forming one continuous green block. This pattern fits the broad rise from the San Joaquin Valley toward the Sierra Nevada, but the map should be read as surface classification rather than a detailed elevation model. Its value is in showing where the main land-cover categories concentrate and where they begin to mix.
Four Large Cover Classes Share Most of Tulare County
Tulare County is not a case where one category takes half or three quarters of the map. Shrubland leads at 26.40%, but agriculture is close at 24.29%. Forest and grassland are also substantial at 20.02% and 19.81%. Together, those four classes account for most of the county and explain why the map changes so strongly from west to east.
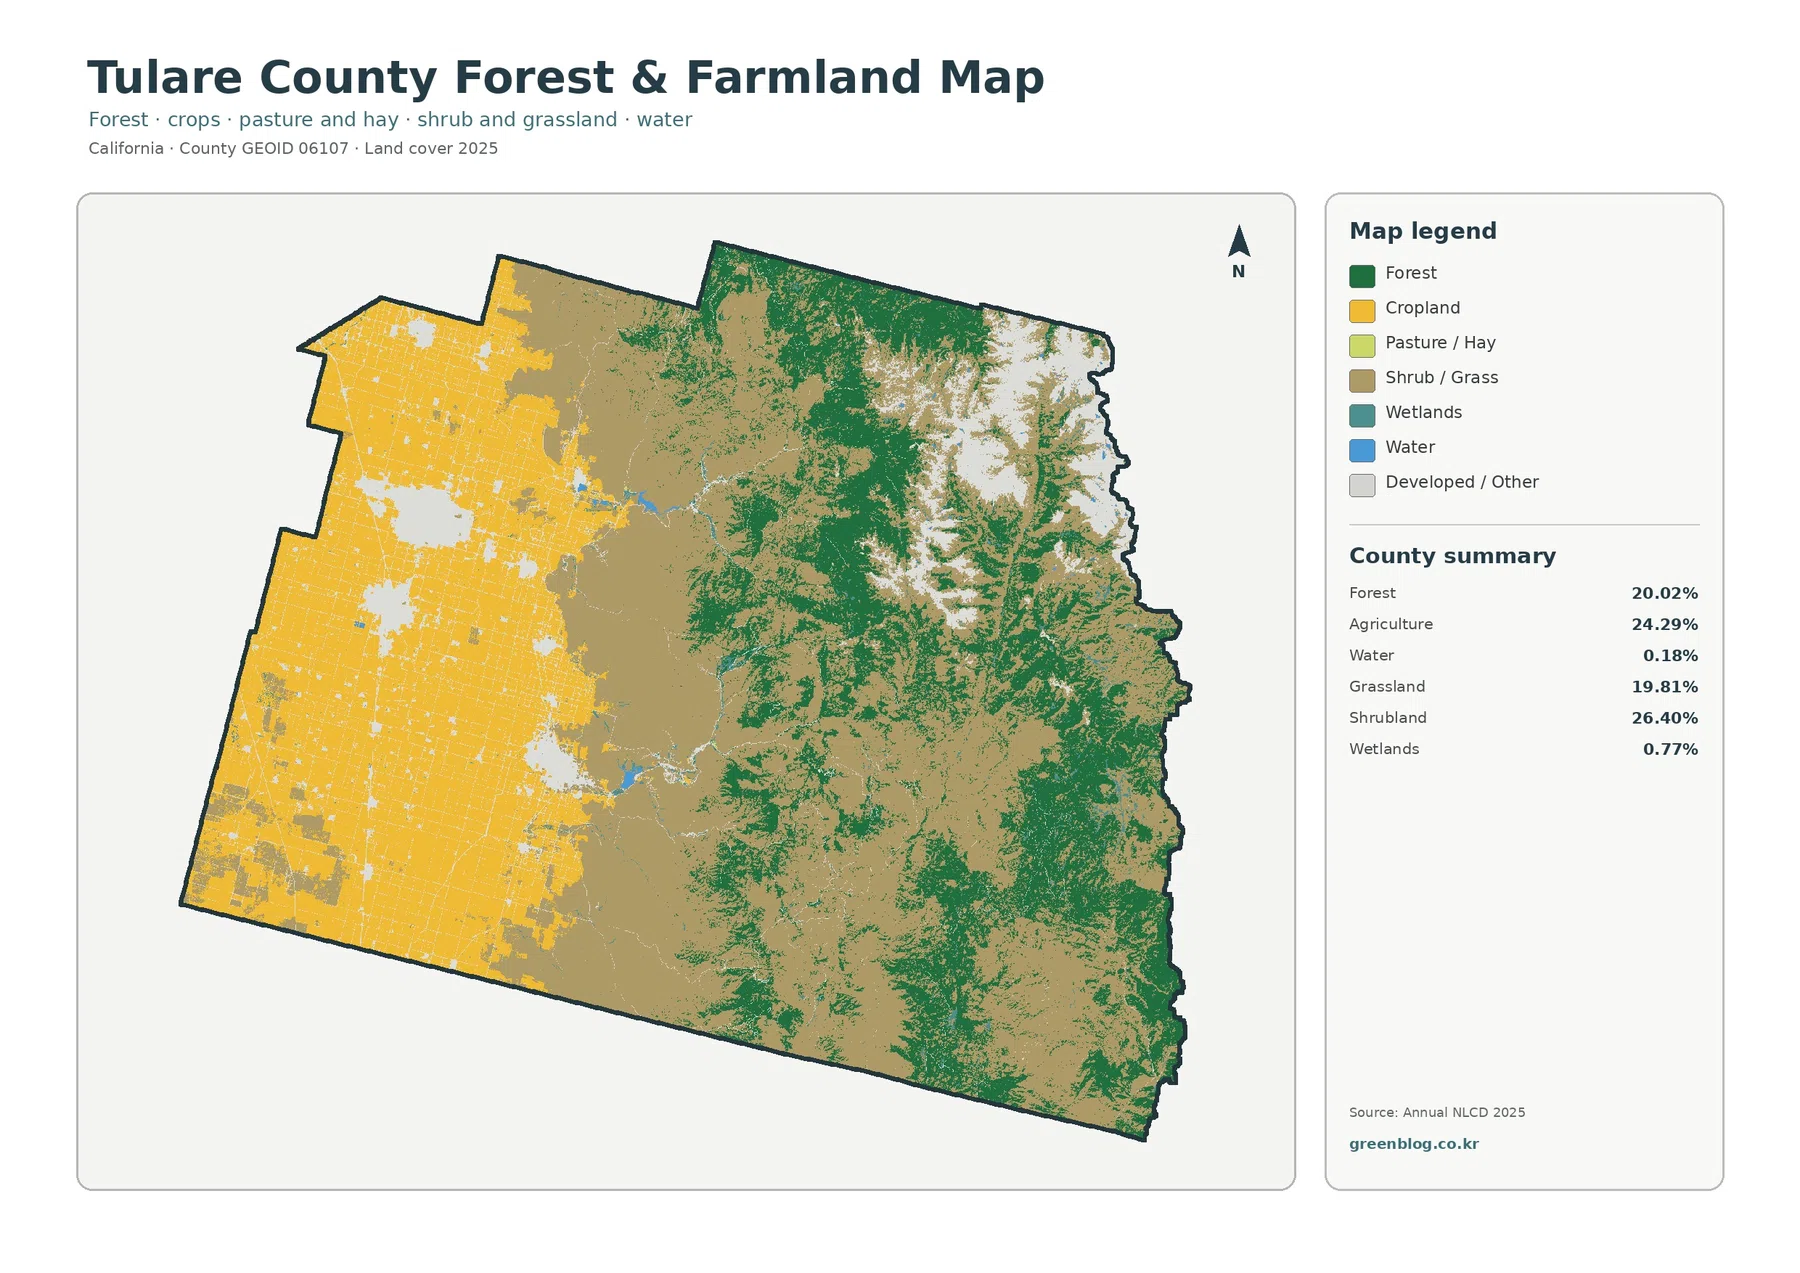
Developed land is much smaller at 4.84%. Water and wetlands are visible but occupy limited shares of the county in the forest-and-farmland summary, at 0.18% and 0.77% respectively. These small percentages should not be mistaken for ecological importance. Countywide percentages describe area, not the function of a stream, wetland, reservoir, or riparian corridor within a particular watershed.
The Forest and Farmland View Clarifies the Valley-to-Sierra Transition
The forest-and-farmland map simplifies the colors so the western agricultural block stands out immediately. Cropland forms a broad, nearly continuous area across the valley side of the county. Forest, by contrast, is concentrated farther east and appears in large but interrupted patches. Between them lies a wide zone of shrub and grass cover, showing that the change from farmed valley to forested mountains is gradual rather than a single sharp boundary.
This view is especially useful when a project needs to compare productive farmland with less intensively developed natural cover. It does not identify crop species, ownership, grazing permits, or parcel boundaries. The Tulare County Agricultural Commissioner publishes separate crop and livestock reports for those kinds of agricultural details. The map here simply shows where the surface was classified as agriculture in the 2025 land-cover product.
Sierra Water Context Helps Explain Why the Two Halves Matter Together
Eastern Tulare County reaches into the southern Sierra Nevada, including a large part of Sequoia National Park. The National Park Service describes this region as a landscape of high mountains, deep canyons, forests, foothills, and major river headwaters. Its water-resources material notes that Sierra snow and streams supply water downstream to agricultural lands in Tulare and neighboring counties. That broader setting helps explain why a land-cover comparison between mountain vegetation and valley agriculture is useful, even though this map itself is not a hydrology model.
Blue water features occupy only 0.18% of the county in the 2025 summary used here, and wetlands account for 0.77%. Their limited area does not mean they should be ignored. Instead, the percentages remind readers that land cover measures surface area, while water can influence landscapes well beyond the pixels classified directly as water or wetland. For watershed study, the land-cover maps are best paired with dedicated stream, reservoir, snowpack, and watershed datasets.
Impervious Cover Is Concentrated in a Small Part of a Large County
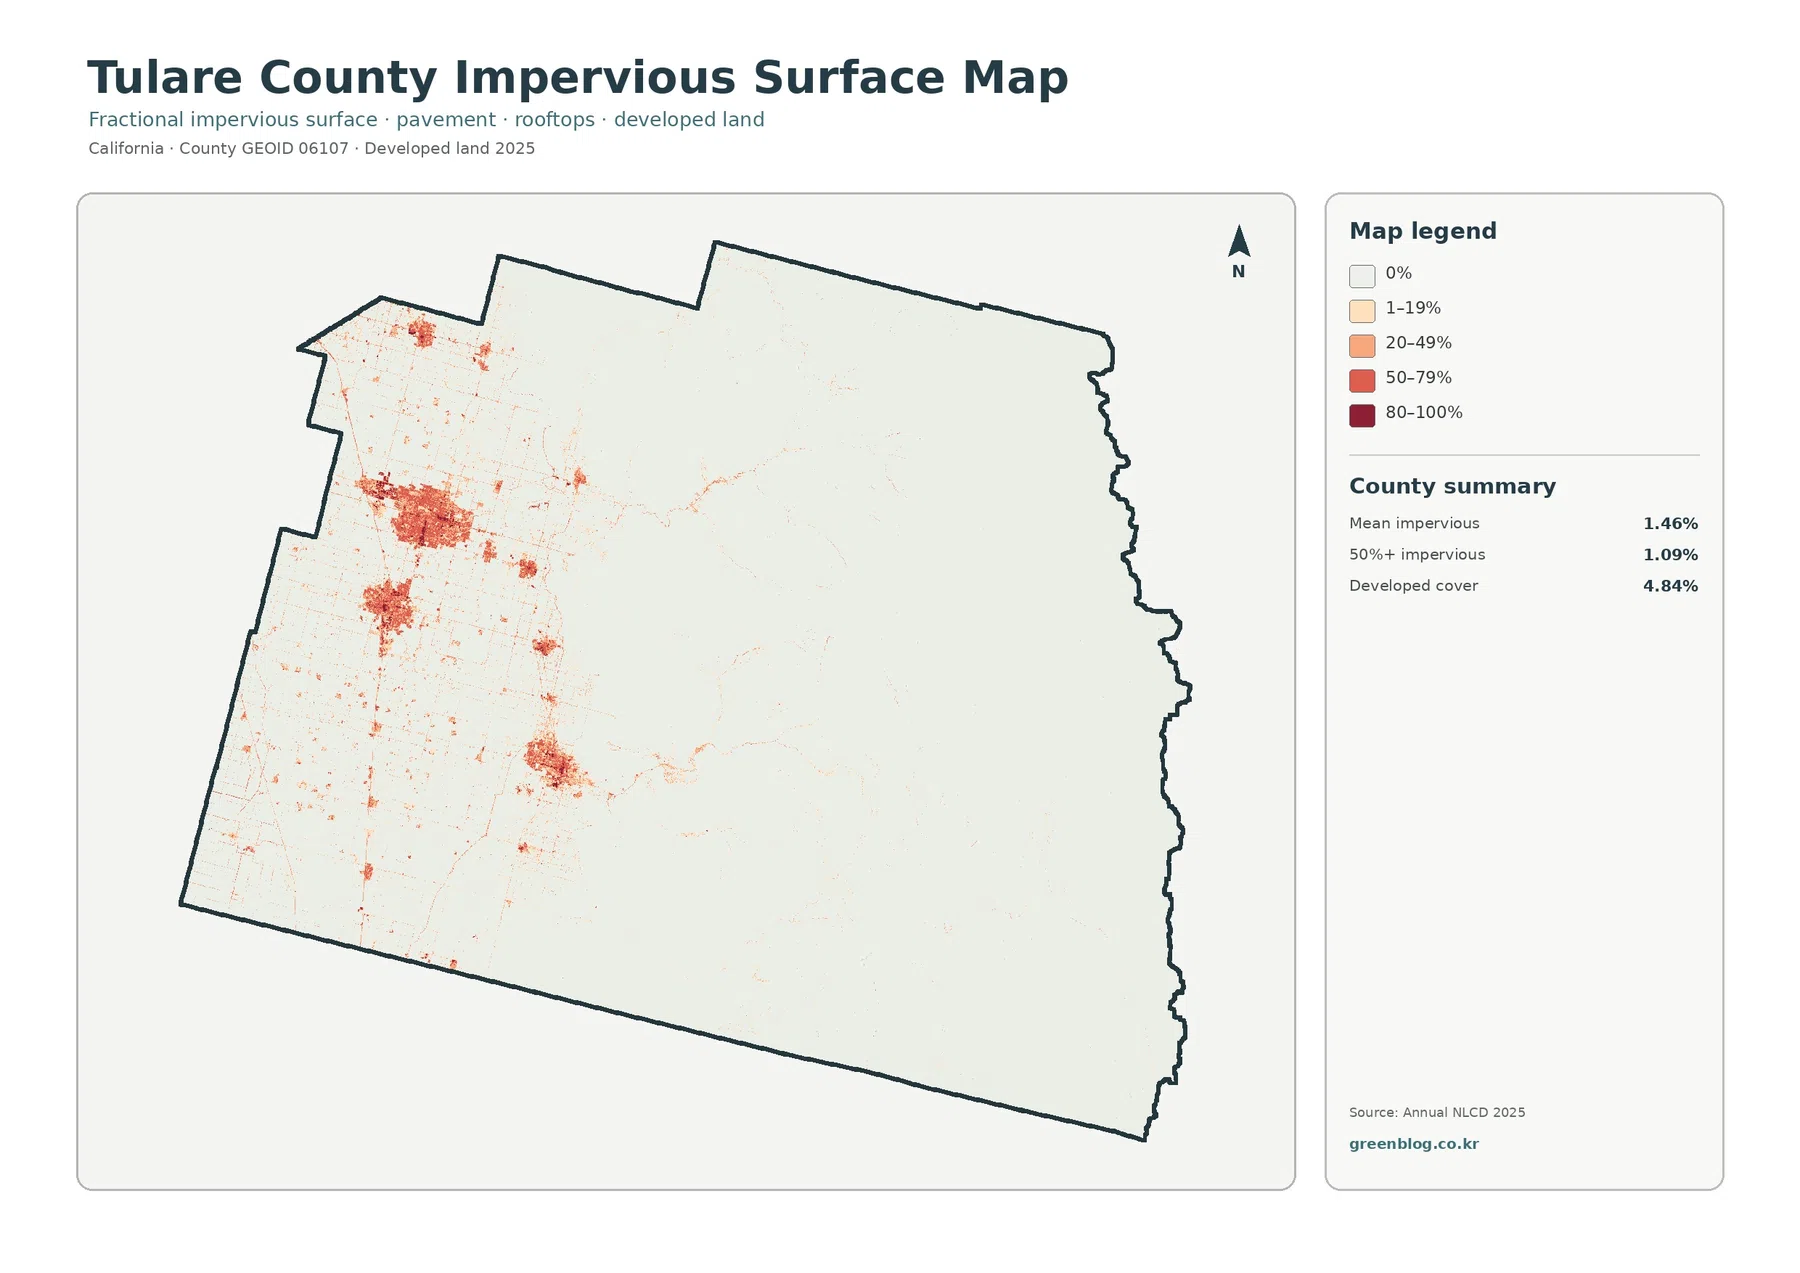
Impervious surface means pavement, rooftops, and similar surfaces that do not readily absorb rainfall. Tulare County’s mapped mean impervious value is 1.46%, and only 1.09% of the county falls in areas with at least 50% impervious cover. Those numbers are much smaller than the 4.84% developed-land share because a developed land-cover class can include lawns, trees, bare ground, and other surfaces alongside pavement and buildings.
The impervious map shows the strongest orange and red clusters on the western side of the county. Several urban concentrations are visible within the farmed valley, and thinner linear traces extend through the agricultural landscape. The eastern mountains are almost entirely pale by comparison. At county scale, this is a clear picture of concentrated built surfaces rather than widespread hard cover.
The 1985–2025 Change Map Is a Classification Comparison, Not a Cause Map
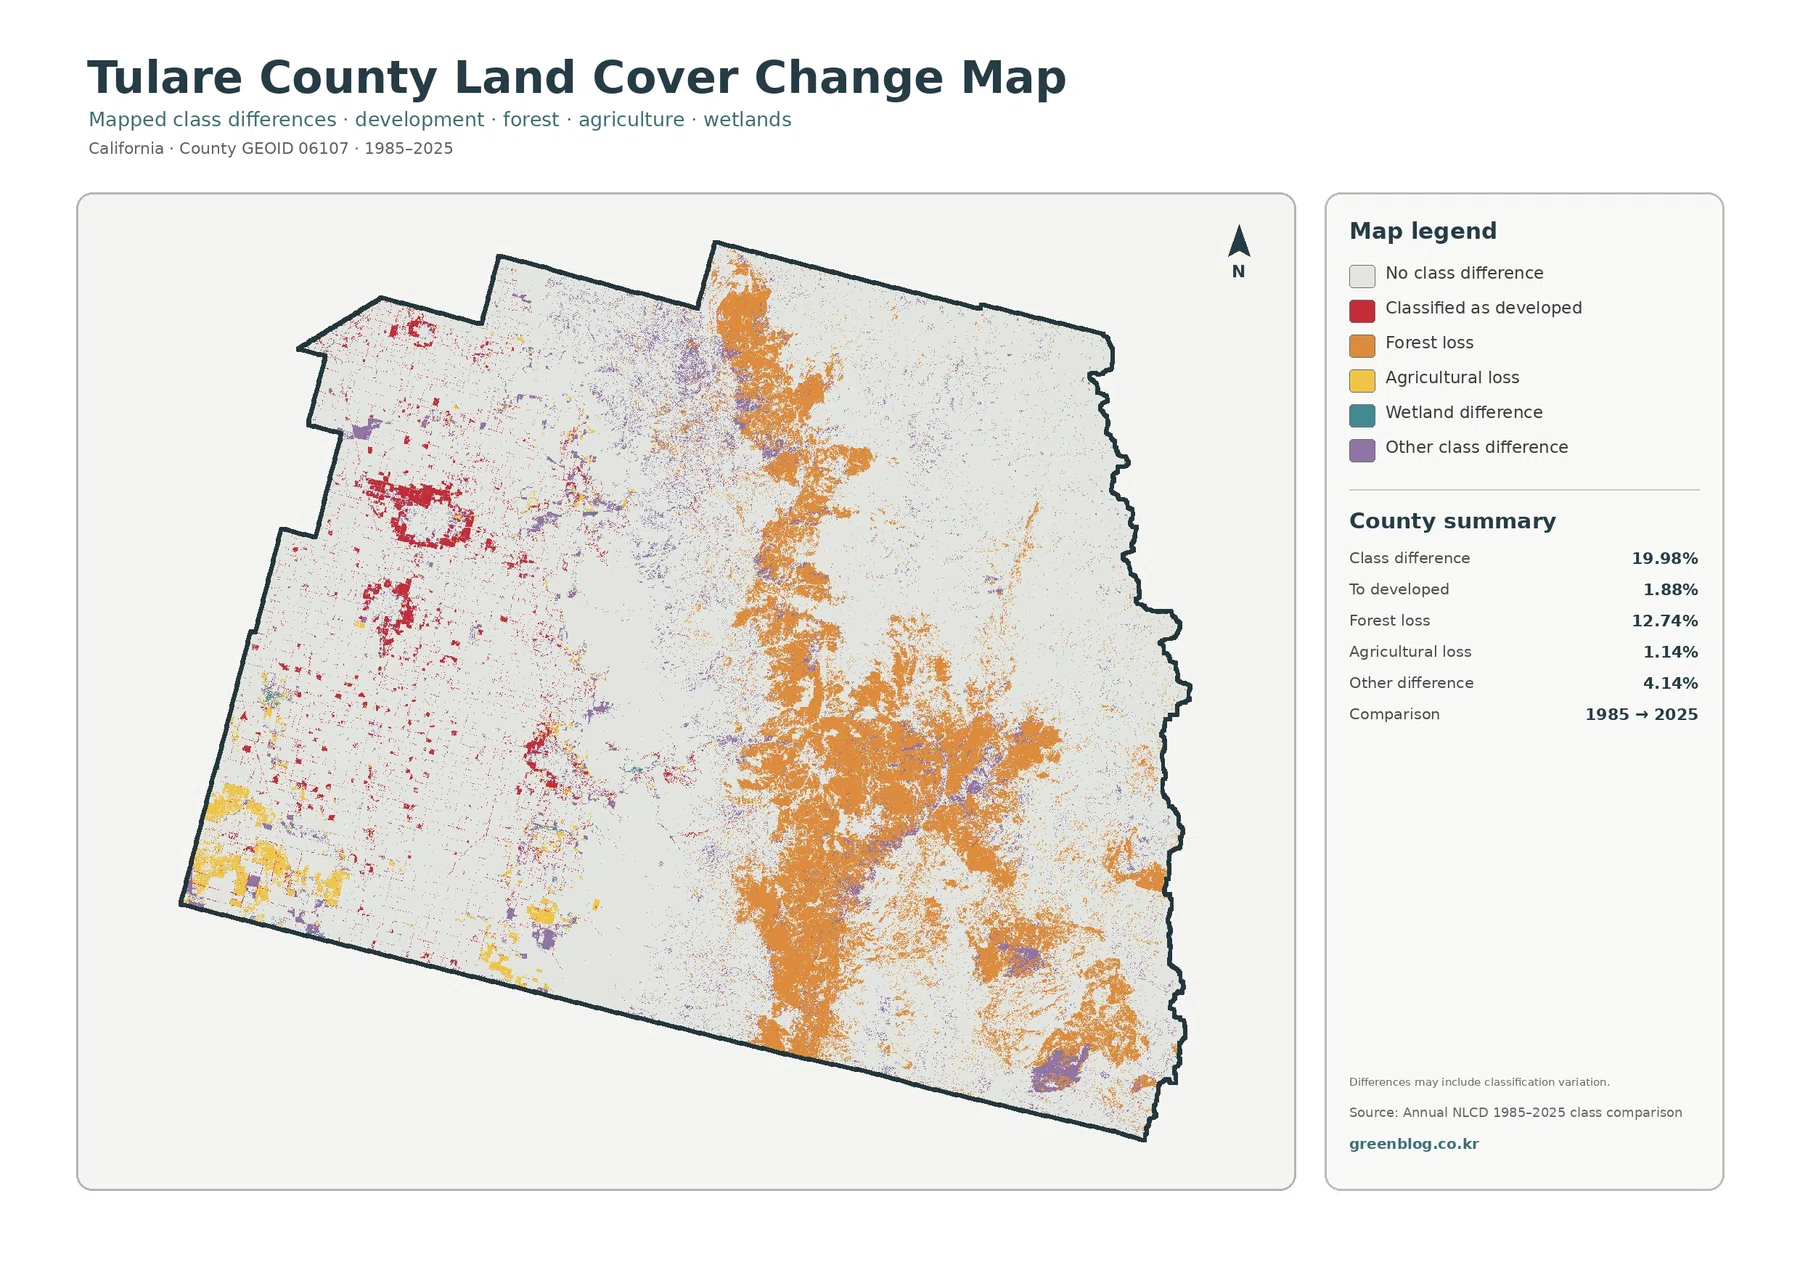
The change product marks cells whose 1985 and 2025 land-cover classifications differ. In Tulare County, the total mapped class difference is 19.98%. The summary assigns 12.74% to forest loss, 1.88% to change classified as developed, 1.14% to agricultural loss, and 4.14% to other class differences. Orange forest-loss classifications are especially noticeable from the central foothill zone into the eastern mountain landscape, while red developed-change classes occur more often around the western valley’s built areas.
These categories should not be treated as a direct record of wildfire, logging, urban construction, or permanent land conversion. The map itself warns that differences may include classification variation. Seasonal vegetation, mixed pixels, sensor differences, and changes in classification can all affect how a location is labeled. Anyone investigating the cause of a specific change should compare additional years, aerial photography, fire history, forestry records, and local land-use information.
A Practical Way to Compare the Four Maps
For a broad county description, begin with the general land-cover map. It shows the agricultural west, the mixed foothill transition, and the forested mountain side in one frame. Move to the forest-and-farmland map when the goal is to separate cultivated land from forest and open vegetation more clearly. This two-map sequence works well for classroom explanations because the same county boundary stays fixed while the legend becomes more focused.
Use the impervious map for a different question: where are pavement and rooftops most concentrated? The answer is not identical to the developed-land class on the first map. Finally, use the change map when looking for places where 1985 and 2025 classifications disagree. Keeping those purposes separate prevents a common mistake—treating current developed cover, impervious percentage, and long-term class change as if they were the same measurement.
The set can support regional presentations, environmental education, preliminary landscape comparisons, and planning context. It can also help a reader decide where more detailed data are needed. A farm-focused project may move next to crop reports and irrigation information; a mountain project may need fire history, forest management, or park data; and an urban project may require parcel, road, or zoning layers. These maps are a starting reference rather than a replacement for those specialized sources.
Read the Colors at County Scale, Not as Parcel Boundaries
Land cover describes what the surface was classified as, not what the land is legally allowed to be used for. A forest pixel does not identify public ownership, national-park status, or a timber-management boundary. An agricultural pixel does not define a farm parcel or tell you which crop is planted. A developed pixel does not establish zoning or a building permit.
Annual NLCD is raster data, meaning the landscape is divided into grid cells. At boundaries between orchards, roads, homes, grass, shrub, and forest, one cell can contain a mixture of surfaces. That mixed-pixel effect is important in Tulare County because the map includes both very large agricultural blocks and complicated foothill and mountain transitions. The exact edge of a field, stream, road, or forest stand may therefore differ from the generalized edge shown here.
The classification year also matters. These maps summarize 2025 land cover and a 1985–2025 comparison. Land conditions can change after the observation period. For current property, development, hazard, or regulatory decisions, use the latest authoritative data from the relevant agency rather than relying on this static county graphic.
Download the Four Tulare County Land-Cover JPG Maps
The download contains the original JPG versions of all four maps discussed on this page: general land cover, forest and farmland, impervious surface and developed land, and the 1985–2025 land-cover change comparison. Each original image is 2480 × 1754 pixels. The files are preserved at the source resolution supplied with this package; they should not be described as confirmed high-resolution A3 output.
Frequently Asked Questions
What is the dominant land cover in Tulare County?
Shrubland is the largest single 2025 class at 26.40%, but agriculture is close at 24.29%, followed by forest at 20.02% and grassland at 19.81%. The county is therefore better understood as a combination of valley agriculture, open foothill vegetation, and Sierra forest than as a one-class landscape.
Does the 12.74% forest-loss class mean wildfire or logging removed that much forest?
No. It means cells classified as forest in the older comparison were assigned a different class in 2025. The map warns that classification variation may be included, so fire, logging, vegetation recovery, and mapping differences cannot be separated without additional evidence.
What is included in the Tulare County map download?
The ZIP contains four original 2480 × 1754 JPG files: the general land-cover map, forest-and-farmland map, impervious/developed-land map, and the 1985–2025 land-cover change map. The WebP images in the article are previews rather than additional download formats.
Sources and Reference Material
- MRLC Annual NLCD Data — annual land-cover data access and supporting products.
- USGS Annual NLCD Land Cover Classification — definitions for forest, shrubland, grassland, agriculture, developed land, and other classes.
- Tulare County Crop Report — official county crop and livestock reports for agricultural context.
- National Park Service — Sequoia & Kings Canyon Water Resources — Sierra Nevada river, snowpack, and downstream agricultural-water context.
- U.S. Census Bureau TIGER/Line Shapefiles — county boundary reference data.
Map File Information
The ZIP contains four original JPG maps for comparing Tulare County agriculture, forest and open vegetation, developed surfaces, and mapped class differences from 1985 to 2025.
- File Type: Four JPG files in one ZIP archive
Related Maps
- Alameda County California Land Cover Map
- Alpine County California Land Cover Map
- Amador County California Land Cover Map
Green Map creates custom-edited map images using open geographic data sources such as geoBoundaries, Natural Earth, OpenStreetMap, and government open data.
These maps are edited visual materials, not raw data files, and are provided for education, documents, presentations, and graphic reference.