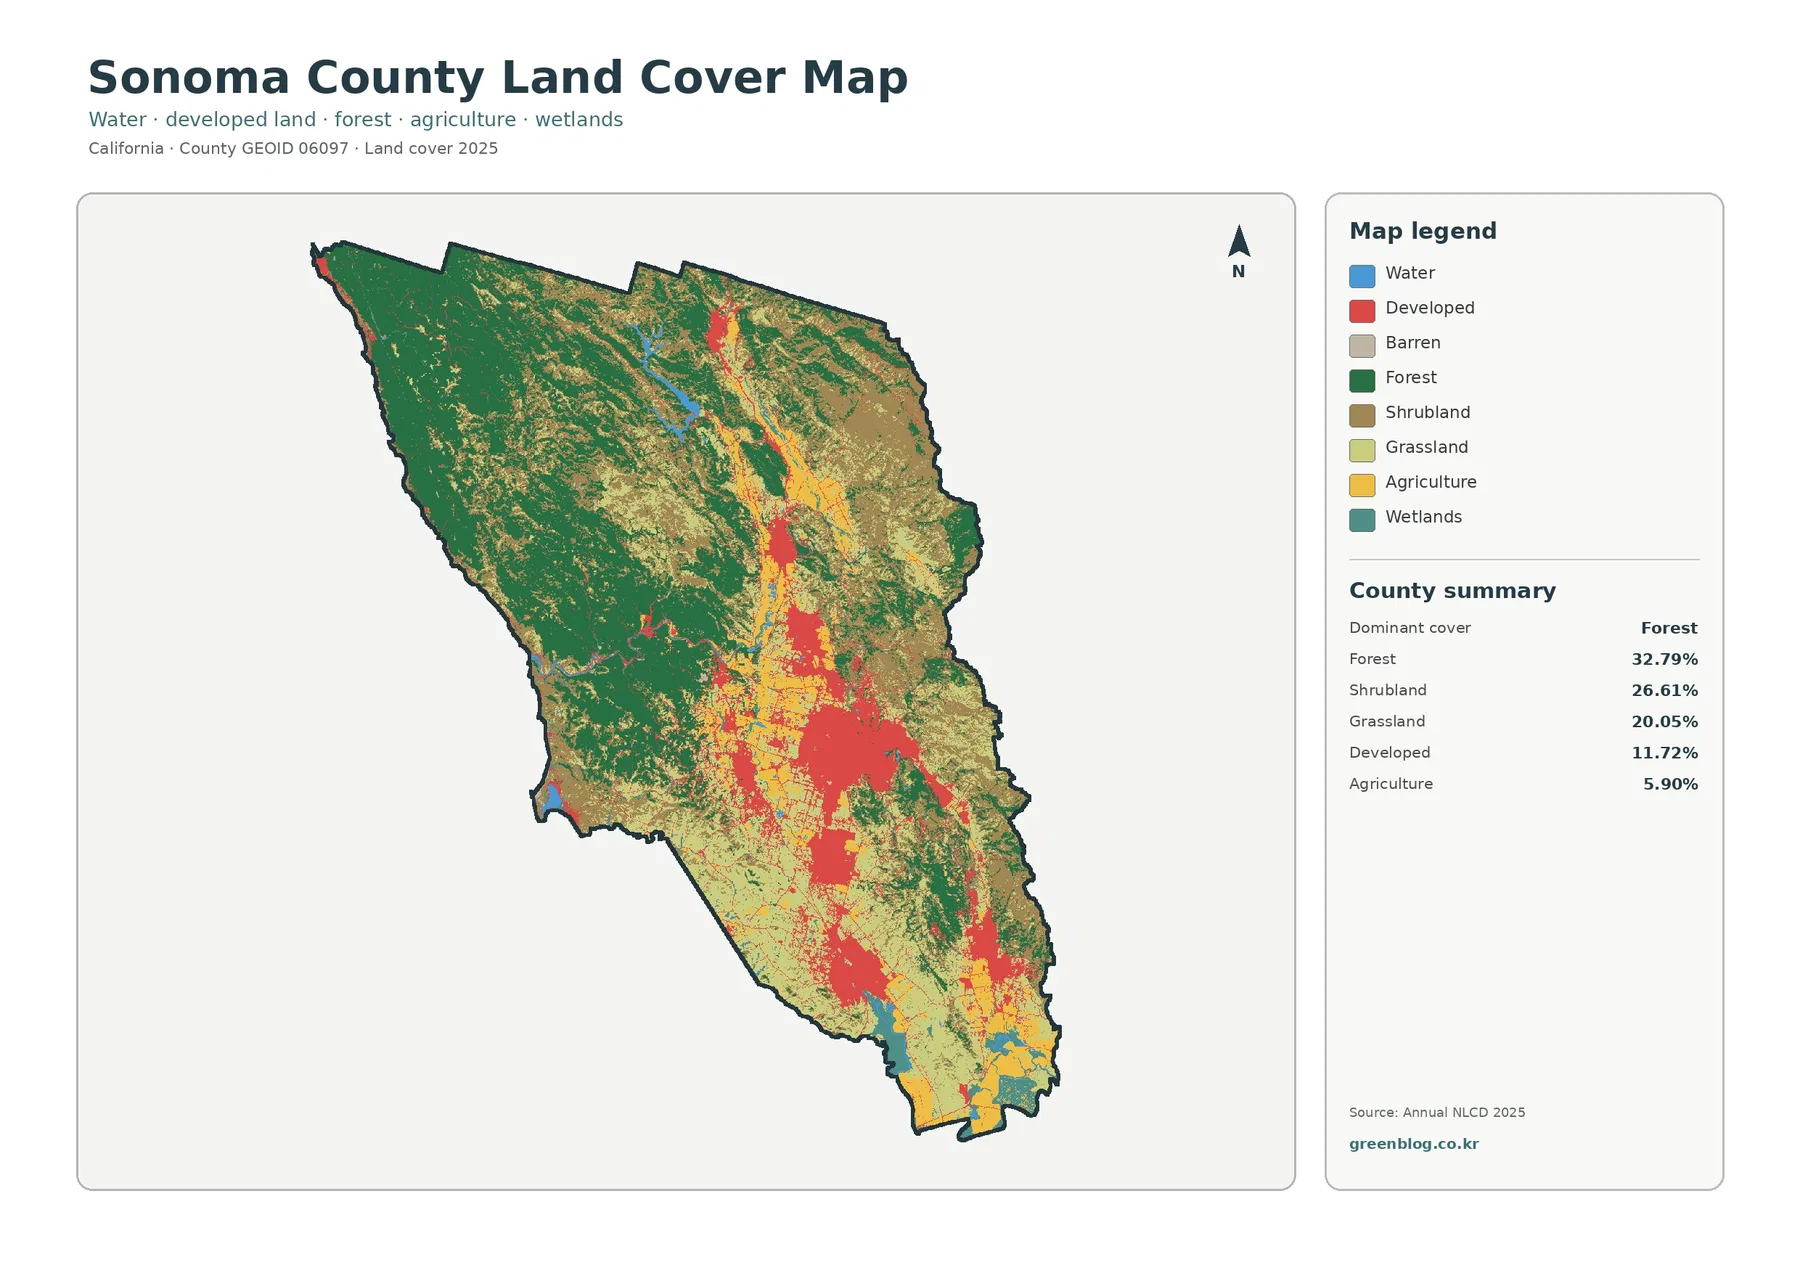
The Sonoma County California Land Cover Map is dominated by contrast rather than one uniform landscape. Forest covers 32.79% of the county and is especially broad in the west and northwest, while shrubland accounts for 26.61% and grassland 20.05% across much of the interior. Developed cover reaches 11.72% and forms distinct clusters around Santa Rosa, Rohnert Park, Petaluma, and other towns instead of spreading evenly across the county. Agriculture makes up 5.90%, but its valley pattern is much easier to see on the map than that countywide percentage alone suggests.
This page pairs four views of the same county: 2025 land cover, forest and farmland, impervious surface and developed land, and a 1985–2025 class-difference map. The four original JPG maps are available together in one download, while the article uses smaller WebP previews for easier viewing. These are land-cover maps based on classified surface conditions, not zoning maps, parcel maps, ownership records, or a legal inventory of farms, wetlands, or forests.
Table of Contents
A County Where Urban Areas Remain Visibly Separate
The developed pattern is one of the easiest ways to orient yourself. Santa Rosa forms the largest concentration near the center of the county, with Rohnert Park and Cotati to the south and Petaluma forming another strong cluster farther down the county. Smaller developed areas appear around Healdsburg and Cloverdale in the north and around Sonoma in the southeast. Between those places, the map returns quickly to agriculture, grassland, shrubland, or forest. That separation makes Sonoma County look very different from a continuously built metropolitan county.
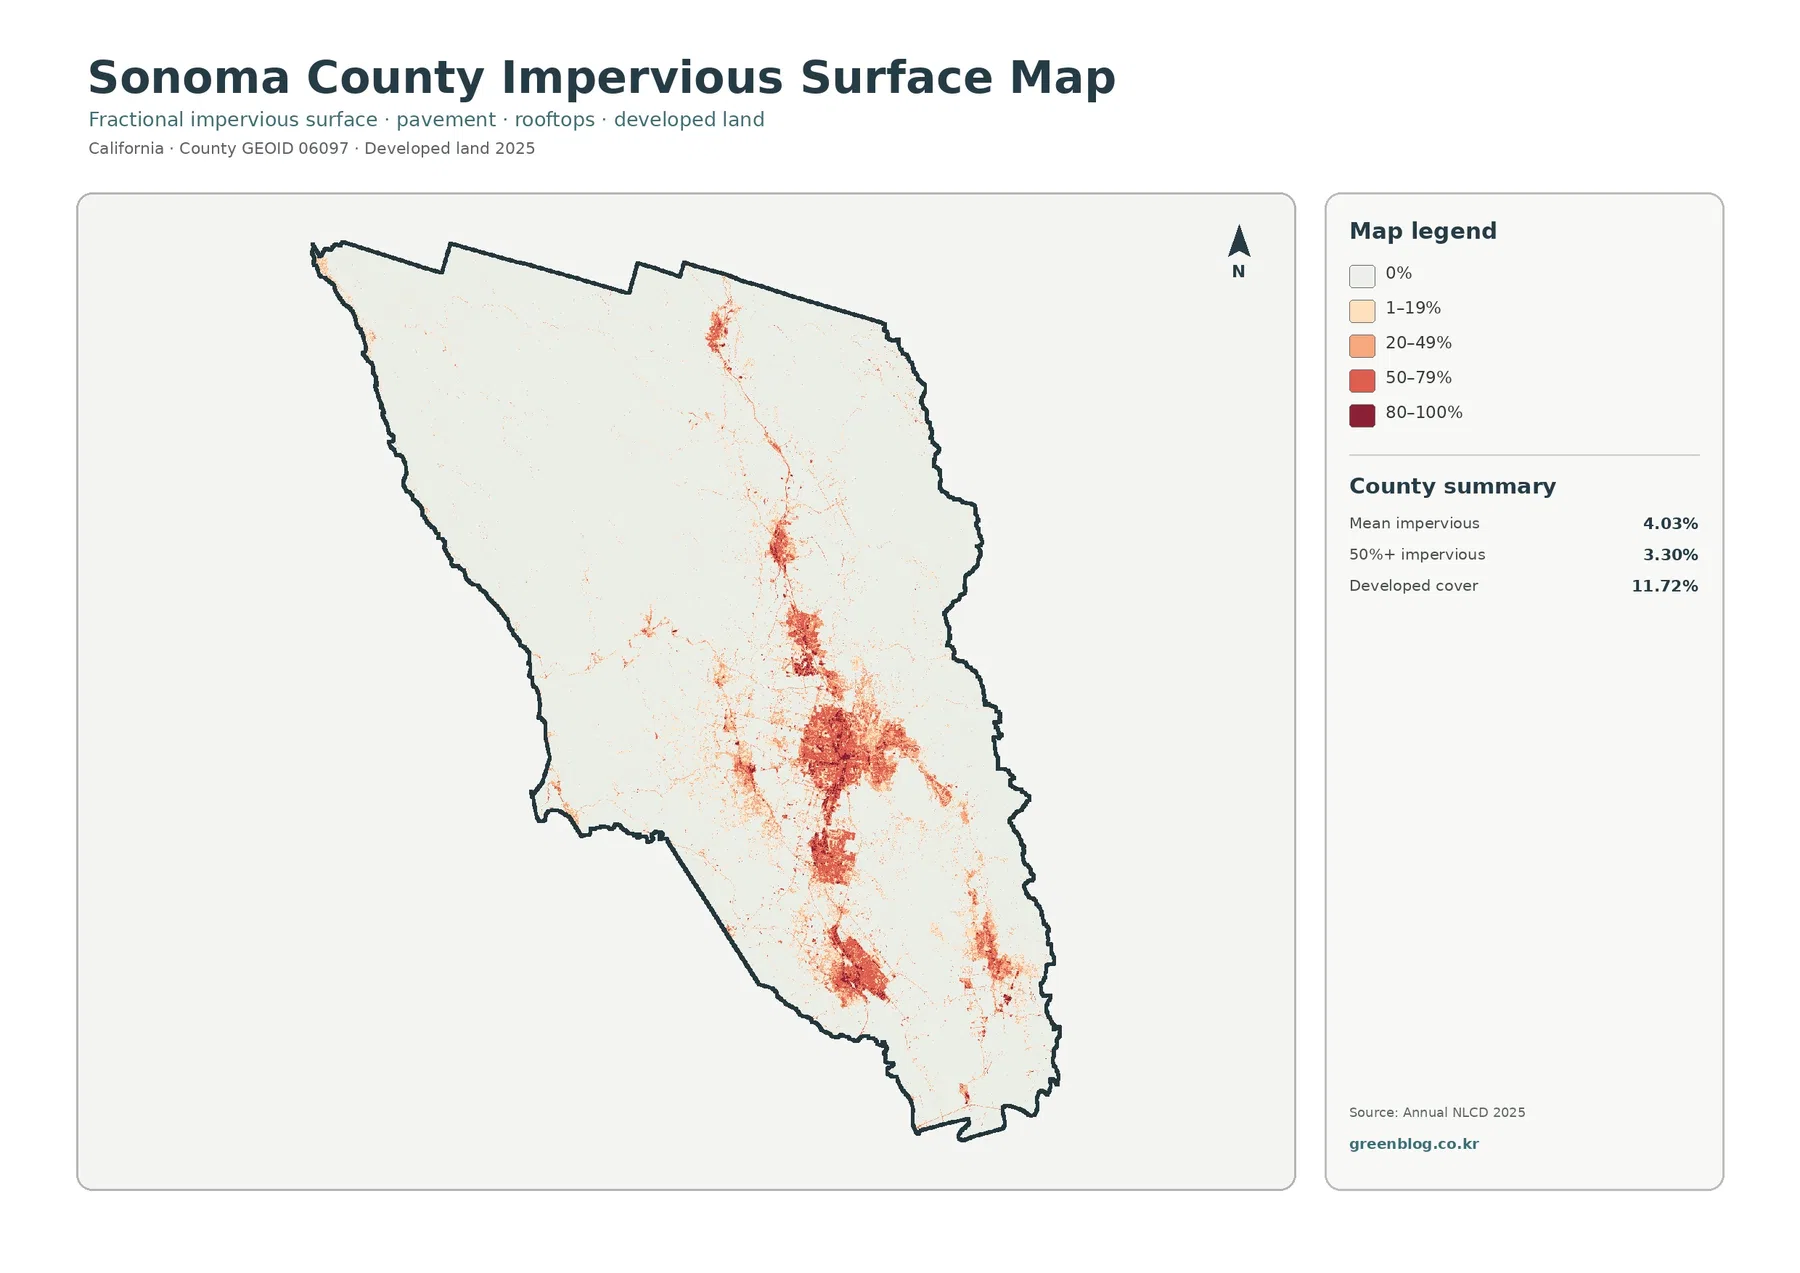
The impervious-surface map sharpens that distinction. Mean impervious cover is 4.03%, and only 3.30% of the county is mapped at 50% impervious or higher. Roofs, pavement, parking areas, and other surfaces that shed water instead of absorbing it are strongly concentrated in the same urban clusters, especially around Santa Rosa. Large areas of the west, northwestern uplands, and open interior remain almost blank on this map even when they contain roads, homes, farms, or other human uses.
The Western Half Is Defined by Broad Forest Cover
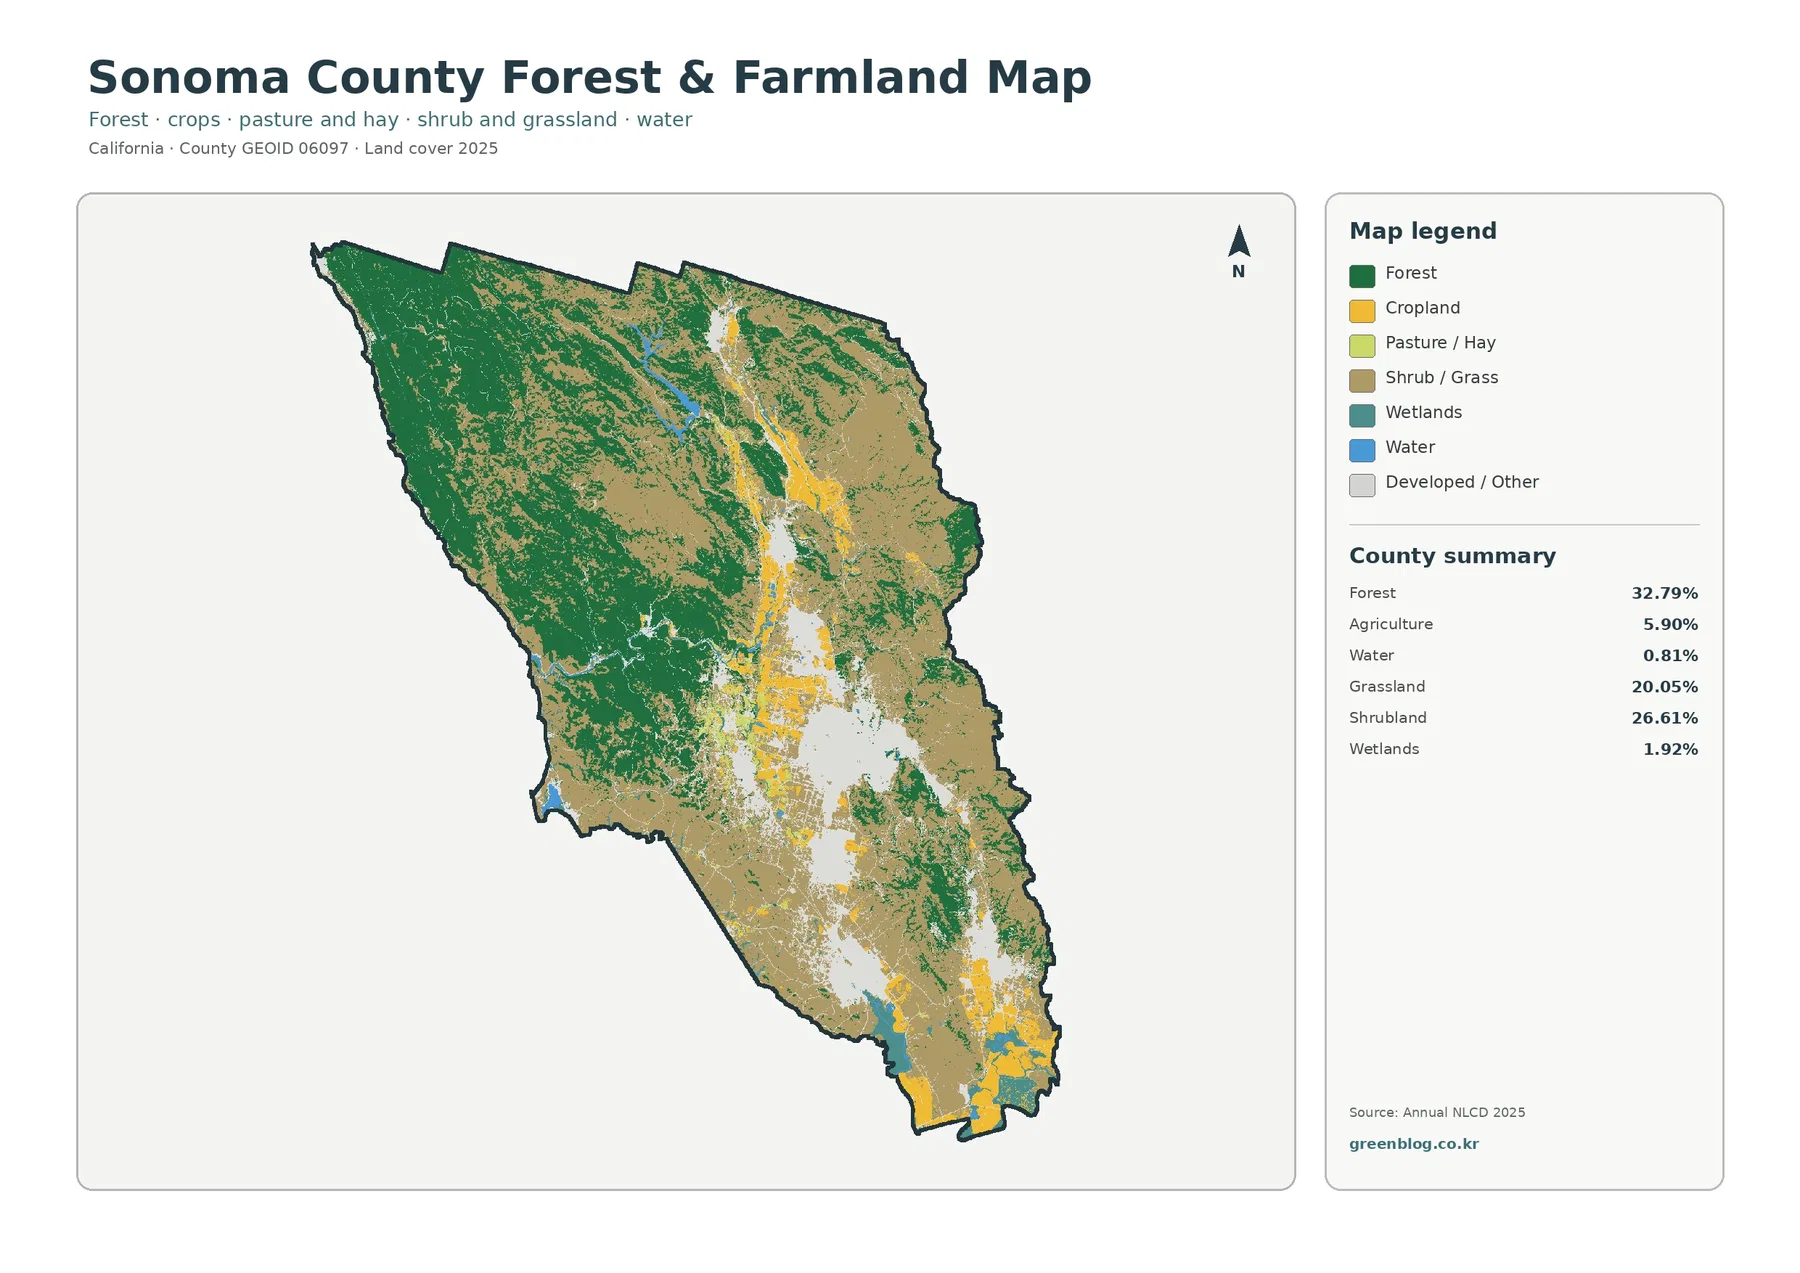
Forest is the largest 2025 class at 32.79%. It forms the broadest continuous block along the western side and across much of the northwest. Moving toward the central valleys, that dark green cover becomes more broken and mixes with shrubland, grassland, agriculture, and development. The county’s General Plan resource-conservation material separately notes that important timber soils are concentrated in the northwest county and Russian River area. That planning document is not the same as a land-cover classification, but it provides useful local context for the broad forest pattern visible here.
The forest class should not be read as a tree-species map. The Annual NLCD classification groups surface cover into broad categories, so a green cell does not tell you whether the land is redwood, oak woodland, managed timberland, parkland, or privately owned forest. The map is strongest at county scale: it shows where tree cover forms large areas and where those areas break into open land, farms, or developed valleys.
Shrubland and Grassland Fill Much of the Interior
Shrubland at 26.61% and grassland at 20.05% together account for a very large share of Sonoma County. They are especially common in the interior and eastern parts of the county, where the map has a patchwork of tan and pale green instead of the broad dark-green forest seen farther west. Those classes also appear between agricultural valleys and forested slopes, creating gradual transitions rather than a simple line between “forest” and “farmland.”
Neither class should be treated as unused land. Grassland may occur on ranches, open hills, protected lands, or other settings, and shrubland can represent natural vegetation on slopes and drier areas. Land cover describes what is on the surface, not whether a property is buildable, protected, publicly owned, grazed, or assigned to a particular zoning district. That distinction is especially important in Sonoma County, where agricultural preservation and open-space programs overlap a complicated rural landscape.
Agriculture Is a Smaller Percentage but a Strong Valley Signal
Agriculture accounts for 5.90% of the county, yet the forest-and-farmland map makes it visually prominent because many agricultural cells occur in relatively narrow valleys and flatter corridors. Sonoma County’s General Plan identifies important agricultural soils in Sonoma Valley, west Sebastopol, west Santa Rosa, Alexander Valley, and Dry Creek Valley. Those named areas help explain why yellow agricultural cover is concentrated in particular parts of the county rather than spread uniformly across the hills.
Sonoma County also maintains a vineyard-appellation GIS layer that includes names such as Russian River Valley, Sonoma Coast, Sonoma Mountain, and Sonoma Valley. That layer is useful background for a county famous for vineyard agriculture, but it should not be confused with the map on this page. The Annual NLCD agriculture class does not label individual vineyards or grape varieties, and not every yellow cell is a vineyard. For parcel-level crop information, a dedicated agricultural dataset is the better source.
Water and Wetlands Are Small by Area but Useful for Orientation
Water is 0.81% and wetlands 1.92% in the 2025 summary. Those are small countywide shares, but blue and teal cells still provide important reference points. The Russian River and associated water bodies cut through a landscape otherwise dominated by forest, shrubland, grassland, agriculture, and development. Small wet areas also appear in low-lying and drainage settings where they can be easy to miss if you focus only on the five largest percentage classes.
A land-cover wetland class is not a legal wetland boundary. Narrow channels, seasonal wet areas, mixed vegetation, and small features can be simplified by the raster grid. Any decision involving wetland permits, water rights, flood hazards, or environmental regulation requires current agency data and site-specific review. Here, the water and wetland classes are best used to see how those surfaces fit into the countywide pattern.
Reading the 2025 Map as One Connected Pattern
The general land-cover map brings the pieces together. The west is heavily forested; the interior contains large areas of shrubland and grassland; agricultural cover follows selected valleys; and developed land forms separate clusters around the county’s cities. Rather than describing Sonoma County as simply “wine country,” “forest,” or “urban North Bay,” the map shows why all three labels can be incomplete on their own. Each describes a real part of the county, but none represents the whole surface pattern.
This is also where the percentages become more useful. Forest is the largest single class, but shrubland plus grassland together exceed it. Developed cover is large enough to be visually important but remains concentrated. Agriculture is relatively small countywide yet strongly localized. A reader who looks only at percentages could miss those location differences, while a reader who looks only at colors without the summary could overestimate a visually bright class. Using the two together gives a better sense of scale.
What the 1985–2025 Difference Map Can and Cannot Tell You
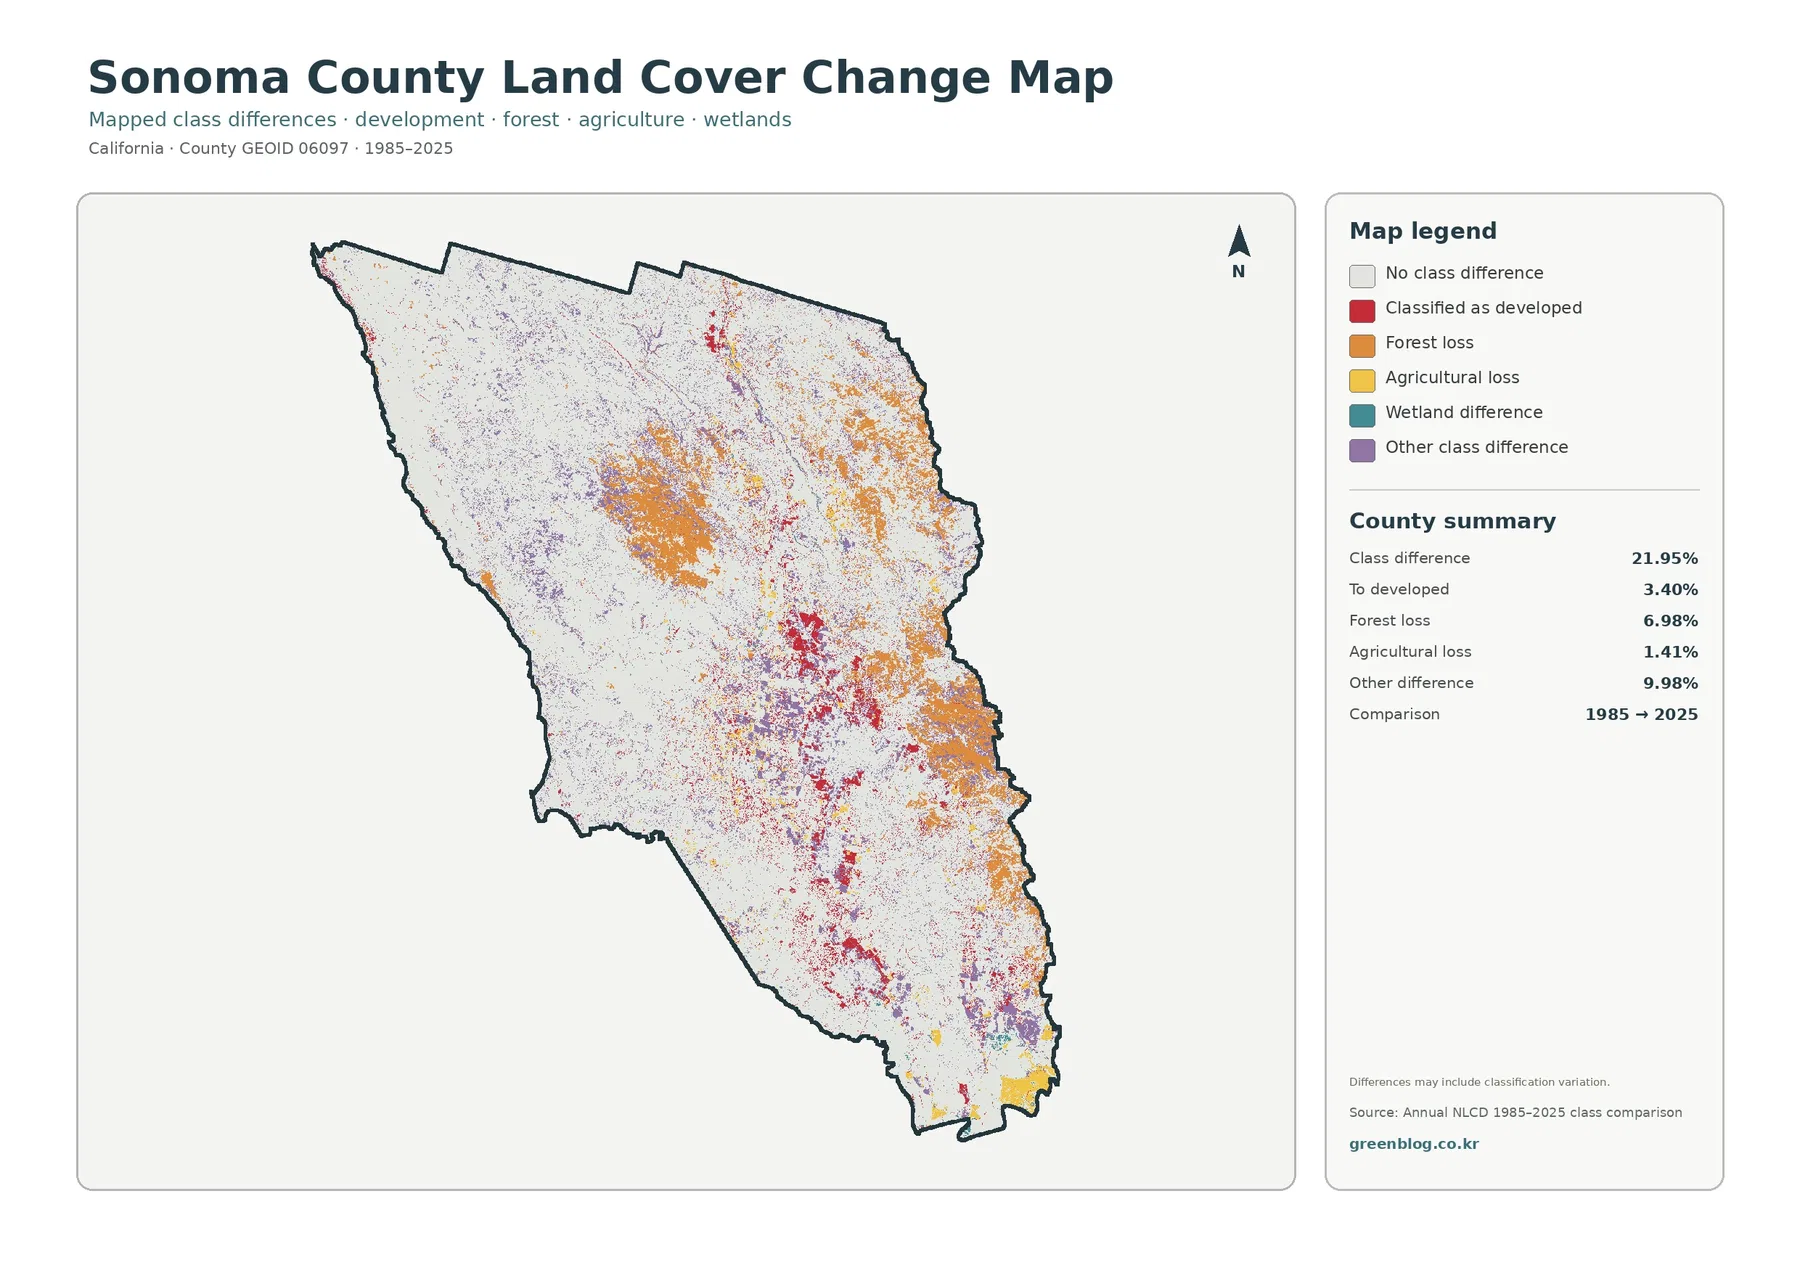
The long-term comparison marks 21.95% of the county as a class difference between 1985 and 2025. Within that summary, 3.40% is categorized as a change to developed, 6.98% as forest loss, 1.41% as agricultural loss, and 9.98% as other class difference. Orange forest-loss cells are scattered across broad portions of the county, while red cells categorized as developed change are more concentrated near existing urban areas and valley corridors. The pattern is useful for finding places that deserve a closer look.
It is not a direct map of construction, logging, wildfire, vineyard conversion, or habitat loss. The map itself warns that differences can include classification variation. A 30-meter cell can contain mixed surfaces, and differences in imagery or classification between years may move a cell from one category to another even when the real-world change is subtle. The “forest loss” figure therefore means that cells once classified as forest were classified differently in 2025; it does not by itself identify the cause.
For research on a specific site, use the change map as an index rather than a conclusion. A cluster of red cells can be checked against historical aerial imagery and planning records. A forest-loss cluster can be compared with fire history, vegetation mapping, or forestry records. Agricultural-loss cells can be checked against local crop and parcel data. That follow-up work is necessary before assigning a cause to the mapped difference.
A Practical Way to Compare the Four Maps
Start with the general map to identify the large surface zones. Then use the forest-and-farmland map to separate tree cover, agricultural areas, shrub and grass cover, water, and wetlands without the full set of developed classes competing for attention. The impervious map answers a different question: where are pavement and rooftops actually concentrated? Finally, the change map shows whether the same location was assigned a different class in 1985.
Santa Rosa is a good example. It appears as a large developed cluster in the general map, a light “developed/other” area in the forest-and-farmland view, and a strong impervious concentration on the urban-surface map. Parts of the surrounding area also appear in the long-term difference map. In contrast, much of the western forest stays dark green in the first two maps, nearly blank in the impervious view, and only selectively marked by change classes. Reading the same location across all four views prevents the maps from being treated as interchangeable.
Why a County-Scale Raster Is Not a Parcel Survey
Annual NLCD is raster data, meaning the surface is divided into grid cells and each cell receives a representative class. At roughly 30-meter scale, one cell may contain a house, road, lawn, trees, and bare ground at the same time. The classification simplifies that mixture into a dominant or modeled surface category. Small streams, narrow vineyard rows, neighborhood trees, field edges, and scattered buildings can therefore look more generalized than they do on aerial photography.
The date matters as well. These maps describe the supplied 2025 classification and the supplied 1985–2025 comparison. Construction, vegetation recovery, crop changes, or water conditions after the observation period may not appear. Use current local GIS, field surveys, property records, and regulatory maps when a decision depends on exact boundaries or present conditions. The maps here are most useful for countywide comparison, education, broad planning context, and visual reference.
Download the Four Sonoma County Land-Cover JPG Maps
The download contains the four original JPG files represented in the article: the 2025 land-cover map, forest-and-farmland map, impervious-surface/developed-land map, and the 1985–2025 land-cover-change map. Each file is 2480 × 1754 pixels. The source size is preserved rather than enlarged and presented as an A3 high-resolution file, so anyone planning a large print should first check whether the legend and small labels remain readable at the intended size.
Frequently Asked Questions
Does 32.79% forest mean that most of Sonoma County is wooded?
Forest is the largest single 2025 class, but it is not a majority of the county. Shrubland and grassland together cover an even larger share, and development, agriculture, water, and wetlands add further variety. Forest is especially concentrated in the west and northwest rather than evenly distributed across Sonoma County.
Can the agriculture class be used as a vineyard map?
No. Sonoma County has separate vineyard-appellation and agricultural datasets, but the Annual NLCD agriculture class is broader. It does not identify individual vineyard parcels, grape varieties, or legal agricultural zoning. Use a dedicated county agricultural dataset when vineyard boundaries are the actual question.
Does the 6.98% forest-loss class prove logging or wildfire?
No. It means cells classified as forest in the 1985 comparison were assigned another class in 2025. The map warns that classification variation may be included, and it does not identify a cause. Historical imagery, fire records, forestry information, or site-specific data are needed before attributing the difference to logging, fire, development, or another process.
Sources and Reference Material
- MRLC Annual NLCD Data — official access point for Annual NLCD land-cover data used for current and long-term comparison.
- USGS Annual NLCD Land Cover Classification — official explanation of land-cover classes and classification concepts.
- U.S. Census Bureau TIGER/Line Shapefiles — geographic boundary data for counties and other Census features.
- Sonoma County General Plan — Open Space & Resource Conservation Element — official county context for productive agricultural soils and timber soils.
- Sonoma County GIS — Vineyard Appellations — county GIS context for named vineyard regions such as Russian River Valley and Sonoma Valley.
Map File Information
The ZIP contains four original Sonoma County JPG maps covering 2025 land cover, forest and farmland, impervious/developed land, and 1985–2025 class differences.
- Printable Size: 2480 × 1754 pixels each
- File Type: Four JPG files in one ZIP archive
Related Maps
- Alameda County California Land Cover Map
- Alpine County California Land Cover Map
- Amador County California Land Cover Map
Green Map creates custom-edited map images using open geographic data sources such as geoBoundaries, Natural Earth, OpenStreetMap, and government open data.
These maps are edited visual materials, not raw data files, and are provided for education, documents, presentations, and graphic reference.