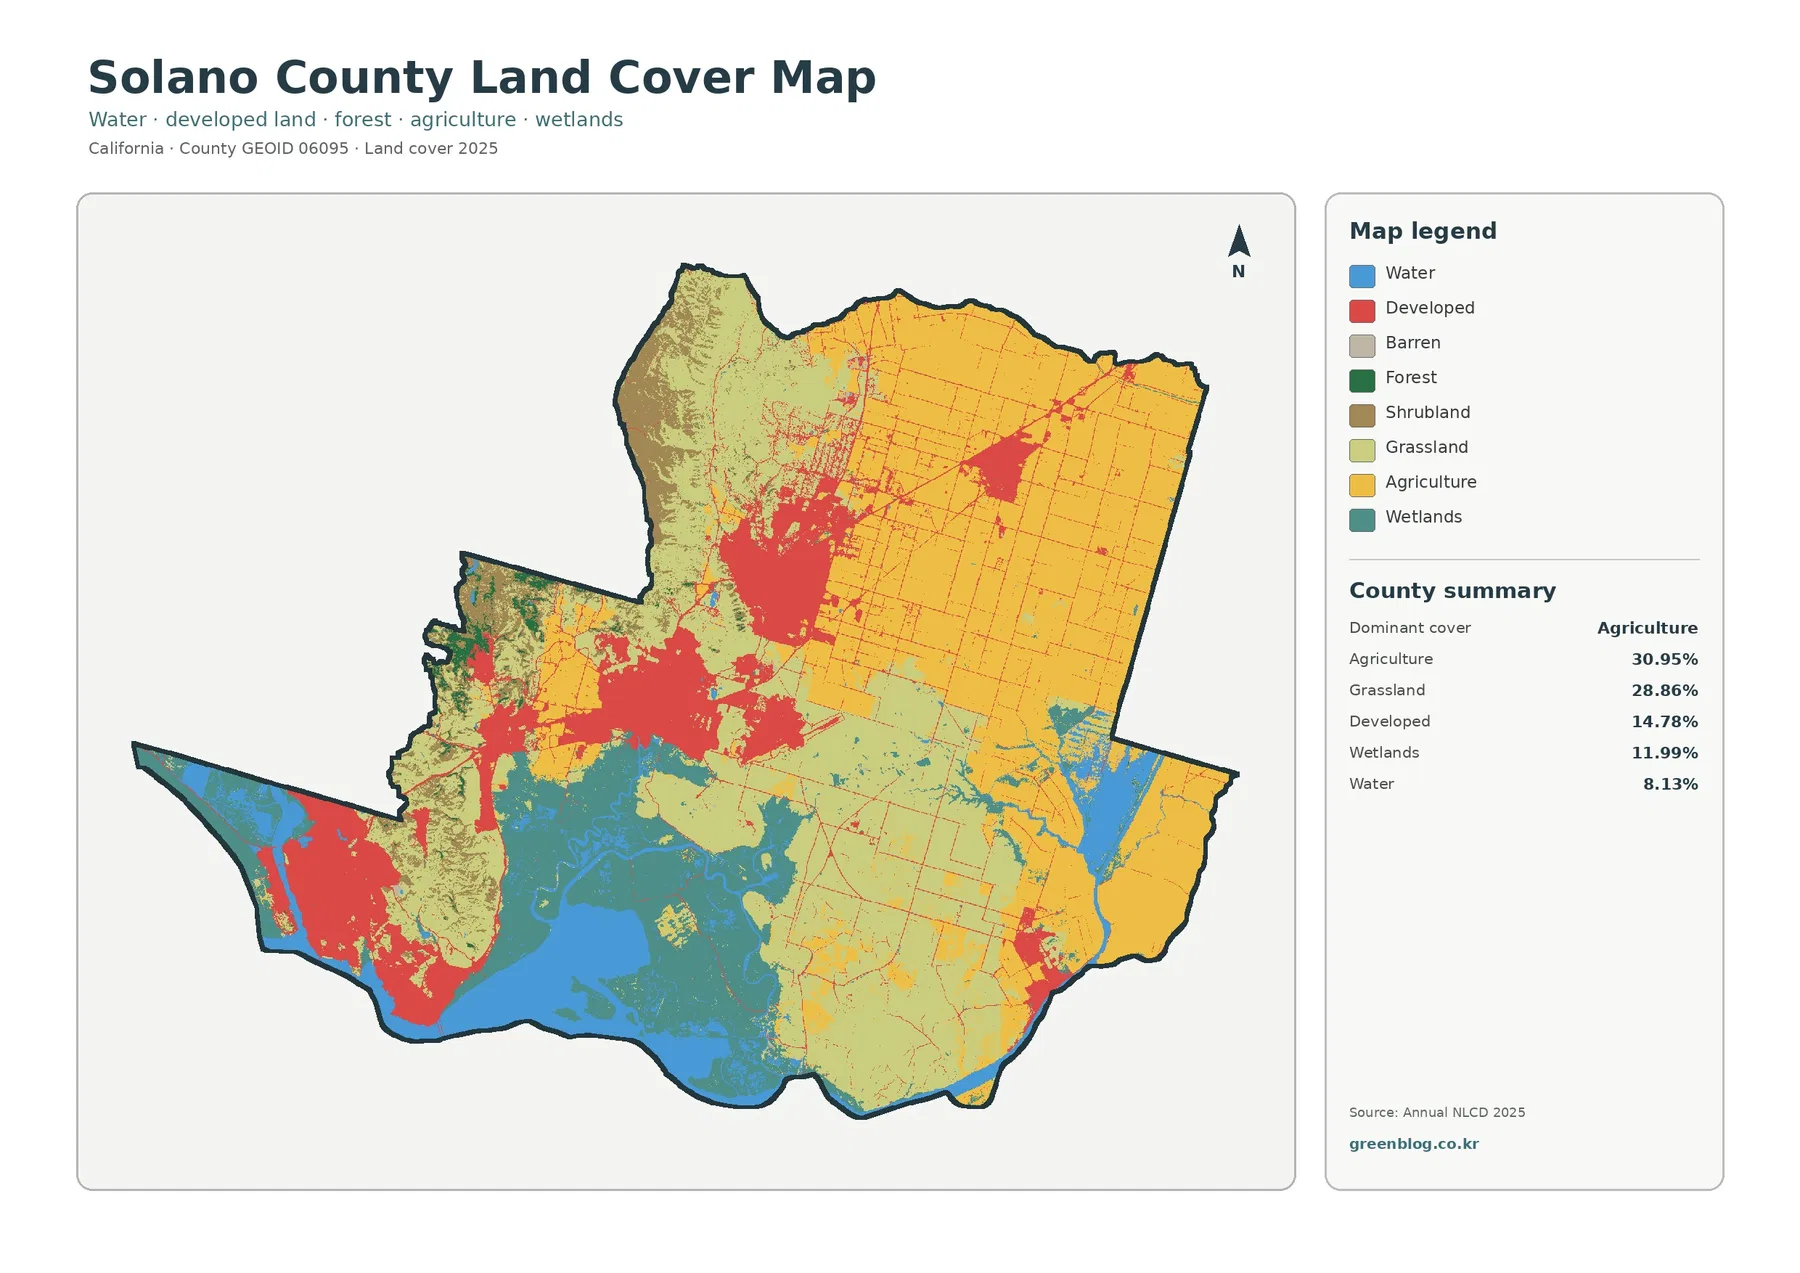
A Solano County California Land Cover Map is especially useful because the county does not have one dominant landscape from edge to edge. Broad agricultural blocks occupy much of the north and east, large grassland areas fill other rural sections, tidal wetlands and water dominate the southern marshes, and developed land forms separate urban clusters around Vallejo, Fairfield, Suisun City, Vacaville, Dixon, Benicia, and Rio Vista. The 2025 summary places agriculture first at 30.95%, followed by grassland at 28.86%, developed cover at 14.78%, wetlands at 11.99%, and water at 8.13%.
This page pairs four views of the same county: current land cover, forest and farmland, impervious surface and developed land, and mapped class differences from 1985 to 2025. The body images are WebP previews, while one download contains the four original 2480 × 1754 JPG maps. They are county-scale reference graphics rather than zoning, parcel, ownership, flood-hazard, or survey maps, so the sections below focus on what the classification actually shows and where it is most useful.
Table of Contents
Farmland, Bay Cities, and Tidal Marsh Share the Same County
Solano County sits at a geographic meeting point where the Sacramento Valley, the Bay-Delta system, and developed Bay Area communities come close together. That setting is visible without needing a road map. Agricultural cover forms large, regular blocks in the northeast and east. Developed land is concentrated in several distinct patches rather than spread evenly across the county. Wetlands and water expand across the southern interior and along the county’s bay and Delta edges. Grassland occupies much of the open ground between these stronger concentrations.
Agriculture Is Broadest in the North and East
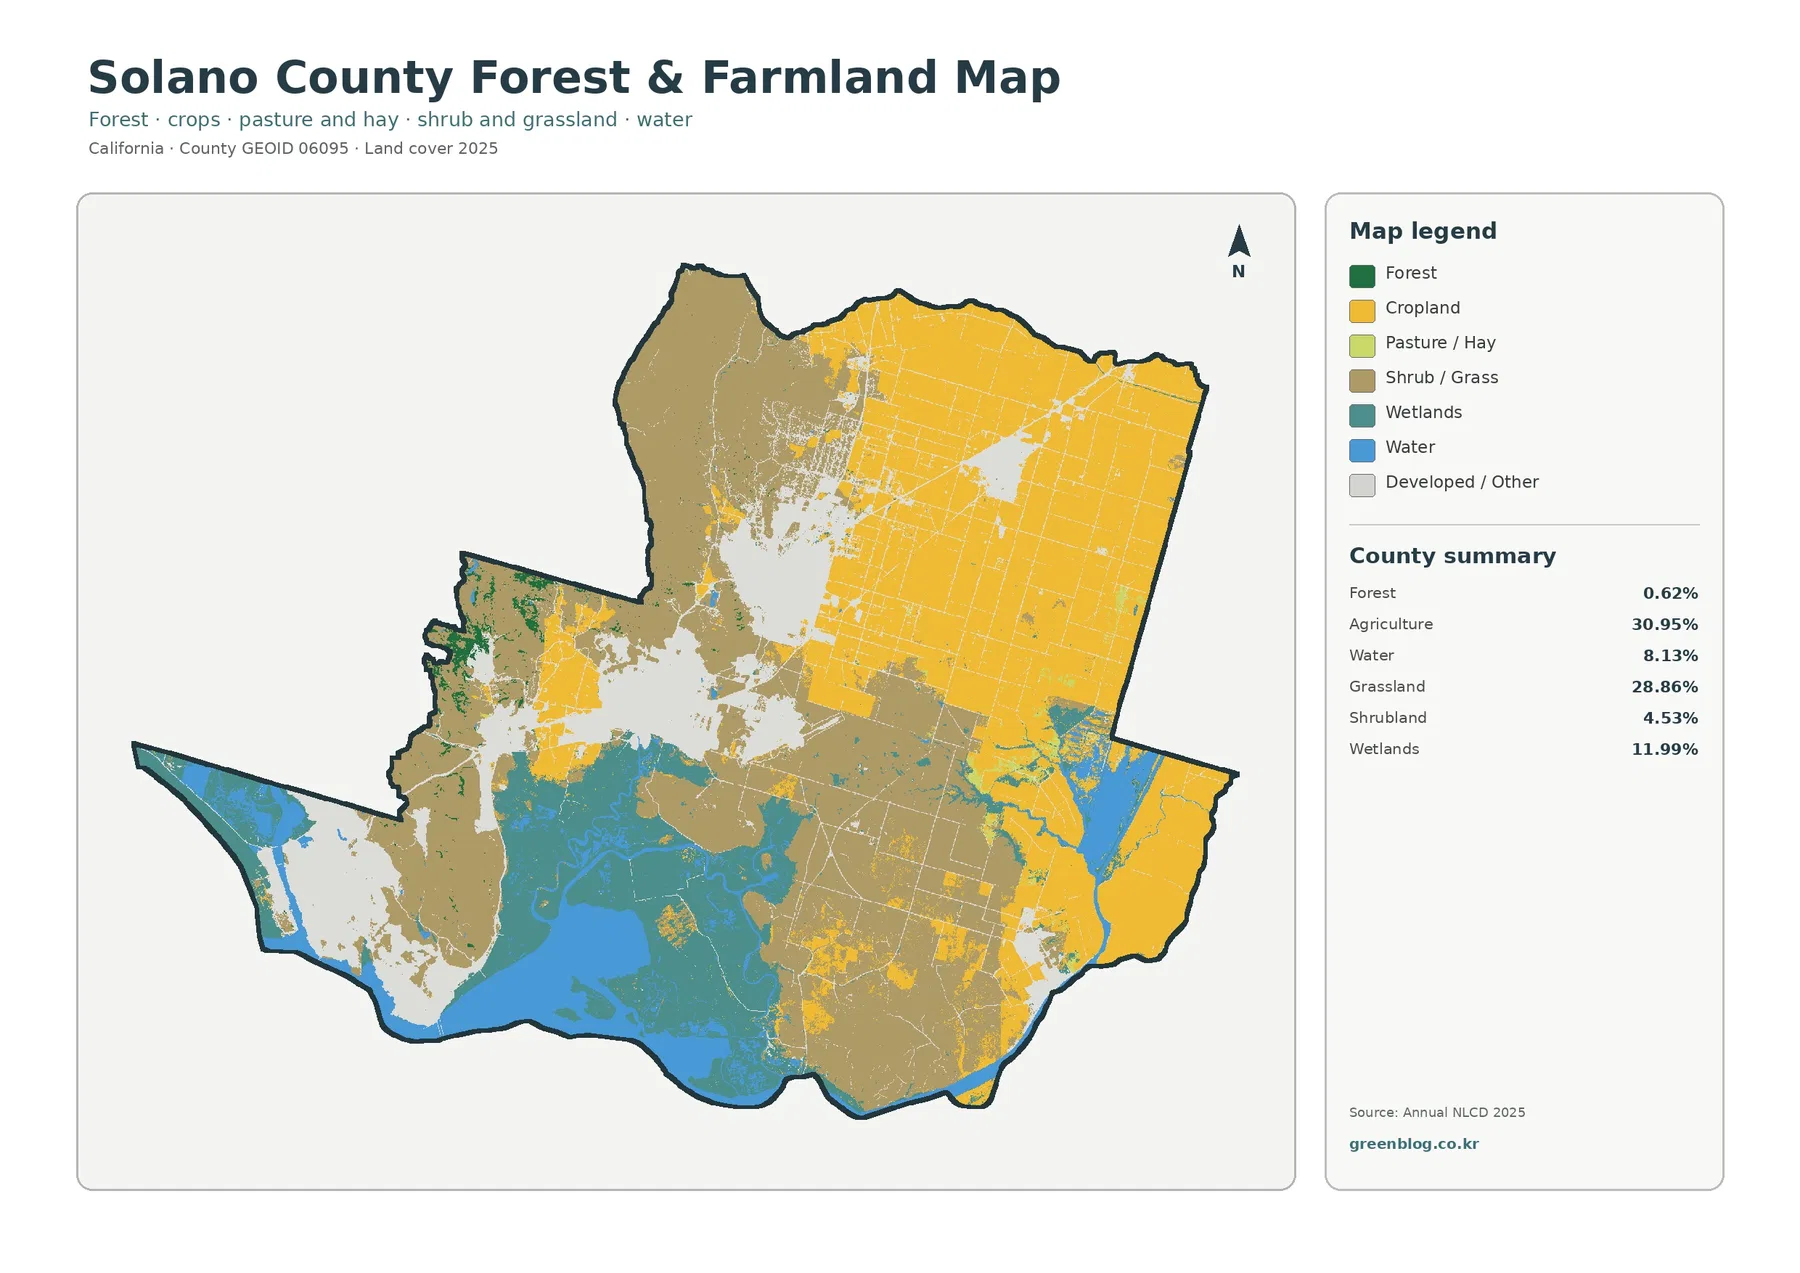
The forest-and-farmland view strips away some of the general legend detail and makes Solano County’s agricultural geography easier to follow. Cropland is particularly extensive toward Dixon and across the northeastern and eastern portions of the county. Large rectangular and linear patterns stand out because farm fields and drainage networks create a different texture from the irregular grasslands and marshes farther south. The map therefore shows not only that agriculture accounts for 30.95% of the county, but also that it is spatially concentrated.
Grassland, at 28.86%, is nearly as important numerically but looks different on the map. Open grass cover appears in broad rural areas west of the main northeastern farm blocks and through parts of the southeast. Shrubland adds 4.53% and is more noticeable in rougher western terrain. These classes matter because a rural-looking place is not automatically farmland. Satellite classification separates cultivated land, pasture-like or grassy surfaces, shrub cover, wetlands, water, and other surfaces according to what is visible on the ground.
Forest is a minor component here, only 0.62% in the 2025 summary. Small green pockets occur mainly in the western hills and a few scattered locations, but forest does not form the large continuous cover seen in California’s mountain counties. That makes Solano County a useful contrast case: the open landscape is primarily agricultural and grassy rather than heavily wooded. Trees in city parks, riparian strips, and mixed rural cells are not necessarily classified as forest if another surface dominates the raster cell.
Suisun Marsh Changes the Southern Half of the Map
The most distinctive natural pattern is the large wetland complex across the southern middle of the county. Suisun Marsh appears as a broad teal area threaded and bordered by blue water. The wetland class reaches 11.99% countywide, while water is 8.13%. Those values are substantial enough that the marsh is not a small decorative feature on the edge of an otherwise dry county; it is one of the major land-cover components that shapes the southern map.
Solano County’s official General Plan reflects the importance of this setting. Its chapter list includes separate sections for agriculture, resources, and Suisun Marsh Local Protection Program policies. A land-cover map is not the same as that planning document and does not draw regulatory marsh boundaries. What it does provide is a clear visual explanation of why land and water management questions differ so much between the county’s farmed northeast, its urban centers, and the tidal wetland landscape to the south.
Hard Surface Appears as Separate Urban Clusters, Not One Continuous Belt
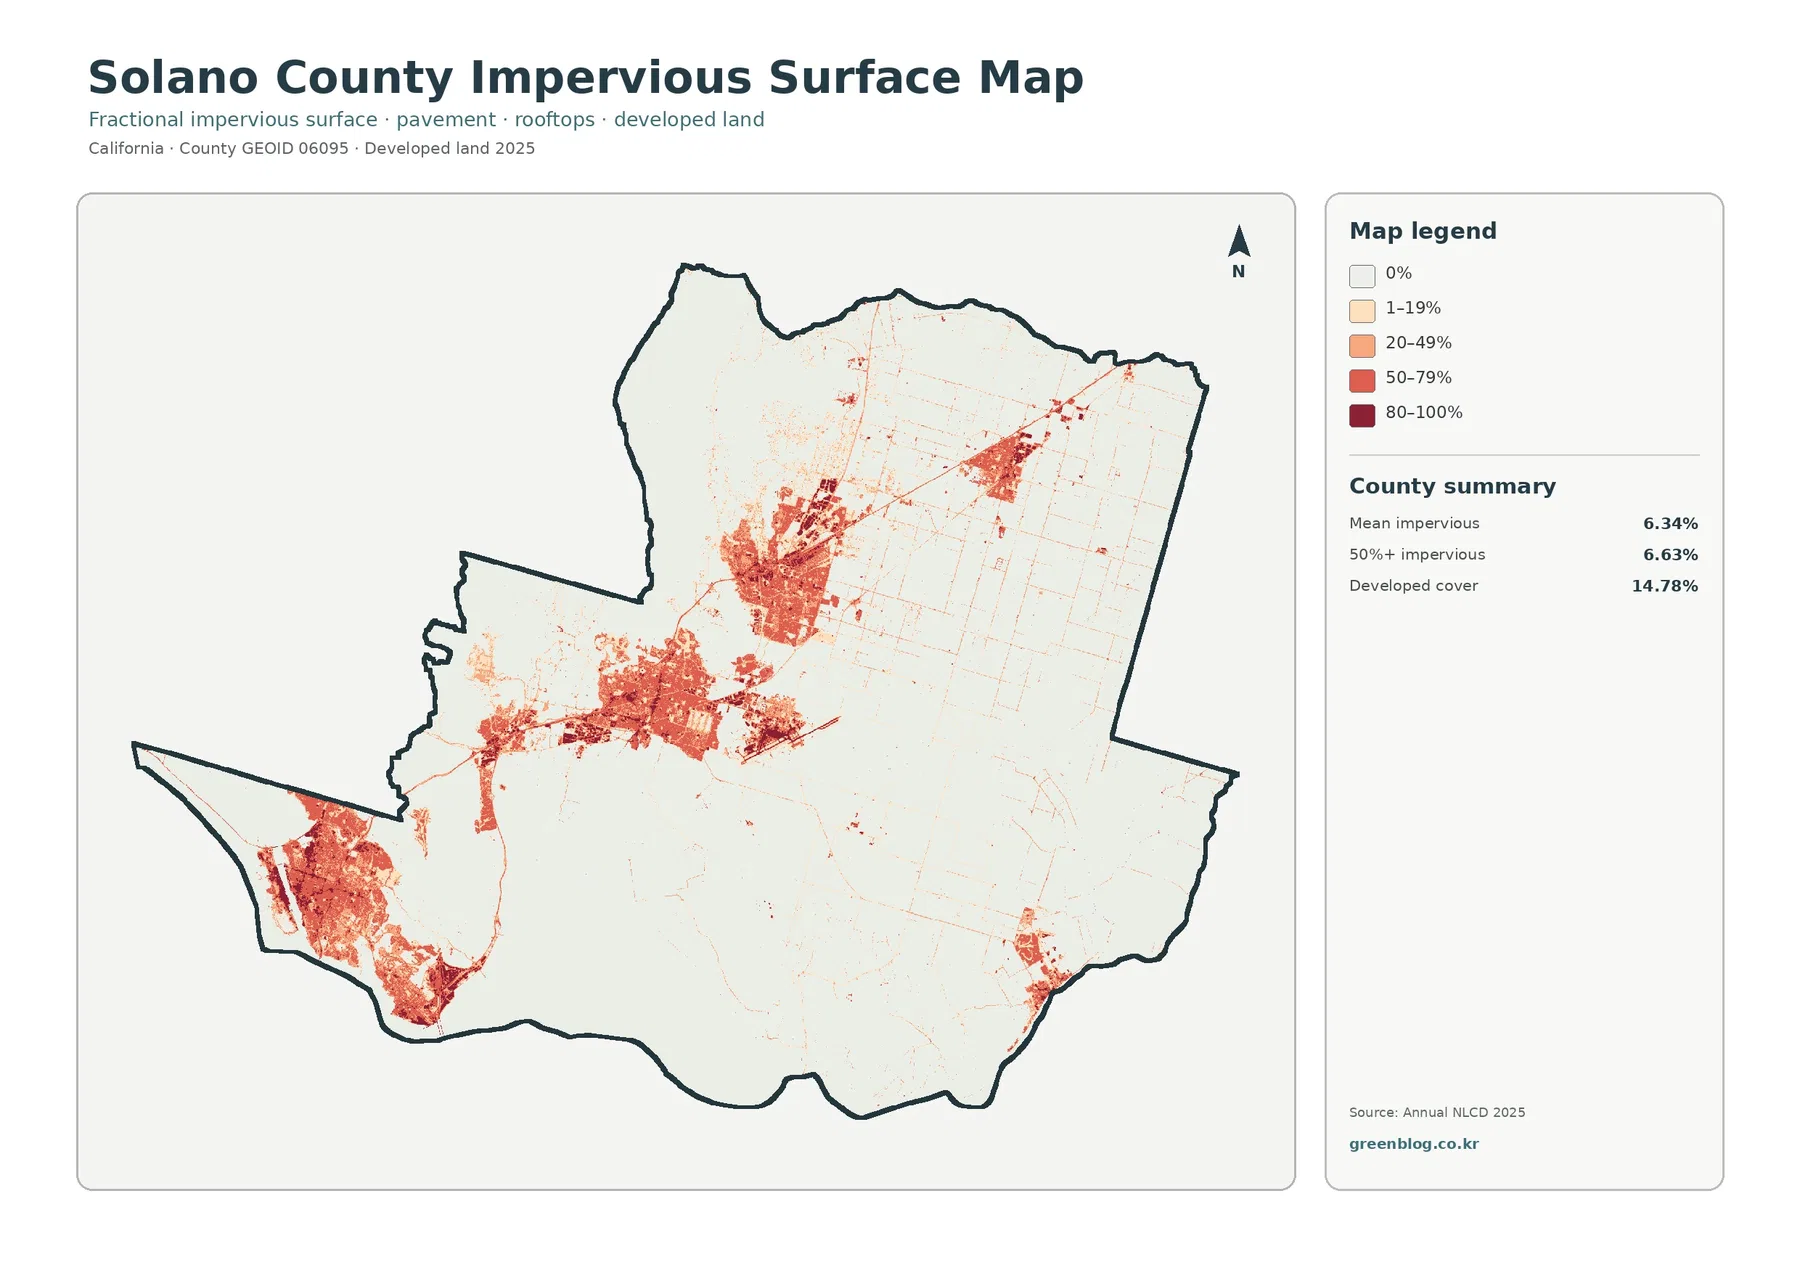
Impervious surface means pavement, rooftops, parking lots, and other surfaces that allow little direct infiltration. Solano County’s mean impervious value is 6.34%, and 6.63% of the mapped area reaches at least 50% imperviousness. Developed land covers 14.78%, so the two statistics should not be treated as interchangeable. A developed raster cell can still contain lawns, trees, bare ground, or other permeable material, while the impervious layer estimates how much of that cell is actually hard surface.
The pattern is strongly clustered. Vallejo and Benicia form prominent southwestern concentrations near the water. Fairfield and Suisun City create a broad central cluster, and Vacaville forms another major developed area to the north. Dixon stands out farther northeast, while Rio Vista appears as a smaller southeastern concentration. Roads connect these places with thin lines of higher imperviousness, but the agricultural and marsh landscapes between them remain much lighter.
The 1985–2025 Map Locates Differences but Does Not Explain Their Cause
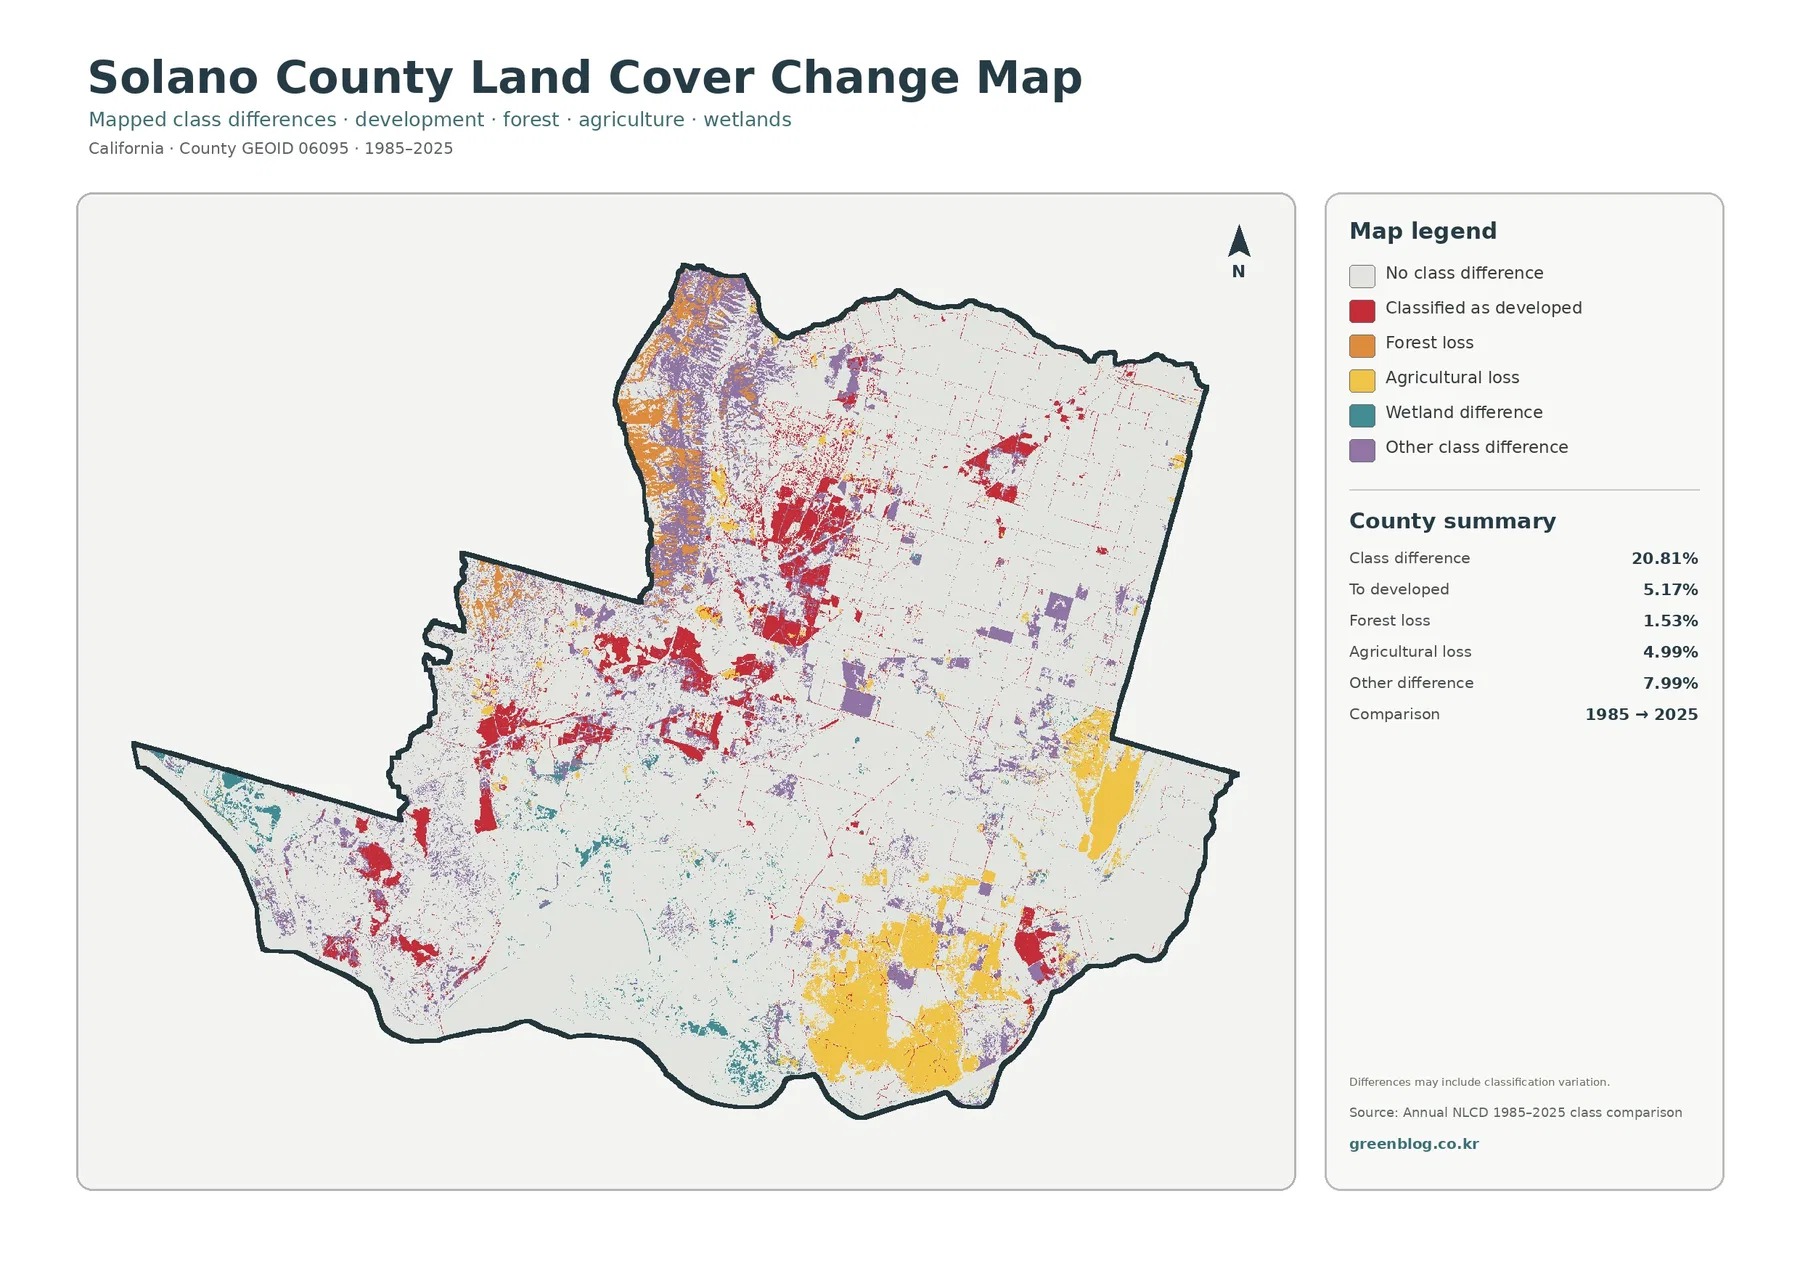
The long-term comparison marks 20.81% of the county as having a different mapped class between 1985 and 2025. The summary identifies 5.17% as differences classified to developed land, 4.99% as agricultural loss, 1.53% as forest loss, and 7.99% as other class differences. Those numbers are useful for locating areas worth examining, but they should not be read as a complete land-use accounting system.
That warning matters. A changed pixel can represent a real conversion, but it can also reflect differences in imagery, vegetation condition, water level, class rules, or mixed pixels. A red patch should not automatically be described as a particular subdivision project, and a yellow patch should not automatically be called permanent farmland conversion. To establish cause, compare the highlighted location with historical imagery, local planning records, agricultural data, or other dated evidence.
A Practical Way to Compare the Four Solano County Views
The northeastern farm blocks provide a clear example. They dominate the agriculture view but are mostly pale on the impervious map. Fairfield and Vacaville show the opposite relationship: developed cover is prominent and impervious values rise within the urban clusters. Suisun Marsh is strong on the wetland and water layers but mostly low in imperviousness. These cross-map checks help prevent a common mistake—assuming that one color on one map describes every aspect of the landscape.
Land Cover Is Not Zoning, Ownership, or a Development Permission Map
Land cover describes what the surface was classified as in the source imagery. Agriculture means the surface met an agricultural cover class; it does not prove that the parcel is legally zoned for agriculture. Developed cover identifies a built or developed surface class; it does not establish what new construction is allowed there. Wetland cover is a mapped environmental class, not a substitute for a jurisdictional wetland determination. Those distinctions are especially important in Solano County because agricultural land, cities, marsh, and open-space landscapes sit close together.
Why a 30-Meter Classification Should Be Read at County Scale
Annual NLCD products are raster data, meaning the map is built from grid cells rather than parcel polygons. At roughly 30-meter resolution, one cell can contain more than one surface type. A small road may share a cell with grass, a narrow creek may share a cell with cropland, and a neighborhood cell may combine rooftops, pavement, trees, and lawns. The classification generalizes that mixture, which is appropriate for regional comparison but not for exact site measurement.
Download the Four Original Solano County JPG Maps
The download package contains the original JPG version of each map shown on this page: land cover, forest and farmland, impervious surface and developed land, and 1985–2025 land-cover class differences. Each file measures 2480 × 1754 pixels. The source images do not meet the package’s A3 high-resolution reference, so they have not been enlarged or re-encoded and should not be described as A3 high-resolution files. For large-format printing, test the legend and small labels at the intended output size first.
Frequently Asked Questions
How can agriculture be the largest class when Suisun Marsh looks so large on the map?
Agriculture leads countywide at 30.95%, but it is concentrated mainly across the north and east. Suisun Marsh occupies a different part of the county, where wetland and water classes dominate. The map therefore has two very strong but geographically separate patterns. Percentages tell how much area belongs to a class, while the map shows where that area is located.
Why is developed cover 14.78% while mean impervious surface is only 6.34%?
Developed land can include permeable surfaces such as lawns, trees, soil, and landscaped space along with buildings and pavement. The impervious layer estimates the share of hard surface that resists direct infiltration. They describe related but different properties, so the countywide percentages are not expected to match.
Does the 4.99% agricultural-loss category prove that the same amount of farmland was permanently developed?
No. The change map reports a difference between 1985 and 2025 land-cover classes, and the map warns that classification variation can be included. Some highlighted areas may represent real conversion, while others require further checking. Historical imagery and local land-use or agricultural records are needed before assigning a cause or legal land-use change.
Map File Information
The ZIP contains the four original Solano County JPG maps used for this land-cover set, preserving their supplied 2480 × 1754 pixel dimensions.
- Printable Size: 2480 × 1754 pixels each
- File Type: Four JPG files in one ZIP archive
Related Maps
- Alameda County California Land Cover Map
- Alpine County California Land Cover Map
- Amador County California Land Cover Map
Sources and Further Reference
- MRLC Annual NLCD Data — official access point for the Annual NLCD products used for current and change mapping.
- USGS Annual NLCD Land Cover Classification — explanation of the land-cover classes and classification framework.
- U.S. Census Bureau TIGER/Line Shapefiles — official geographic boundary data, including county boundaries.
- Solano County 2008 General Plan — county planning reference covering land use, agriculture, resources, and Suisun Marsh policies.
Green Map creates custom-edited map images using open geographic data sources such as geoBoundaries, Natural Earth, OpenStreetMap, and government open data.
These maps are edited visual materials, not raw data files, and are provided for education, documents, presentations, and graphic reference.