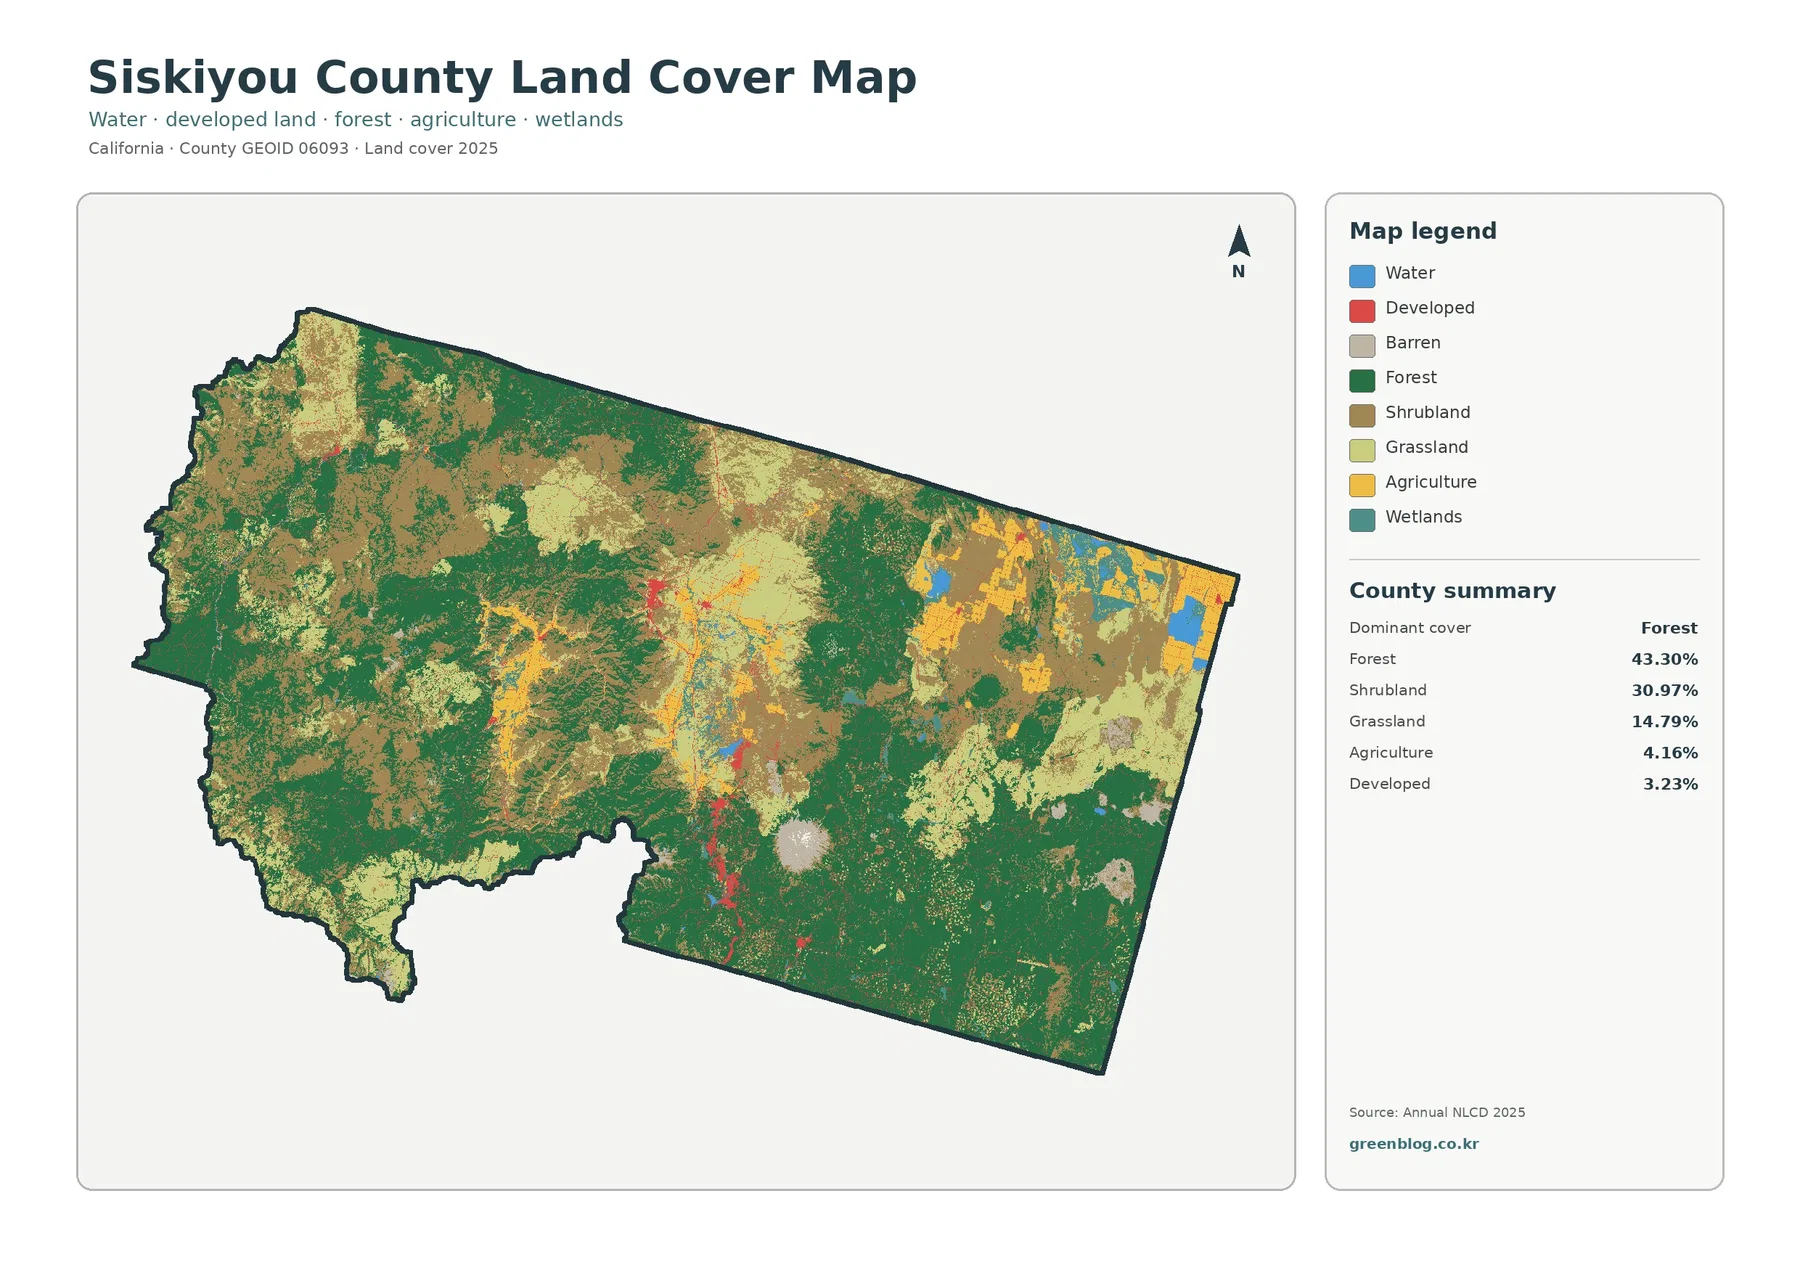
The Siskiyou County California Land Cover Map set covers a large inland county along the Oregon border where forests, shrub-covered uplands, grasslands, farmed valleys, wetlands, water, and small developed areas share the same county outline. In the 2025 summary, forest is the largest class at 43.30 percent, followed by shrubland at 30.97 percent and grassland at 14.79 percent. The contrast is visible immediately: broad forested country dominates much of the west and south, while more open classes and several agricultural blocks become prominent toward the interior and northeast.
Four map views are provided on this page: current land cover, forest and farmland, impervious surface and developed land, and mapped class differences from 1985 to 2025. The four original JPG files are available in one download near the end of the article. Each source JPG is 2480 × 1754 pixels, so the package keeps that verified original size rather than describing it as an A3 high-resolution file. These maps are intended for reference and comparison; they are not parcel, zoning, ownership, engineering, or navigation maps.
Table of Contents
A County of Forests, Valleys, and Open Basins
Siskiyou County’s official community page gives useful names for the different landscapes visible in the map set. It identifies Yreka as the county seat and lists Mt. Shasta, Weed, Dunsmuir, McCloud, and Tulelake among the county’s communities. It also names Butte Valley, Scott Valley, Shasta Valley, and the Klamath River Corridor as distinct parts of the county. Those references matter because the land-cover colors do not form one uniform pattern. Forest is extensive, but valleys and eastern basins contain more grass, shrub, agriculture, wetland, and water classes than a simple “forest county” label would suggest.
What the 2025 Land-Cover Summary Reveals
Agriculture accounts for 4.16 percent of the county and developed land for 3.23 percent. Water is 0.55 percent and wetlands are 1.70 percent. These smaller percentages are easy to overlook in a table, but their locations stand out on the map. Agriculture appears in concentrated patches rather than as a countywide blanket. The most conspicuous farmed area is in the northeast, where yellow and orange agricultural colors form broad blocks beside water and wetland classes. Smaller agricultural patches also appear in interior valleys. Developed land is much more fragmented, appearing as narrow corridors and compact centers surrounded by open or forested land.
Farmland Stands Out in the Northeast
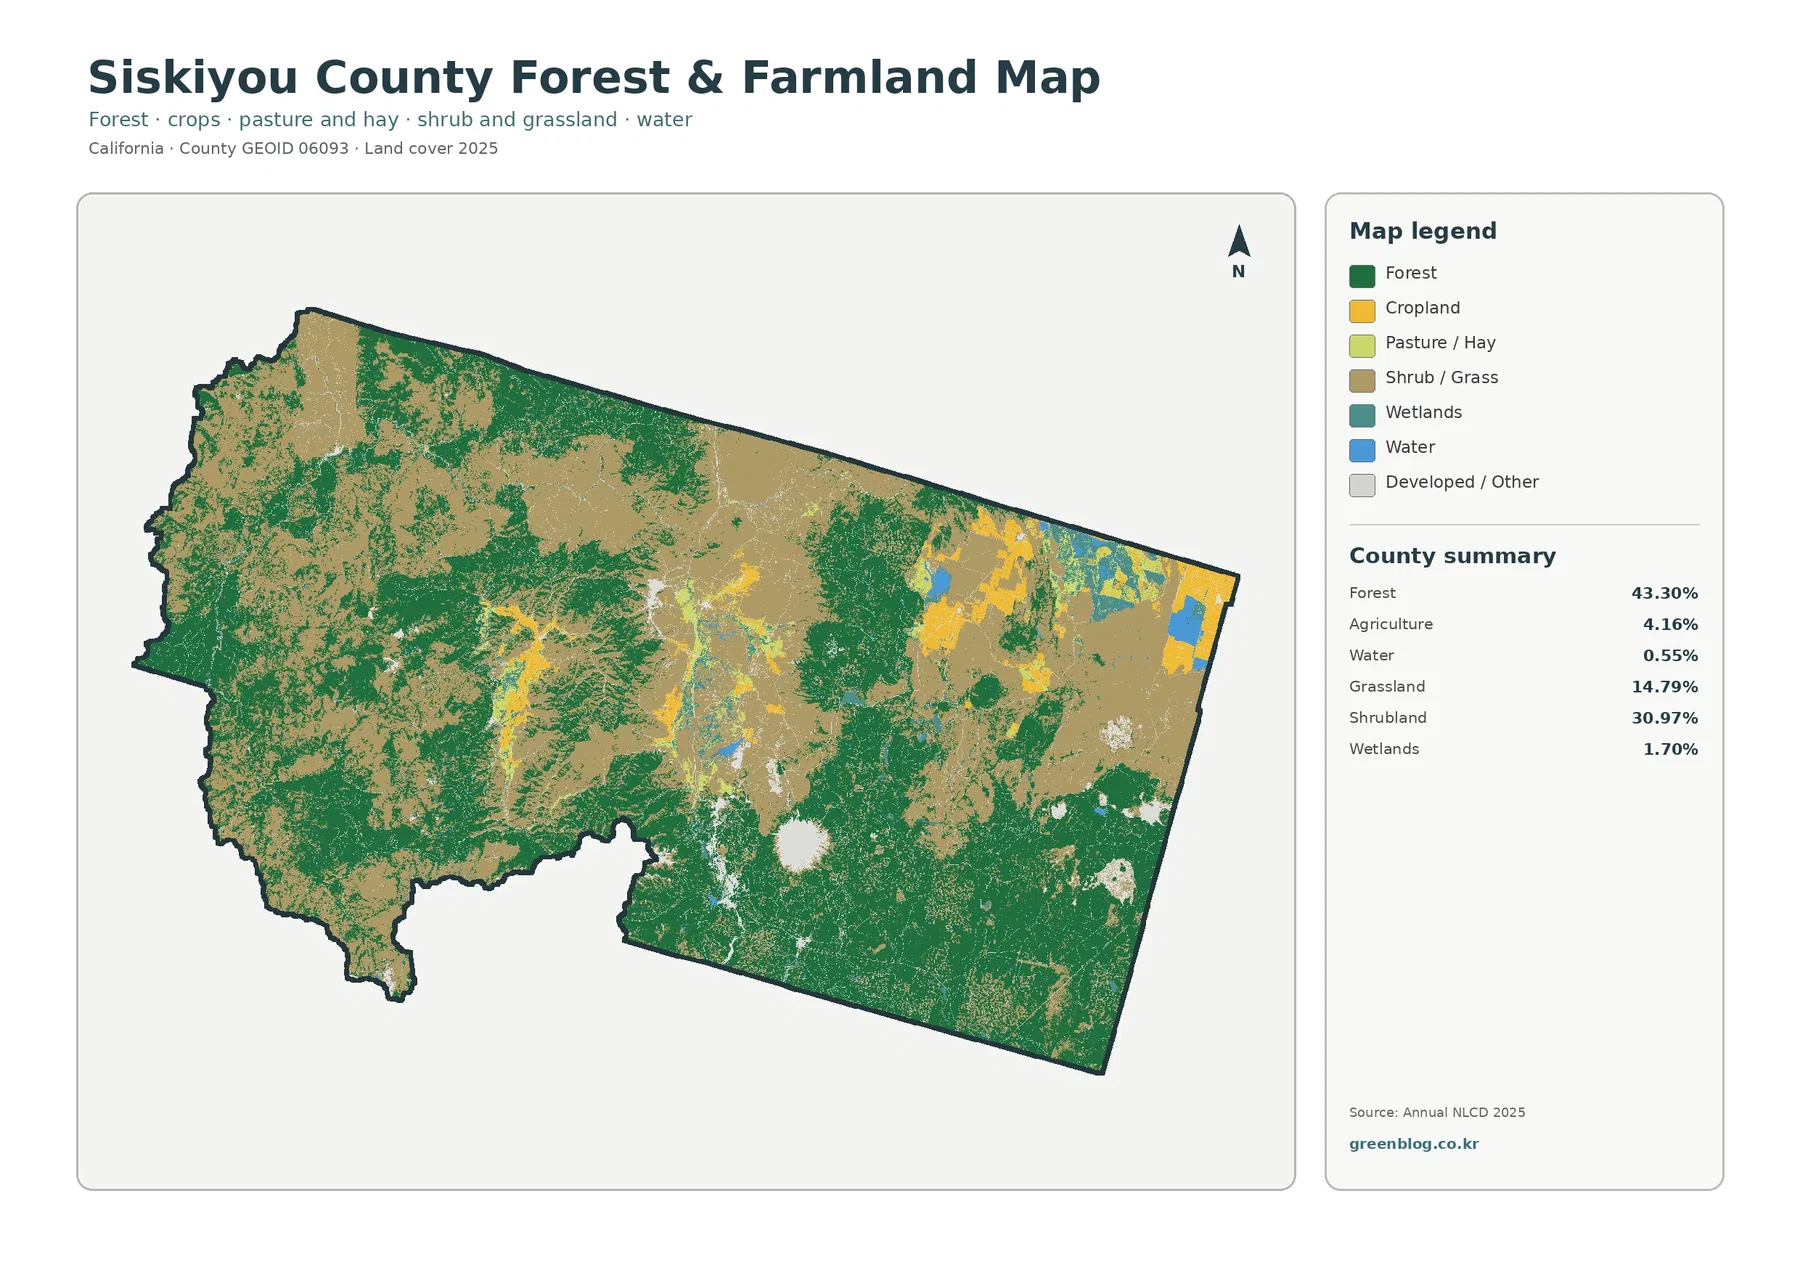
The forest-and-farmland version removes some of the general map’s visual complexity and makes the northeast especially easy to compare with the rest of the county. Cropland and pasture or hay are separated from forest and from shrub/grass cover. The large northeastern agricultural blocks sit within a landscape that also includes visible water and wetland patches. Tulelake and Butte Valley are useful geographic references for this part of the county; Siskiyou County maintains a Butte Valley groundwater program, and its community information specifically identifies Tulelake and Butte Valley among the county’s recognized places and regions.
County agricultural information adds context without changing what the map itself means. The Siskiyou County Department of Agriculture describes livestock and field crops as common forms of production and also notes the importance of strawberry nursery production. The land-cover map, however, does not identify individual crop species or ranch operations. A yellow cropland cell should be read as a broad surface classification, not as proof of a particular crop, owner, irrigation method, or legal agricultural designation. For that reason, the map works best for comparing the location and extent of farmed surfaces with surrounding forest, grass, shrub, water, and wetland cover.
Hard Surfaces Remain Highly Localized
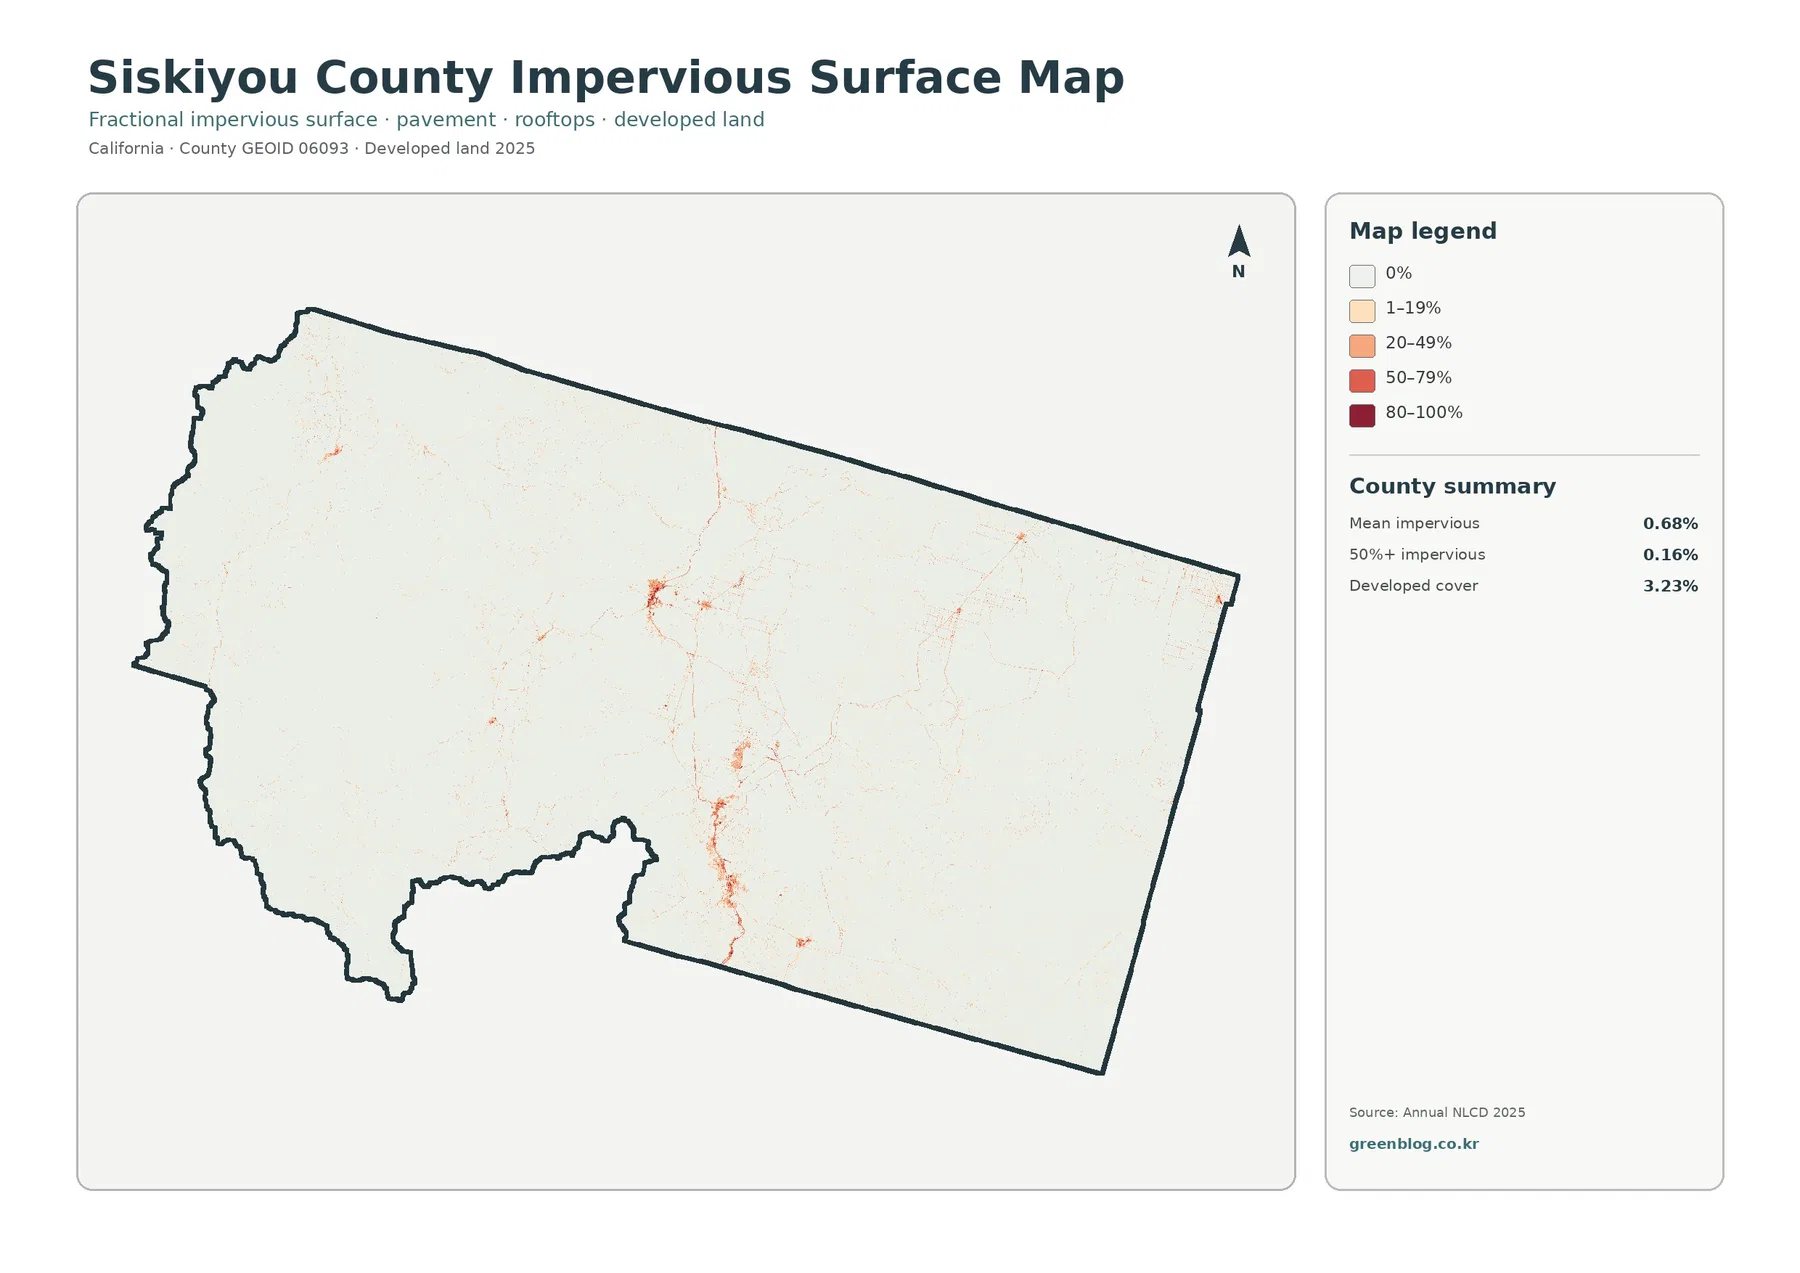
Impervious surface means pavement, rooftops, and similar surfaces that do not readily absorb water. The countywide average shown on the 2025 map is only 0.68 percent, while areas with 50 percent or more impervious cover account for 0.16 percent of the county. Developed land, by comparison, makes up 3.23 percent. Those numbers are not contradictory. A developed classification can include yards, vegetation, bare soil, and other permeable surfaces around roads and buildings, while the impervious layer measures the harder surface component within each mapped cell.
The map is almost entirely pale because heavily paved surfaces occupy a very small share of such a large county. Higher values appear as small red or orange concentrations around settlement areas and as thin lines or narrow corridors. The Yreka area is one visible concentration, and additional developed traces appear southward through the part of the county containing Weed, Mt. Shasta, and Dunsmuir. Smaller concentrations occur elsewhere, including toward the eastern and northeastern communities. Because this image does not label individual roads, it is better to describe those features as developed corridors rather than assign a road name to every line.
The 1985–2025 Change Map Needs a Careful Reading
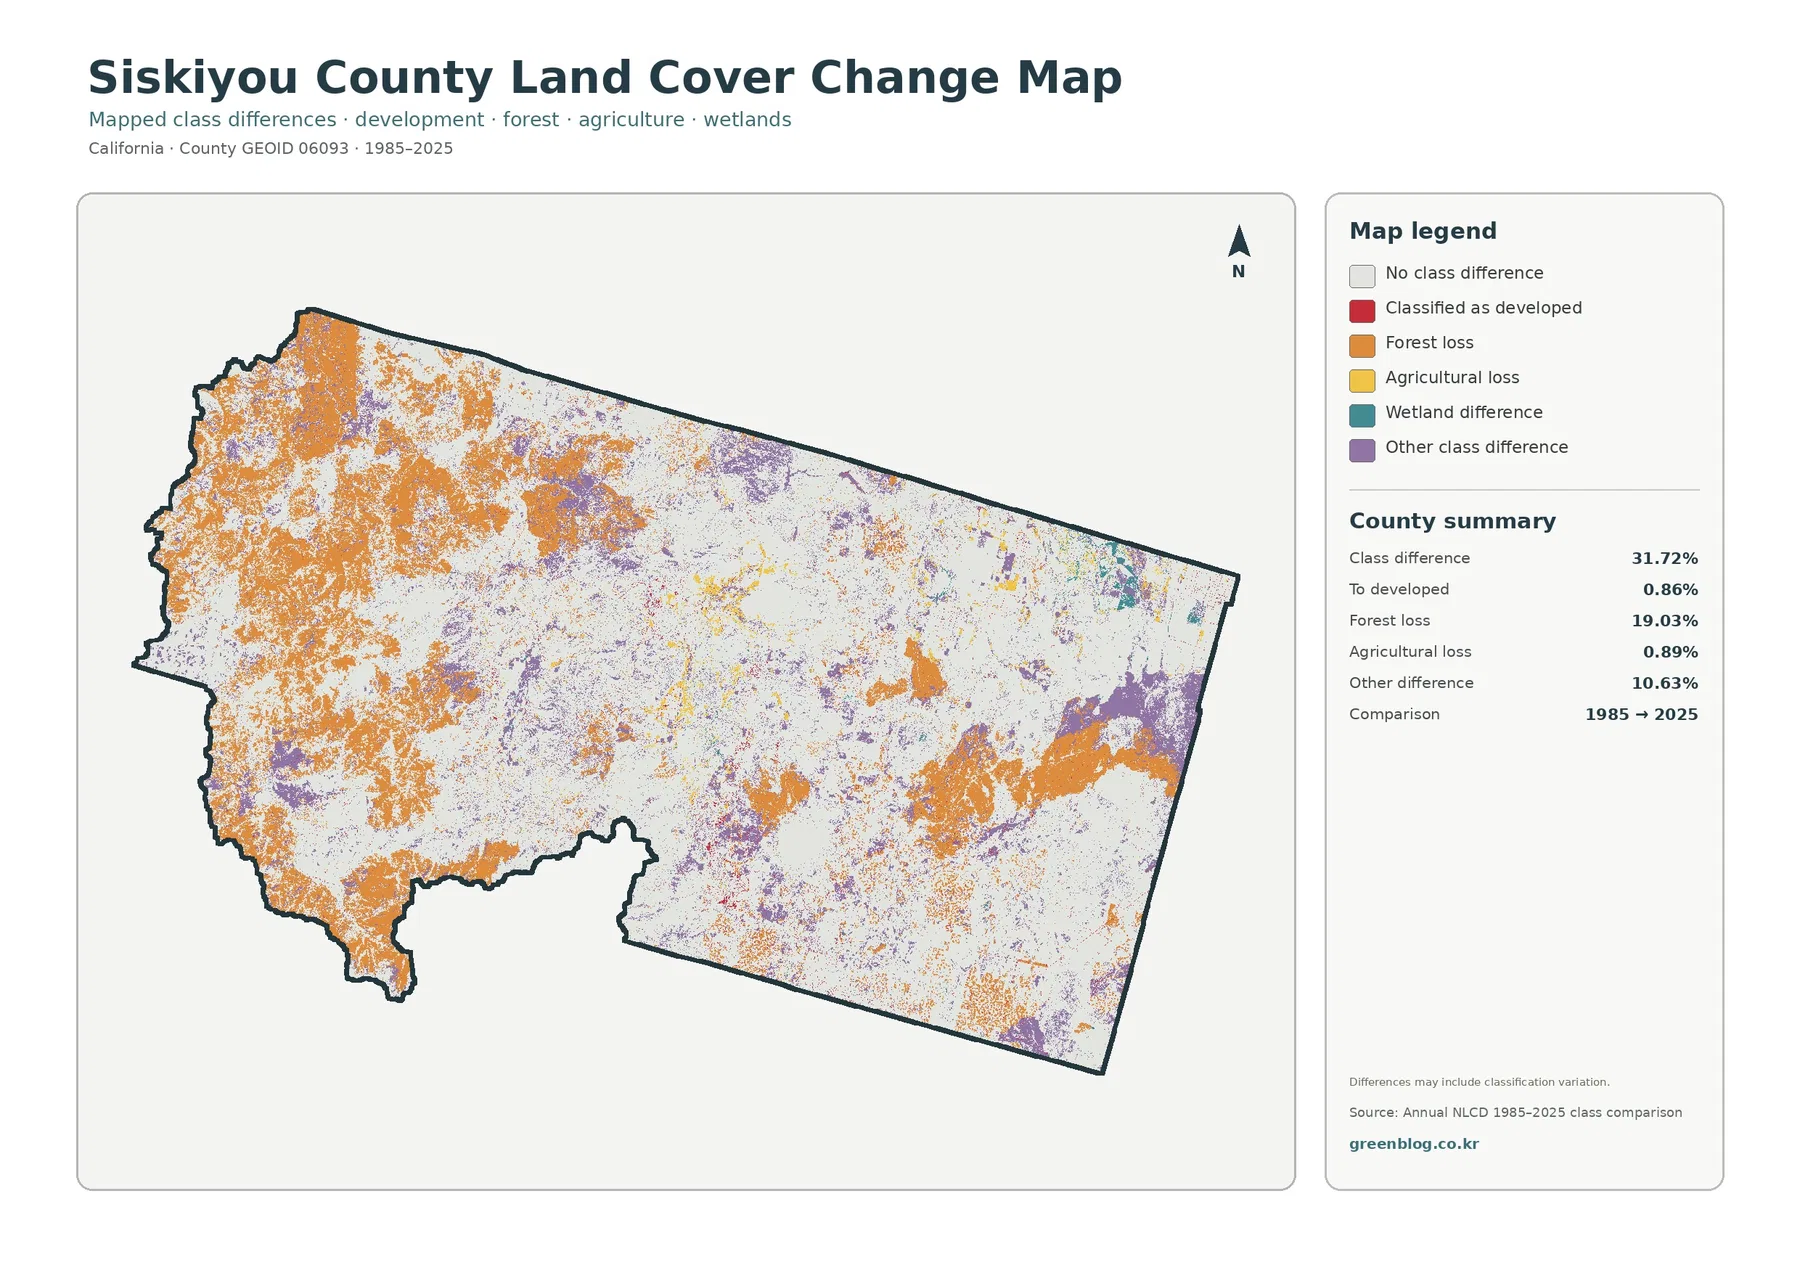
The comparison map marks places where the land-cover class in 1985 differs from the class mapped in 2025. Its county summary reports a 31.72 percent class difference. Within that total, 19.03 percent is categorized as forest loss, 0.86 percent as a change to developed land, 0.89 percent as agricultural loss, and 10.63 percent as another class difference. The orange forest-loss category is widespread in portions of the west and south, while purple “other difference” areas are conspicuous in parts of the east and interior. Smaller developed and agricultural change marks are scattered rather than dominant.
The map itself includes an important warning: differences may include classification variation. That note is essential. A cell labeled as forest loss is a cell whose class changed between the two mapped dates; the label does not, by itself, identify logging, wildfire, development, disease, restoration, or another cause. Satellite observations, class definitions, mixed pixels, and conditions at the date of observation can all affect a long-period comparison. Establishing a cause would require additional evidence such as fire-history data, forest-management records, aerial imagery, or field observations.
How the Four Maps Work Together
Download the Four Original JPG Maps
The download archive contains one JPG for each map shown on the page: general land cover, forest and farmland, impervious surface and developed land, and the 1985–2025 land-cover comparison. All four source images are 2480 × 1754 pixels. The page uses WebP previews for convenient browsing, while the ZIP keeps the original JPG dimensions supplied with the county asset set. Because the verified files do not meet the project’s A3 high-resolution reference, this page does not claim an A3 print specification.
Classification, Scale, and Land-Use Limits
Annual NLCD is raster data: the landscape is divided into grid cells and each cell receives a representative classification. At a county scale, a cell can contain more than one real-world surface. A forest edge may include a road, a developed edge may contain trees and lawns, and a farm boundary may mix vegetation with water or bare ground. These mixed pixels are one reason the maps should be used to understand broad patterns rather than to draw exact parcel boundaries. The classification is generalized even when the color edge appears sharp on the image.
Land cover also differs from legal land use. A forest class does not reveal who owns the property or what activities are allowed there. An agricultural class does not establish zoning, water rights, or a permit to farm, and a developed class does not establish that new construction is allowed. Siskiyou County’s Planning Department explains that the General Plan guides long-term development decisions while the Zoning Ordinance directly regulates land use; the two are not the same system. Parcel and development decisions therefore require the appropriate current county planning and assessor information.
Frequently Asked Questions
Is Siskiyou County mostly forest on the 2025 land-cover map?
Forest is the single largest class at 43.30 percent, but it is not a majority of the county. Shrubland accounts for 30.97 percent and grassland for 14.79 percent, so open non-forest cover is also a major part of the countywide pattern.
Why does the northeast look so different on the forest-and-farmland map?
The northeast contains some of the county’s most conspicuous mapped agricultural blocks together with water and wetland areas. Tulelake and Butte Valley provide useful geographic references for that part of Siskiyou County, while the western and southern portions of the county contain much broader forest cover.
Does the 19.03% forest-loss category prove that 19.03% of the county was cleared?
No. It is a mapped classification difference between 1985 and 2025. The comparison explicitly warns that classification variation may be included, so a specific cause such as fire, logging, or conversion cannot be assigned without additional evidence.
What is included in the map download?
The ZIP contains four 2480 × 1754 JPG files: the current land-cover map, forest-and-farmland map, impervious/developed-land map, and the 1985–2025 land-cover change map. The WebP images in the article are previews rather than extra download files.
Map File Information
The ZIP contains the four original Siskiyou County land-cover JPG maps shown on this page.
- File Type: Four JPG files in one ZIP archive
Related Maps
- Alameda County California Land Cover Map
- Alpine County California Land Cover Map
- Amador County California Land Cover Map
Sources and References
- MRLC Annual NLCD Data — source data for the land-cover and comparison layers
- USGS Annual NLCD Land Cover Classification — classification definitions and interpretation
- U.S. Census Bureau TIGER/Line Shapefiles — county boundary reference
- Siskiyou County Communities — official references for Yreka, Mt. Shasta, Tulelake, the valleys, and the Klamath River Corridor
- Siskiyou County Department of Agriculture — county agricultural context
- Siskiyou County General Plan — distinction between long-term planning policy and zoning regulation
Green Map creates custom-edited map images using open geographic data sources such as geoBoundaries, Natural Earth, OpenStreetMap, and government open data.
These maps are edited visual materials, not raw data files, and are provided for education, documents, presentations, and graphic reference.