San Bernardino County looks urban at its southwest corner, but the 2025 land-cover map is overwhelmingly a desert map. Shrubland accounts for 82.09% of the county and barren cover adds 11.35%, while developed land occupies 3.63%. The broad tan interior, the compact red southwest, and the green mountain belt create three very different visual zones inside the same county boundary.
This page compares general land cover, forest and farmland, impervious surface and developed land, and mapped class differences from 1985 to 2025. The WebP images are designed for quick viewing, and the four original JPG maps are available together in one ZIP farther down the page. These maps describe surface cover, not zoning, ownership, parcel boundaries, or legal development rights.
Table of Contents
Why 82.09% shrubland makes the county’s desert geography impossible to miss
The county summary is unusually concentrated in two dry-land classes. Shrubland is 82.09% and barren land is 11.35%. Developed cover follows at 3.63%, then forest at 1.32% and grassland at 1.18%. Water is 0.14%, agriculture 0.13%, and wetlands 0.15%. Those small categories still matter locally, but they do not change the countywide picture: most of San Bernardino County is mapped as open desert vegetation or sparsely vegetated ground.
Official county geography helps explain that pattern without confusing geography with land-cover classes. San Bernardino County’s Community Indicators profile divides the county into a 2% Valley Region, a 4% Mountain Region, a 17% East Desert Region, and a 77% North Desert Region. The desert regions therefore occupy most of the county’s enormous footprint. That does not mean every desert acre must be shrubland, but it gives useful context for the 82.09% shrubland share in the 2025 classification.
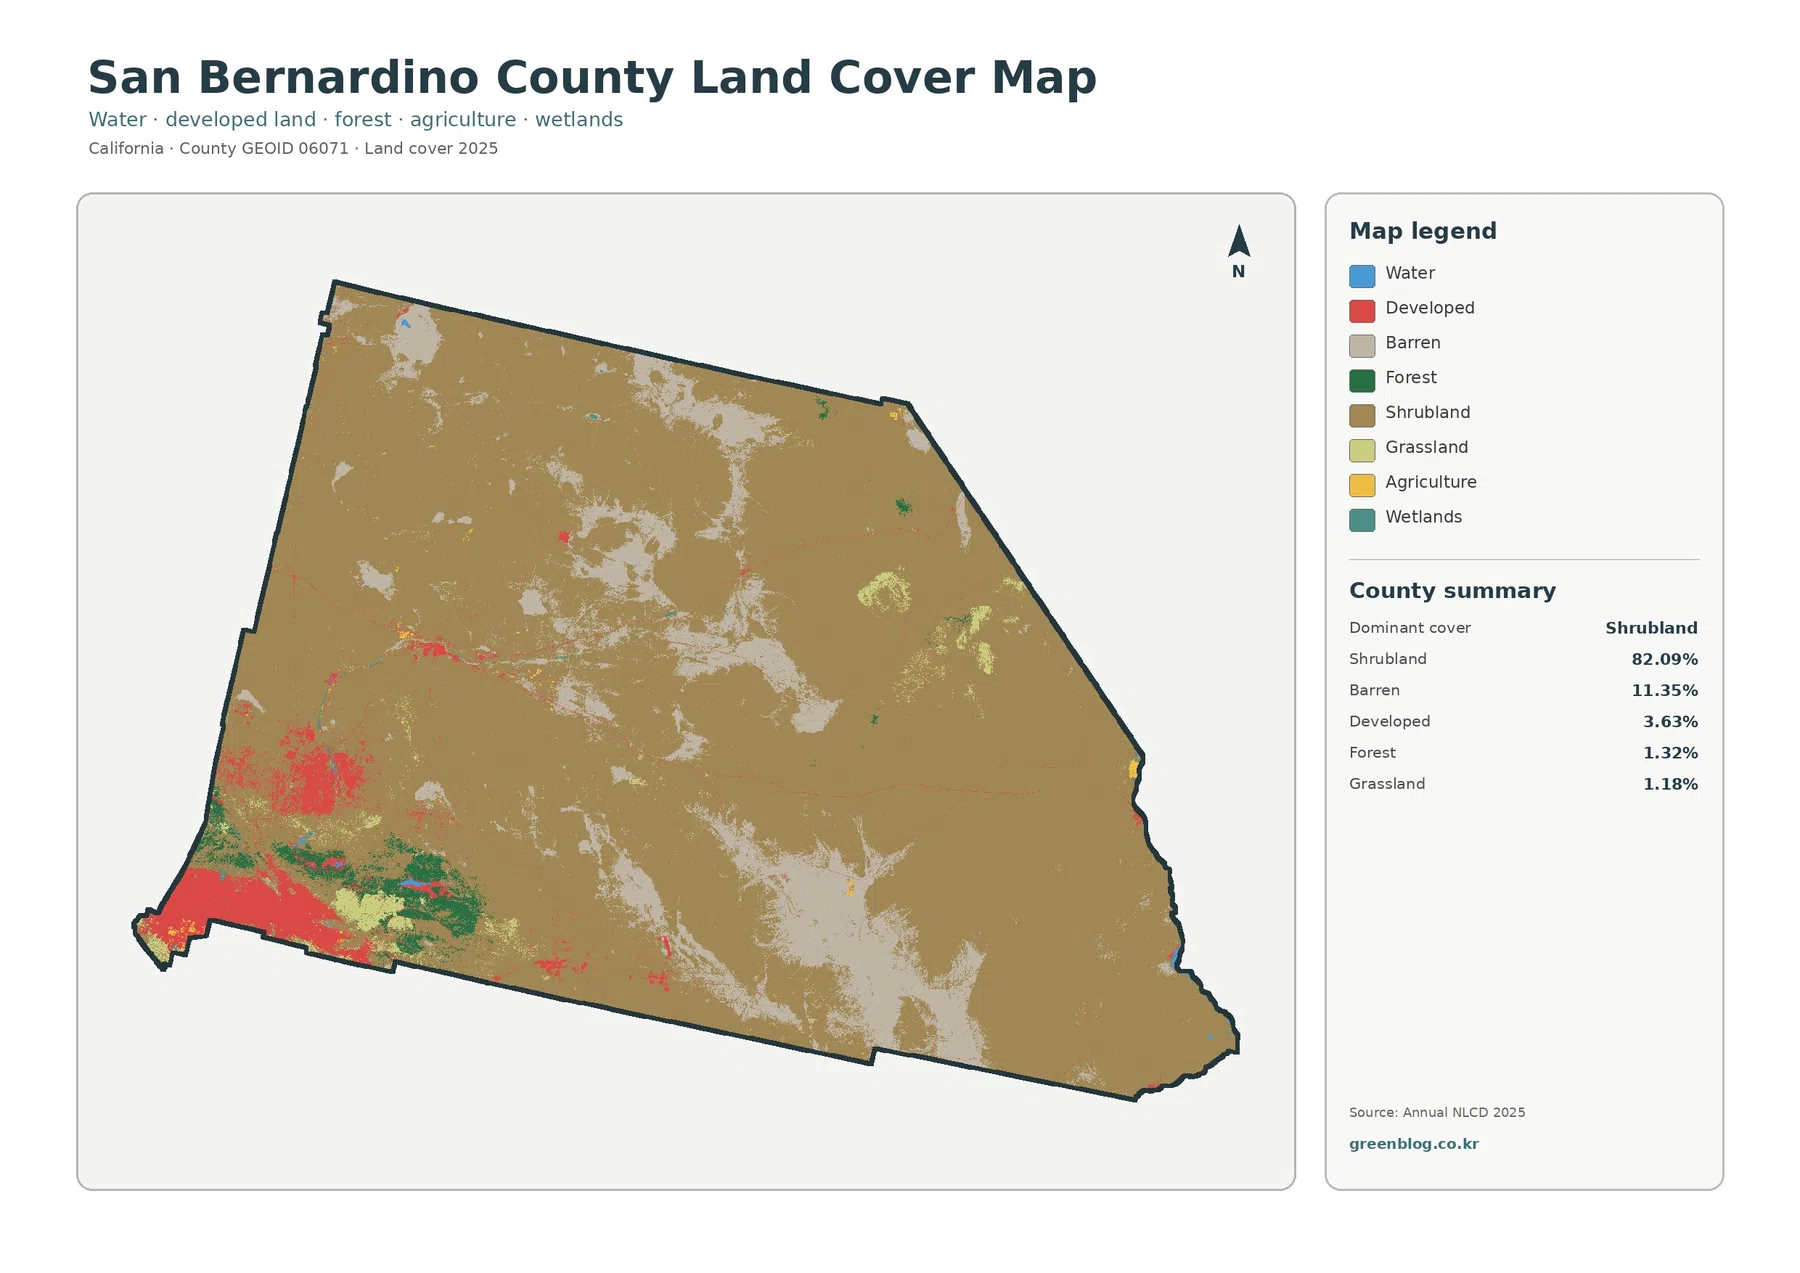
The general map is easiest to read by following the contrast between the tan shrubland field and the pale barren patches. Barren areas occur as broad and scattered pieces inside the desert rather than as one continuous block. Red developed cover is concentrated at the southwest edge and appears again in smaller separated groups farther inland. Green forest is also highly localized, forming a mountain-area cluster rather than spreading evenly across the county.
That concentration matters when comparing San Bernardino with smaller California counties. A category can look visually prominent in one corner yet remain a small countywide percentage because the total county area is so large. The county profile lists 20,105 square miles, making San Bernardino the largest county in the contiguous United States. A reader should therefore avoid judging importance from percentage alone; location and concentration are just as important here.
A 3.63% developed share contains both the southwest metropolis and separate High Desert cities
The largest developed block sits in the southwest, where the county’s Valley Region contains San Bernardino, Fontana, Ontario, Rancho Cucamonga, Redlands, Rialto, and other cities. On the land-cover image, the red area forms a broad continuous zone against the county edge. It stands out sharply because most of the surrounding county is shrubland, barren land, or mountain vegetation rather than similarly dense development.
Development also appears in the High Desert, but the pattern is different. Victorville, Hesperia, Apple Valley, and Barstow are listed by the county within desert-region communities, and their developed cover appears as separate inland concentrations instead of one huge continuous urban surface. Thin developed traces and isolated patches elsewhere reflect how settlements and transportation corridors are scattered across a county that extends all the way to the Colorado River.
This is why the 3.63% developed-cover statistic needs a map beside it. The number is small compared with 82.09% shrubland, yet people living in the southwest can be surrounded by developed cover for many miles. A countywide percentage averages the Valley, mountains, High Desert, and remote eastern desert together. It does not describe the local intensity around any one city.
Hard surface is only 1.47% on average, but it is concentrated where development is densest
Impervious surface measures the share of ground covered by roofs, pavement, parking lots, and other hard surfaces that do not readily absorb water. San Bernardino County’s mean impervious surface is 1.47%, and 1.37% of the county has imperviousness of 50% or more. Both values are lower than the 3.63% developed-cover share because a developed land-cover class can still contain yards, trees, soil, landscaping, and other permeable surfaces.
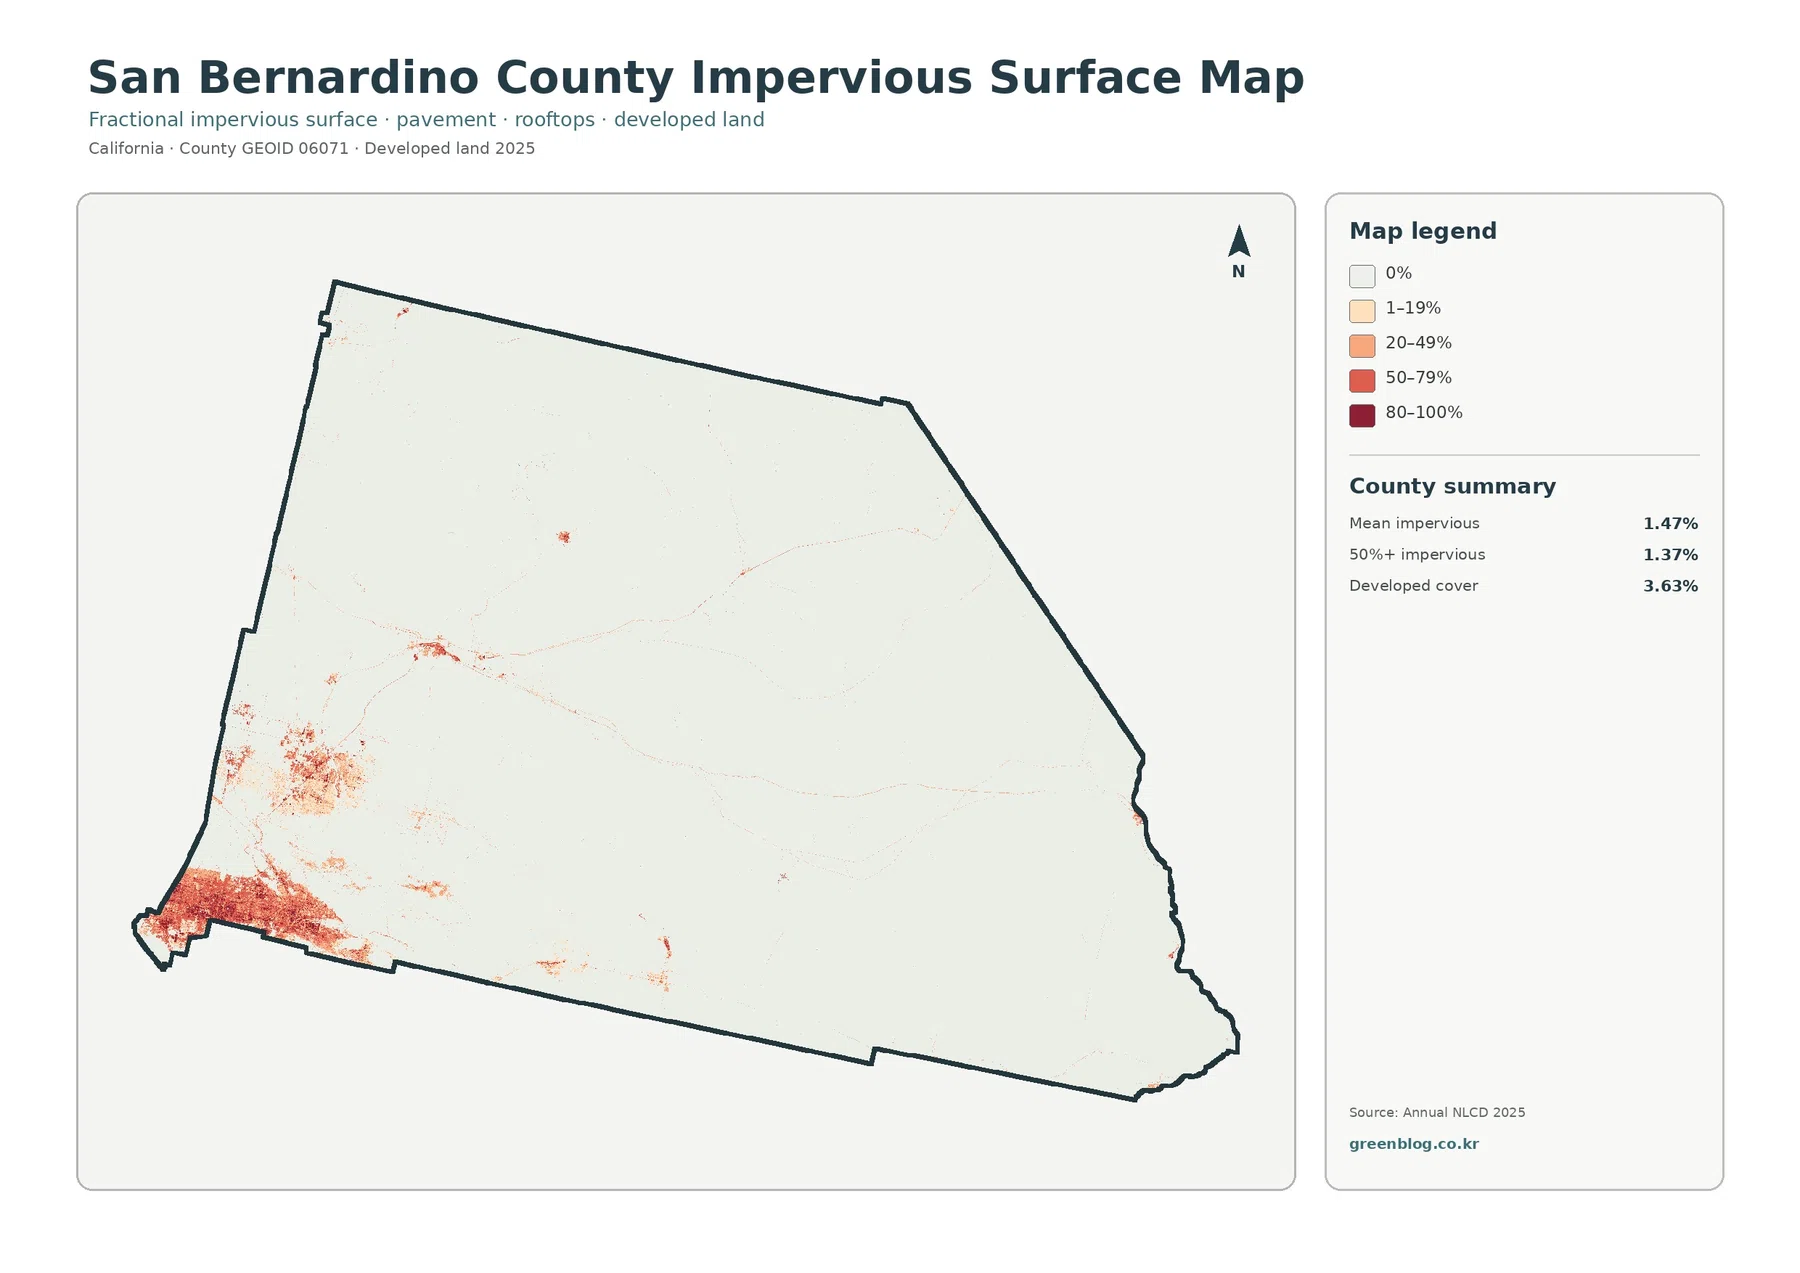
The impervious map makes the southwest concentration even more obvious than the general land-cover map. Darker classes form a large patch along the southwestern edge, while most of the county remains close to the 0% or low-percentage classes. Inland urban clusters appear as smaller islands of orange and red, separated by broad pale areas. The result is a much clearer picture of where hard surfaces are concentrated inside the much larger developed class.
The map should not be read as a flood-risk map. High imperviousness can be relevant to runoff, but actual flood risk depends on rainfall, topography, channels, drainage infrastructure, soils, and local flood-control systems. San Bernardino County Public Works divides flood-control responsibilities among zones that include the Valley, Mojave River Valley, mountain watersheds, and the much larger desert region. Imperviousness is one piece of that context, not a substitute for hazard information.
The 1.32% forest share marks a narrow mountain transition between valley and desert
Forest occupies only 1.32% of the county, yet its location is one of the most useful features on the specialized forest-and-farmland map. The strongest green area lies near the southwestern mountain belt, between the dense Valley development and the open desert to the north and east. County sources describe the Mountain Region as a distinct geographic area containing communities such as Big Bear Lake, Lake Arrowhead, and Wrightwood.
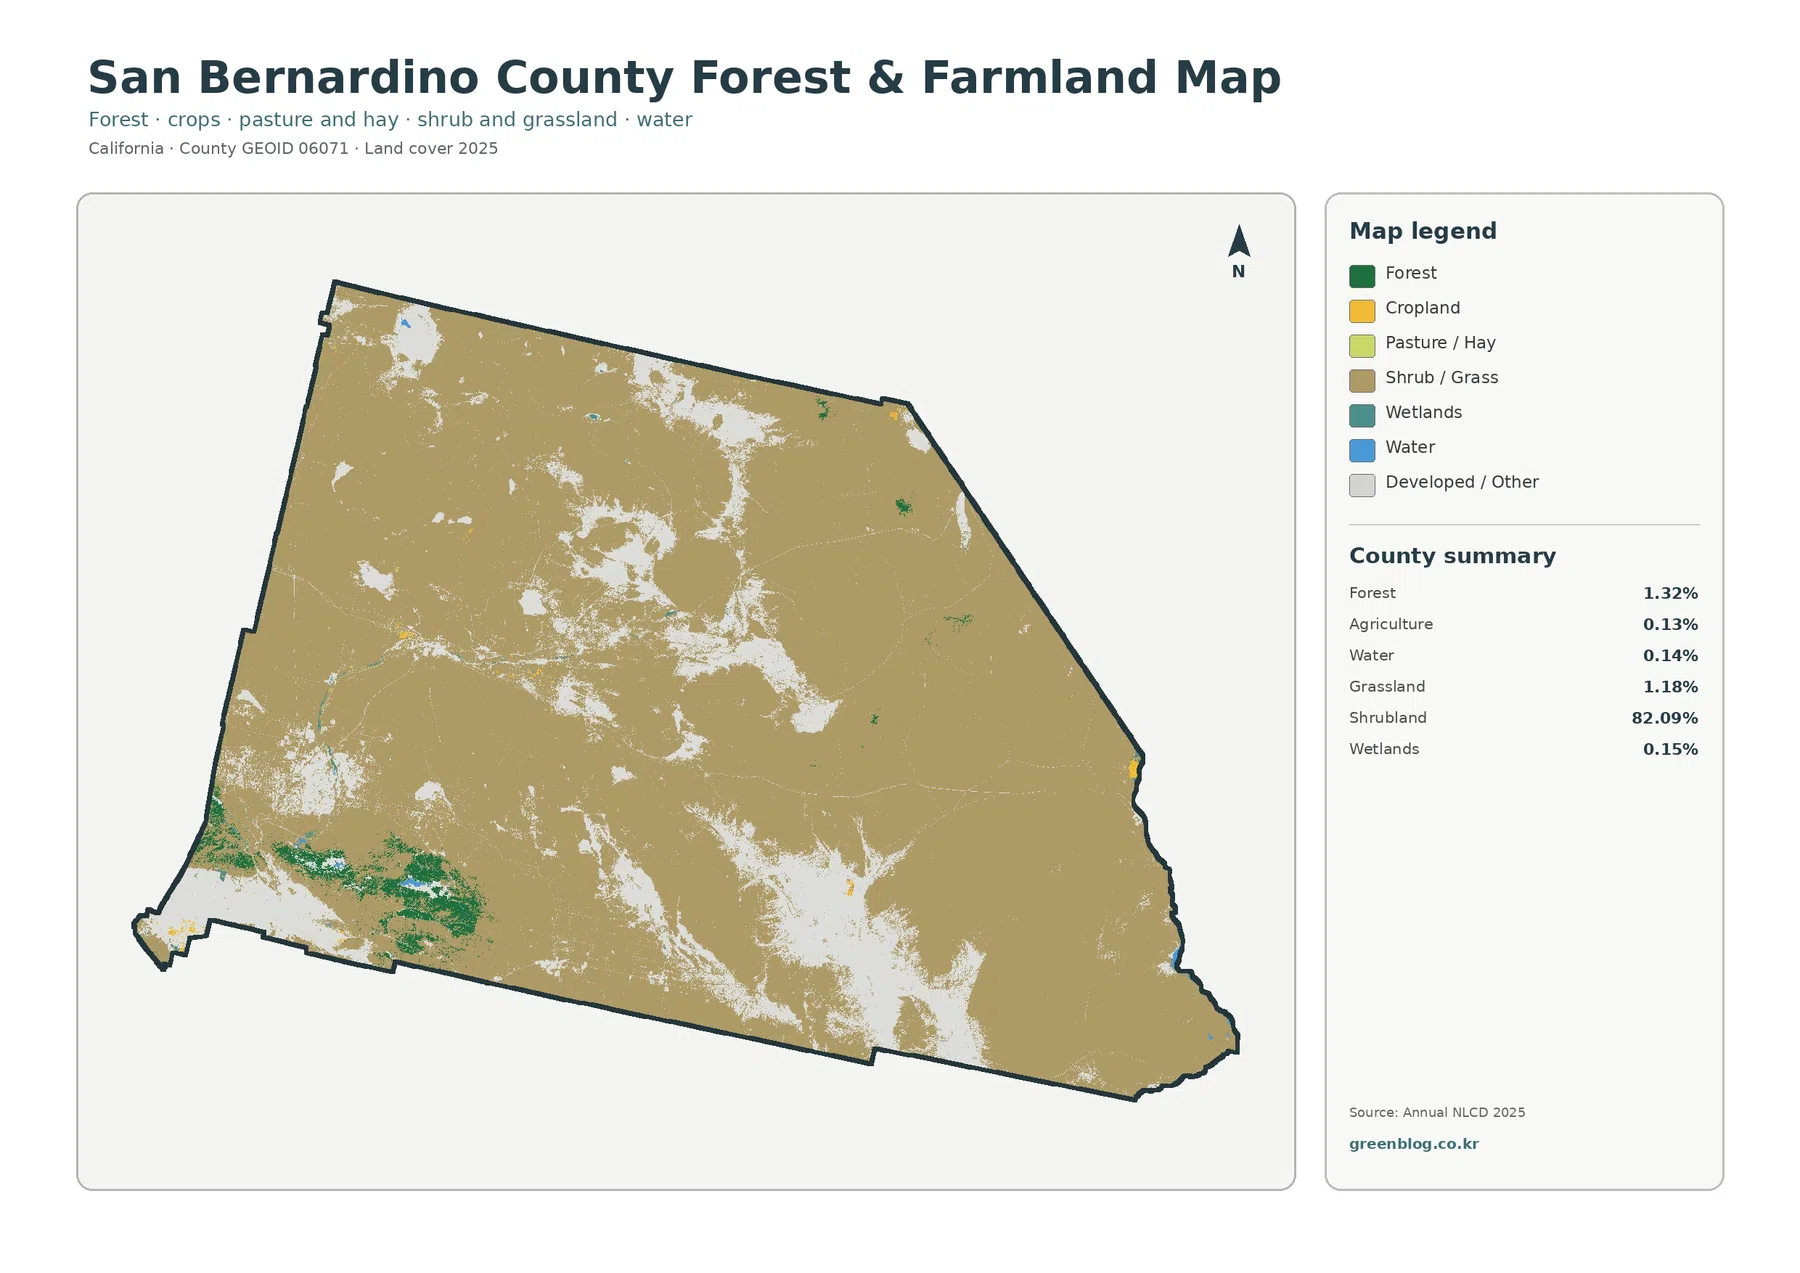
The small forest percentage is partly a consequence of scale. San Bernardino County is so large that even a substantial mountain landscape occupies only a modest fraction of the full county area. On the map, however, the green belt is a clear geographic transition. It separates the dense southwest from the immense shrub-dominated interior and helps explain why a single county contains urban valleys, forested mountains, and desert basins.
Agriculture is only 0.13% in the 2025 summary. Unlike Sacramento, Imperial, or other California counties where agricultural cover can organize large parts of the map, San Bernardino shows farmland as small and scattered pieces. Grassland is also limited at 1.18%. The forest-and-farmland view is therefore most valuable not because it reveals a large farming belt, but because it removes much of the developed and barren detail and makes the mountain vegetation stand out.
Water and wetlands are similarly small in percentage, at 0.14% and 0.15%. Their limited area does not make them unimportant. County biological-resource material identifies the Mojave and Colorado Rivers as conspicuous water features in the Desert Region, while the Mountain Region contains several named lake communities. The land-cover map can show water-covered cells, but it does not map channel centerlines, watershed boundaries, flood zones, or water rights.
The 1985–2025 difference map is mostly about where classes changed, not why they changed
The endpoint comparison reports a 7.46% overall class difference between 1985 and 2025. Within that total, 1.32% is mapped as changing to developed, 1.04% as forest loss, 0.15% as agricultural loss, and 4.92% as other class difference. A wetland-difference category is also present in the legend, but the map summary does not provide a separate percentage for it. These figures should be treated as mapped classification differences rather than a complete history of land-use decisions.
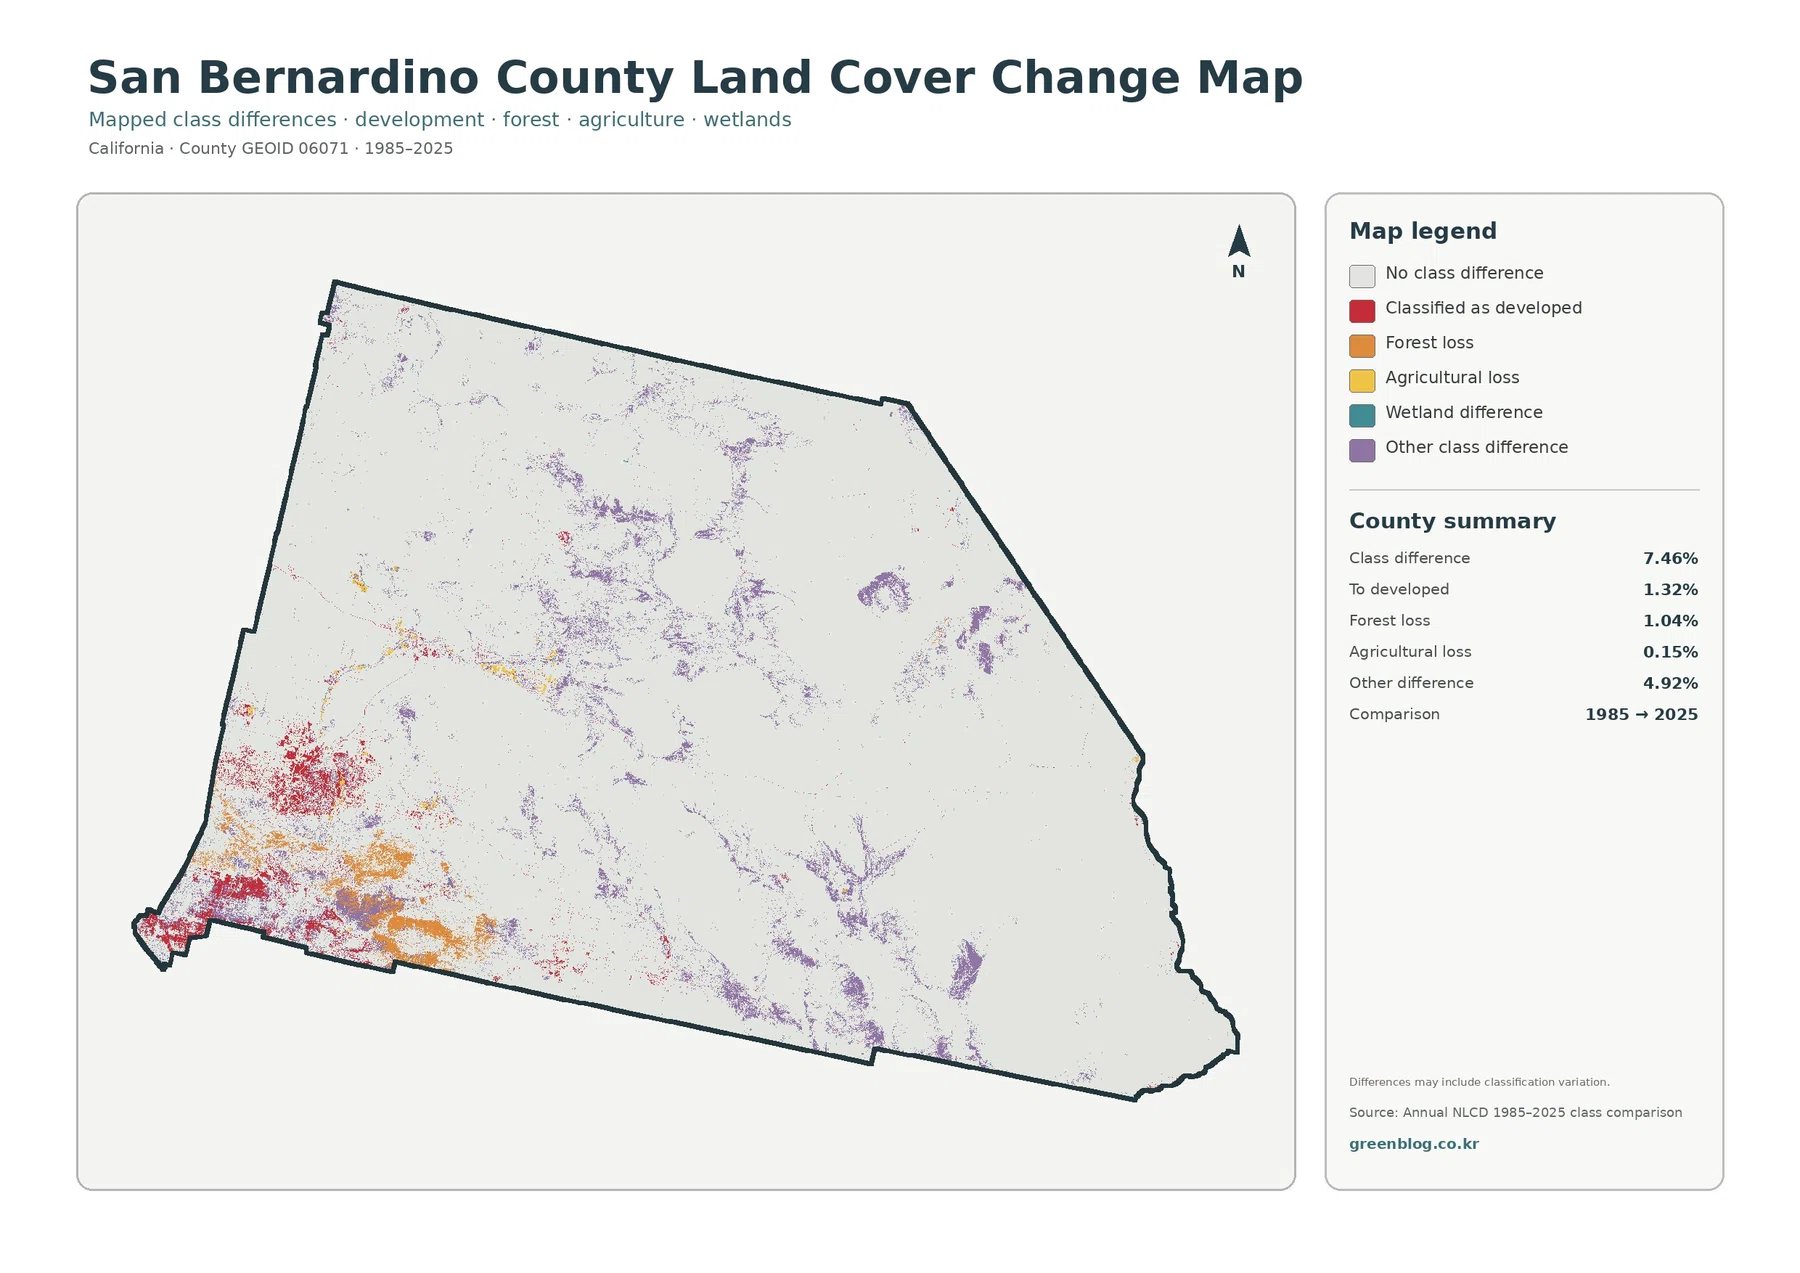
Red change-to-developed areas are most visible around the southwest urban region and several inland development clusters. Orange forest-loss patches occur near the mountain belt and nearby transition areas. Purple other-class differences are much more scattered across the desert interior. That distribution is important because it prevents every colored change cell from being interpreted as urban expansion.
Desert classification can be sensitive to how a raster cell is represented at each endpoint. A cell containing sparse shrubs, bare soil, rock, or a mixture of those surfaces may receive different broad classes in different years without experiencing a dramatic land-use conversion. The change map itself warns that classification variation can contribute to the observed differences. That caution is especially relevant where shrubland and barren cover meet across large open areas.
For a site-specific change study, intermediate years and local records are necessary. The 1985–2025 image is excellent for locating places worth investigating, but it cannot assign a cause such as a particular subdivision, wildfire, restoration project, or agricultural decision. The map shows the endpoint difference; the explanation requires additional evidence.
A practical way to compare all four maps across such a large county
Start with the general land-cover map and divide the county mentally into the dense southwest, the mountain belt, and the broad desert interior. This gives every specialized map a geographic reference. Once those three zones are familiar, the forest map explains the mountain transition, the impervious map separates hard-surface intensity from general development, and the change map shows where endpoint classifications differ.
For the southwest Valley Region, compare general developed cover with imperviousness first. A broad developed area may contain both high and moderate hard-surface values, which helps distinguish dense built surfaces from lower-density development. The same comparison works around Victorville, Hesperia, Apple Valley, and Barstow, where developed clusters are separated by large areas of open desert.
For the mountains, pair the general map with the forest-and-farmland view. Green forest becomes easier to locate once the surrounding shrubland and barren classes are simplified. Then use the change map to see where forest-loss categories sit in relation to the current forest belt. This sequence gives more context than opening the change map first and trying to interpret orange patches without knowing the 2025 cover around them.
Across the northern and eastern desert, the main question is often not development but the boundary between shrubland, barren land, and scattered other classes. Here the general map should remain the primary reference. Purple difference cells on the change map are useful as flags, but they need extra evidence before they are treated as meaningful ecological or land-use transitions.
Map File Information and four original JPG maps
The download package contains four San Bernardino County JPG maps: 2025 general land cover, forest and farmland, impervious surface and developed land, and the 1985–2025 land-cover class-difference map. All four use the same county boundary, so they can be placed side by side in reports, presentations, classroom materials, or printed reference sheets without having to reconcile different outlines.
For printing, two-map comparisons are often clearer than shrinking all four images onto one page. General land cover plus impervious surface works well for the southwest urban region. General land cover plus forest and farmland explains the mountain transition. General land cover beside the change map is the most useful pair when the goal is to discuss how 2025 cover relates to the 1985 endpoint.
The JPG files are finished reference graphics, not raw GIS layers. They are useful for seeing broad distribution and regional contrast, but they are not designed for extracting cell values, measuring exact acreage, or editing county geometry. Anyone who needs analytical data should return to Annual NLCD and authoritative boundary sources rather than measuring the rendered image.
What the maps cannot tell you about parcels, ownership, or exact boundaries
Annual NLCD is raster data at roughly 30-meter scale. Each cell receives a representative class even when the ground inside it contains several surfaces. A suburban cell might include a roof, road, lawn, trees, and bare soil. A desert cell might include shrubs, rock, and exposed soil. That mixed-cell effect is one reason boundaries between developed land, shrubland, and barren land should be treated as generalized rather than surveyed lines.
Land cover must also be kept separate from land ownership. San Bernardino County has an unusually large amount of federally managed land, but a federal ownership boundary is not a land-cover class. Shrubland can exist on federal, state, county, private, or other property. Likewise, developed cover does not define a city limit, and forest cover does not identify a protected area.
The same distinction applies to zoning and legal land use. A shrubland pixel does not say whether development is permitted, an agricultural pixel does not prove agricultural zoning, and a barren pixel does not mean the land is vacant or available. Parcel maps, zoning layers, county planning documents, and project records are the correct sources for those questions.
Finally, the dates matter. The current-cover maps summarize 2025 conditions, while the change map compares 1985 and 2025. Development, wildfire, vegetation recovery, or other changes after the observation year may not appear. If a current site decision depends on recent conditions, pair these maps with up-to-date aerial imagery and local records.
Frequently Asked Questions
Why is shrubland 82.09% of San Bernardino County?
Most of the county’s land area lies in its Desert regions. The official County Profile assigns 17% to the East Desert and 77% to the North Desert, while the Valley and Mountain regions are much smaller. In the 2025 land-cover classification, much of that dry open landscape is mapped as shrubland. Desert geography and shrubland classification are related here, but they are not identical concepts.
How can developed cover be only 3.63% when the southwest looks heavily urbanized?
The county is extremely large, so a dense urban area can occupy a small percentage of the total boundary. Developed cover is concentrated in the southwest Valley Region and in separate High Desert city clusters around places such as Victorville, Hesperia, and Apple Valley. The percentage averages those urban areas together with thousands of square miles of desert and mountains.
Does the 7.46% 1985–2025 class difference equal permanent land-use change?
No. It means that the broad mapped class differs between the two endpoints for 7.46% of the county. Real development and vegetation change can contribute, but classification variation and mixed pixels can also matter, especially where shrubland and barren surfaces meet. Intermediate-year data and local records are needed to determine when a specific place changed and why.
Map File Information
Download the four original San Bernardino County land-cover JPG maps together in one ZIP file.
- File Type: ZIP containing four JPG files
Related Maps
- Alameda County California Land Cover Map
- Alpine County California Land Cover Map
- Amador County California Land Cover Map
Sources and references
These sources document the land-cover classes, county boundary, and official geographic context used to interpret San Bernardino County. Land-cover sources describe mapped surface conditions; county planning and profile sources provide regional background and should not be treated as substitutes for the raster classifications.
- MRLC Annual NLCD Data — annual land-cover and related datasets
- USGS Annual NLCD Land Cover Classification — class definitions and legend information
- U.S. Census Bureau TIGER/Line Shapefiles — county boundary reference data
- San Bernardino County Community Indicators – County Profile — official county size and Valley, Mountain, East Desert, and North Desert context
- San Bernardino Countywide Plan Biological Resources Existing Conditions — official background on Desert, Mountain, and Valley geography and major water features
Green Map creates custom-edited map images using open geographic data sources such as geoBoundaries, Natural Earth, OpenStreetMap, and government open data.
These maps are edited visual materials, not raw data files, and are provided for education, documents, presentations, and graphic reference.