San Benito County is mostly open land cover rather than built surface. In the 2025 summary, grassland accounts for 44.70% and shrubland for 38.55%, so the two classes together cover 83.25% of the county. Forest adds 8.61%, agriculture 4.48%, and developed cover only 2.56%. The most obvious exception to the broad grass-and-shrub pattern is the concentrated developed and agricultural area in the north.
The four maps on this page separate that landscape into general land cover, forest and farmland, impervious surface, and mapped class differences from 1985 to 2025. The WebP images are designed for quick viewing, and the four original JPG maps are available together in one download below. These are land-cover maps: they describe the physical surface, not zoning, ownership, parcel boundaries, or permission to develop a property.
Table of Contents
A small northern hard-surface footprint stands out in an otherwise open county
Developed cover is just 2.56% of the county, yet its location makes it easy to find. The largest red cluster sits in the northern part of San Benito County, broadly corresponding to the Hollister area shown as urban in the county’s General Plan GIS. A much smaller developed presence appears toward the northwest, while the middle and southern portions of the county contain only scattered built pixels and narrow linear traces.
The impervious map makes that concentration even clearer. Mean impervious surface is only 0.76%, and just 0.53% of the county is mapped at 50% impervious or higher. The darker 20–49%, 50–79%, and 80–100% classes are packed into the northern developed cluster. Away from that area, most of the map is white or nearly white, showing how little pavement and roof surface is present when the county is viewed as a whole.
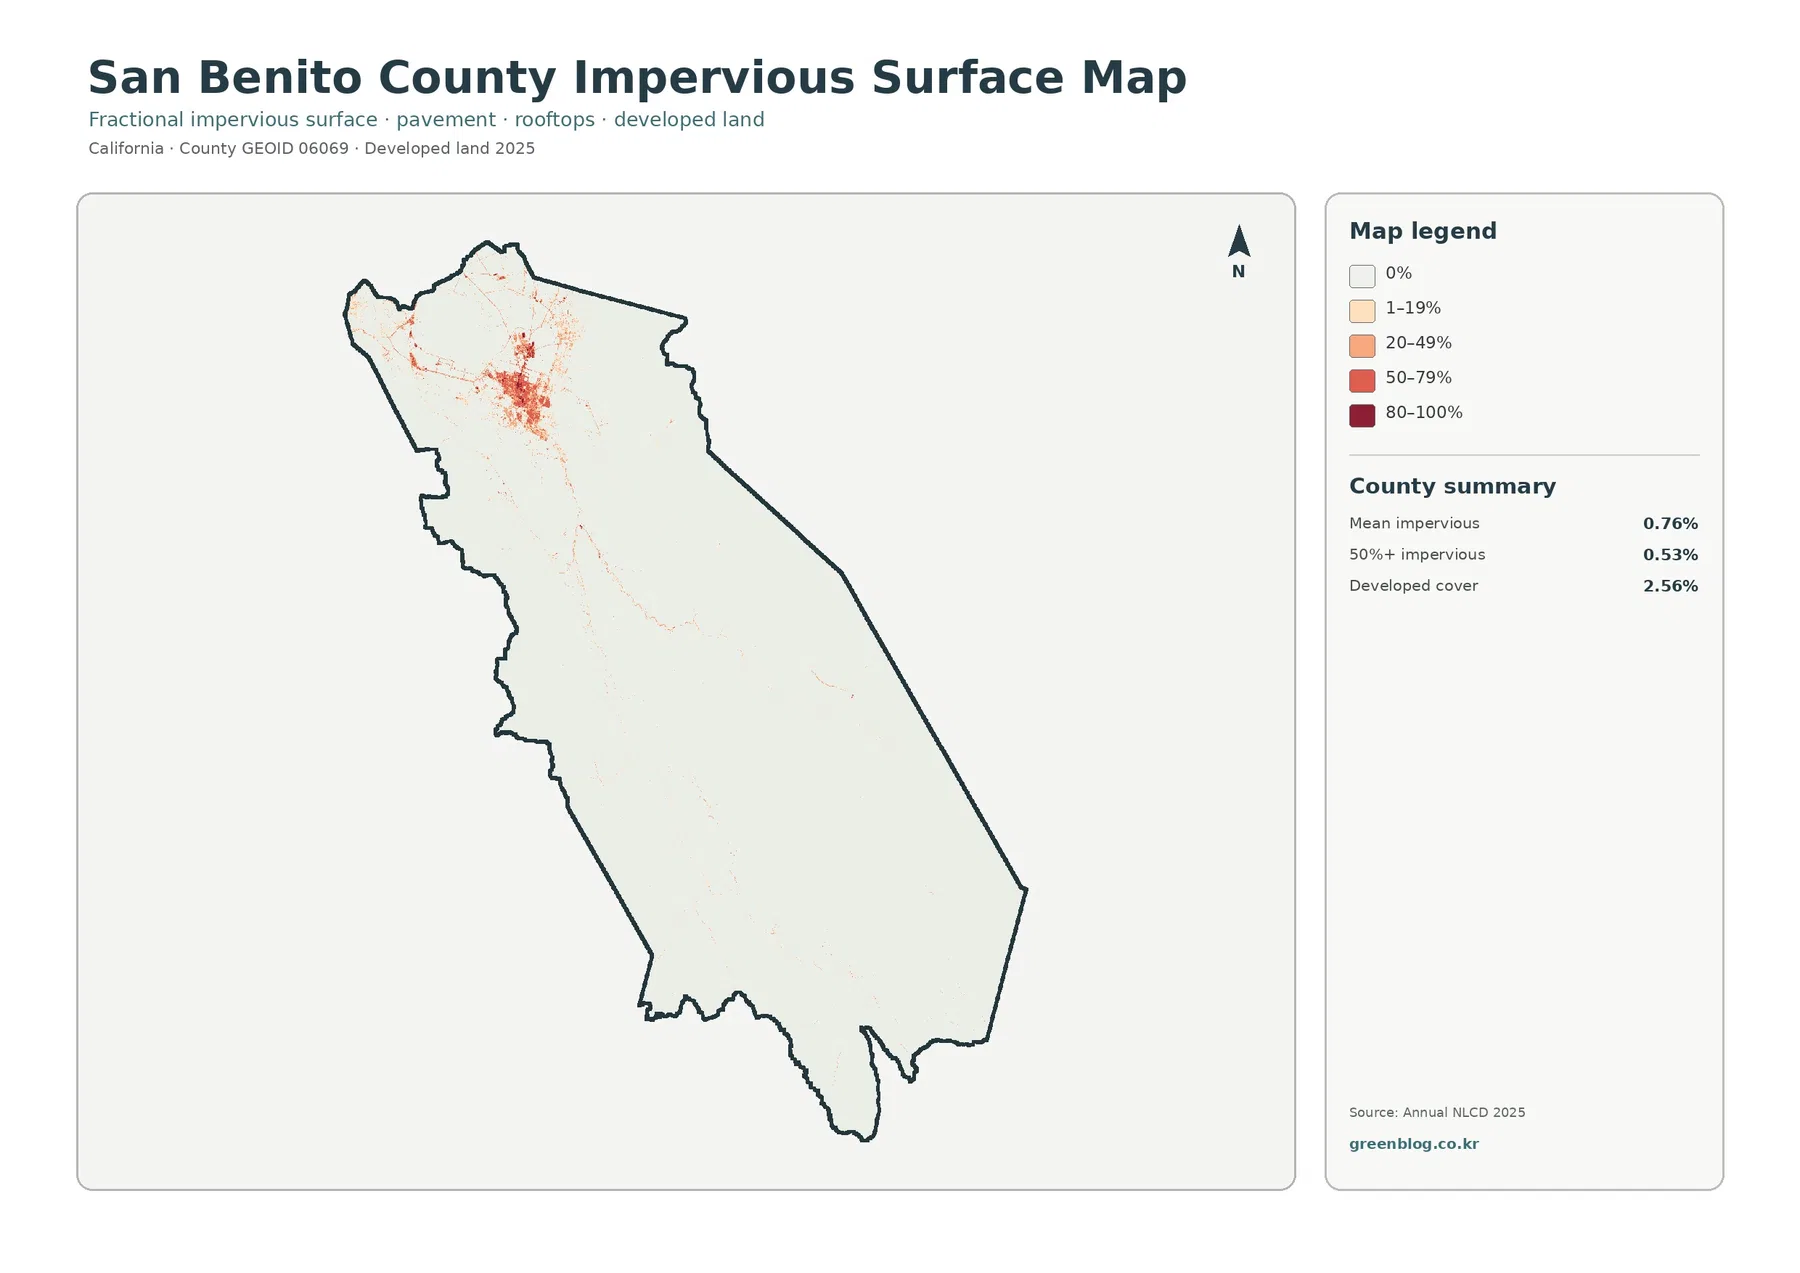
Developed cover and impervious surface should not be expected to have the same percentage. A developed land-cover cell can include houses, roads, lawns, trees, bare soil, and other surfaces at the same time, while the impervious product estimates the share occupied by hard surfaces such as pavement and rooftops. That distinction explains why 2.56% developed cover can coexist with a countywide impervious mean below 1%.
The countywide average also hides strong local contrast. A visitor looking only at 0.76% might imagine that every part of San Benito County has almost no hard surface. The map shows something different: the northern urban area contains many relatively high values, but those values are diluted by the very large area of grassland, shrubland, and forest farther south. The map is therefore more useful for locating concentration than for applying one average to a neighborhood.
Grassland and shrubland divide more than four-fifths of the 2025 surface
Grassland is the single largest 2025 class at 44.70%, followed closely by shrubland at 38.55%. Their combined 83.25% share is the defining statistic for San Benito County, but the spatial pattern adds important detail. Broad grassland areas cover much of the east and northeast and reappear through central and southern sections, while shrubland forms extensive irregular belts in the west, southwest, and parts of the eastern interior.
The boundary between those two covers is uneven rather than geometric. Large patches bend along ridges, valleys, and changes in vegetation, so the map reads as a mosaic of open grass and woody shrub cover rather than as two simple halves. In several places, narrow forest patches interrupt that mosaic. The result is a landscape in which natural-looking vegetation classes dominate the visual field even though working ranches, roads, parks, and private properties may be present within them.
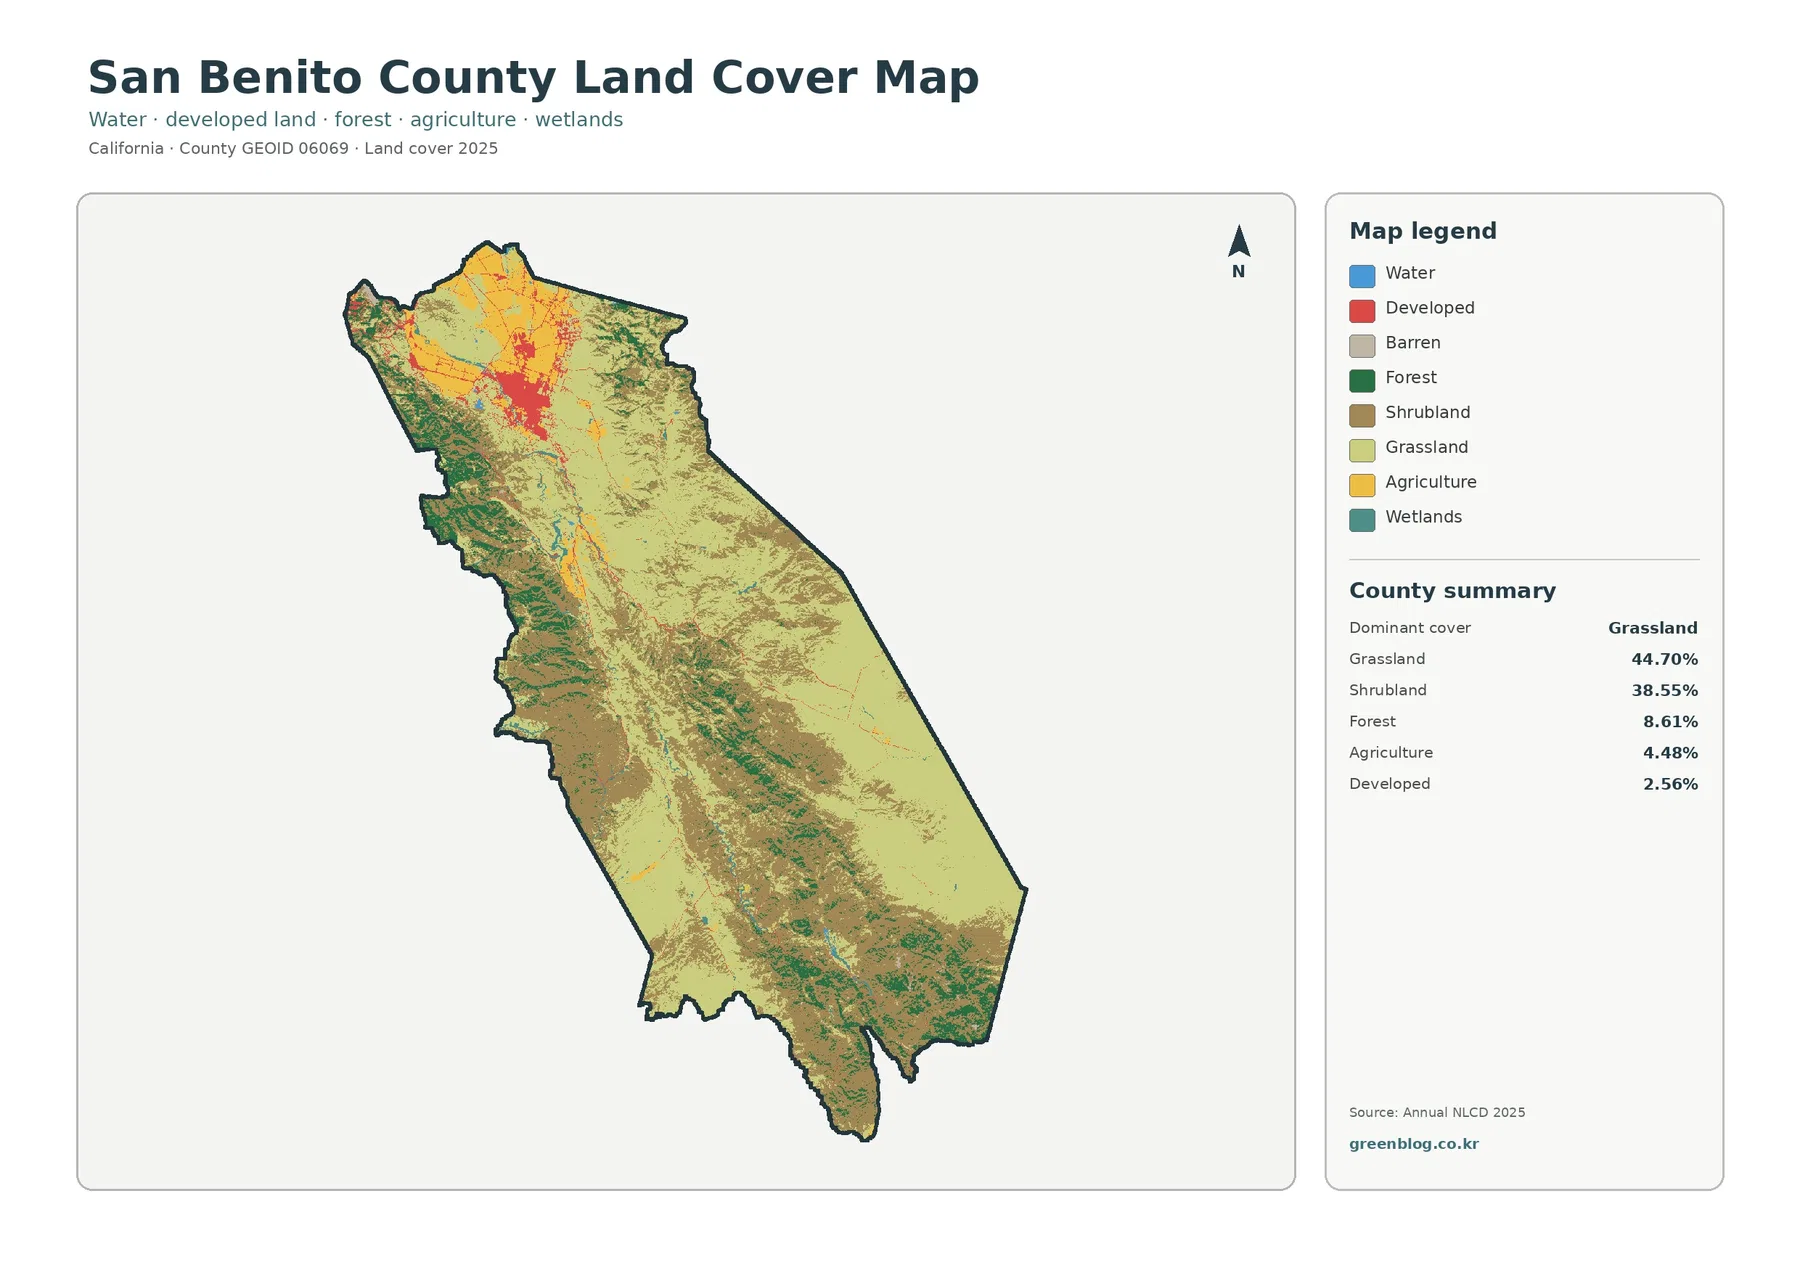
It is important not to translate “grassland” directly into “park,” “vacant land,” or “unused land.” Land cover records what the surface looks like in the classification, not how a parcel is legally designated or managed. San Benito County’s own General Plan GIS includes separate Agriculture and Rangeland categories. A working grazing property can therefore appear as grassland or shrubland in Annual NLCD even when its administrative or economic use is agricultural.
This difference is especially useful in San Benito County because county documents describe agriculture and grazing as major parts of the rural landscape, while the NLCD agriculture class is only 4.48%. The two statements measure different things. Cultivated or agricultural surface is one mapped cover, while rangeland with natural grasses or shrubs can remain in grassland or shrubland classes. Comparing the land-cover map with county planning layers helps prevent a common interpretation error.
Forest and farmland become easier to trace when developed and other cover are simplified
Forest makes up 8.61% of the county. It does not form one continuous block; instead, green areas appear along western uplands and in repeated bands through the central and southern mountain landscape. Agriculture, at 4.48%, is more concentrated in the north and in a few elongated valley-like patches extending away from the northern developed area. The forest-and-farmland view makes those smaller classes easier to separate from the much larger grass and shrub background.
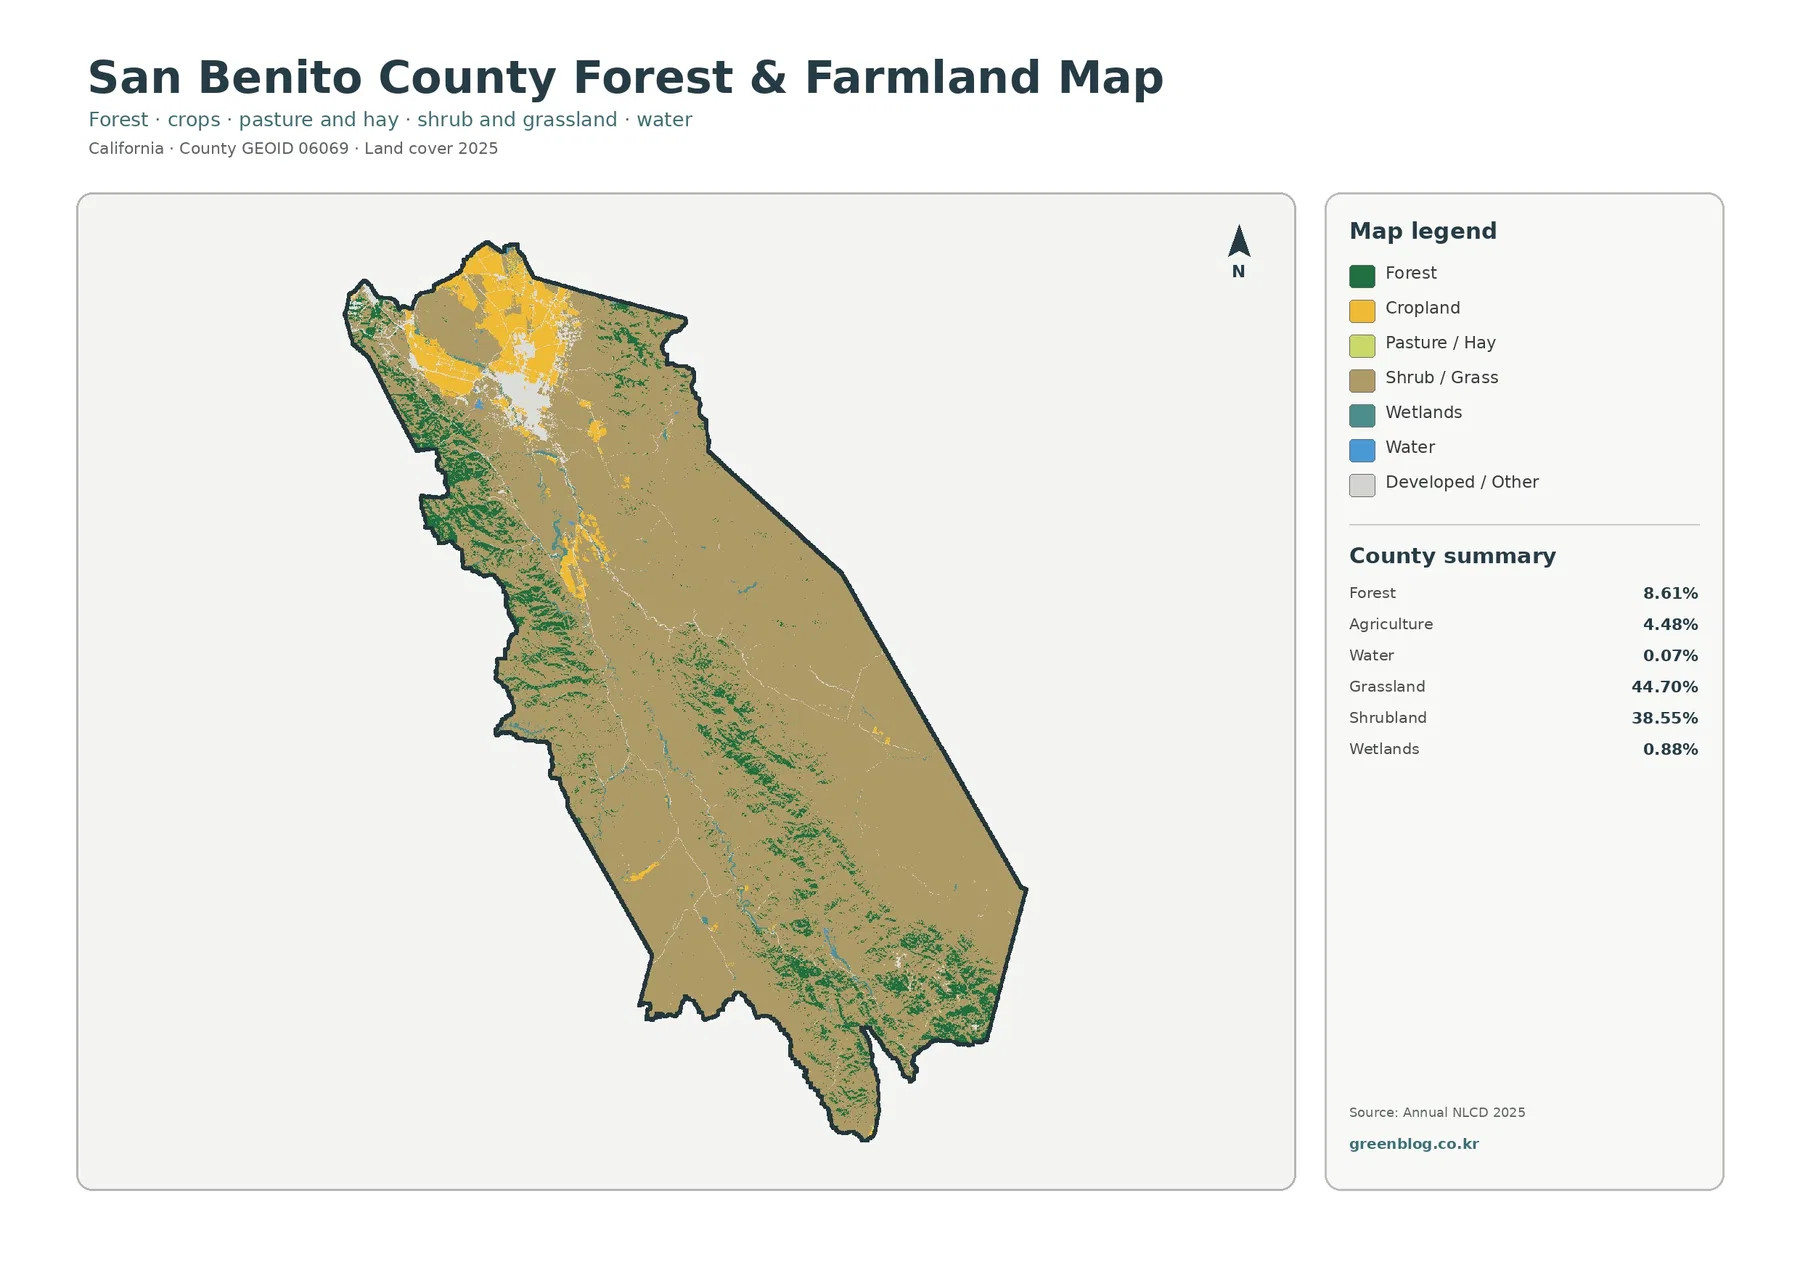
The northern agricultural area is visually important even though it represents a small countywide percentage. Yellow fields occur around and beyond the main developed cluster and in a narrower north–south sequence farther into the county. Their geometry is more regular than many surrounding shrub and grass patches, which helps distinguish farmed cover from the irregular vegetation of slopes and open rangeland. The map still does not identify crop type, farm ownership, or an agricultural zoning designation.
Pinnacles National Park provides a useful local reference for the vegetation pattern in the southwestern part of the county. The National Park Service describes chaparral as the park’s most widespread plant community and also notes woodlands, grasslands, and riparian vegetation. That official description is consistent with the mix of shrub, forest, and grass classes visible in the broader San Benito County map. The park boundary itself is not drawn here, so the land-cover colors should not be treated as a map of National Park Service property.
Forest percentage also needs careful wording. An 8.61% forest class does not equal every location that contains trees. Narrow riparian tree lines, scattered oaks, farm windbreaks, and urban trees may be mixed with surrounding land cover and may not form a large enough raster patch to appear as forest. Conversely, a forest cell says nothing about ownership, protection status, timber management, or public access.
Water and wetlands are tiny in area but useful as narrow reference features
Open water is only 0.07% of San Benito County and wetlands account for 0.88%. At full-county scale, those values are so small that blue and teal features can be difficult to see. On closer inspection, however, thin lines and small wet patches appear through northern, central, and southern valleys. They provide useful reference features because they interrupt large areas of grassland and shrubland even though they contribute little to the countywide percentage table.
A narrow water feature can matter visually more than its percentage suggests. Linear streams and small wet areas can mark transitions between vegetation types, farmland, and valley floors. In the forest-and-farmland map, the simplified palette makes these small blue and teal features easier to follow. Their limited extent also reinforces how strongly the county’s surface is dominated by dry open vegetation rather than large lakes or broad wetland complexes.
These colors are not regulatory wetland boundaries, flood zones, or water-right maps. Satellite classification generalizes narrow channels and seasonal water, and the appearance of a cell can vary with imagery and moisture conditions. Any decision involving wetland jurisdiction, drainage, flood hazard, or water management requires purpose-built hydrologic and administrative sources rather than this land-cover graphic alone.
The 1985–2025 comparison is relatively limited, but its categories are not all the same kind of change
The change map reports 11.81% of the county with a different broad class between the 1985 and 2025 endpoints. Of that summary, 1.20% is mapped as a change to developed, 1.07% as forest loss, 1.99% as agricultural loss, and 7.44% as other class difference. The “other” category is the largest part of the total, which is one reason the overall 11.81% should not be described as a single development or land-conversion rate.
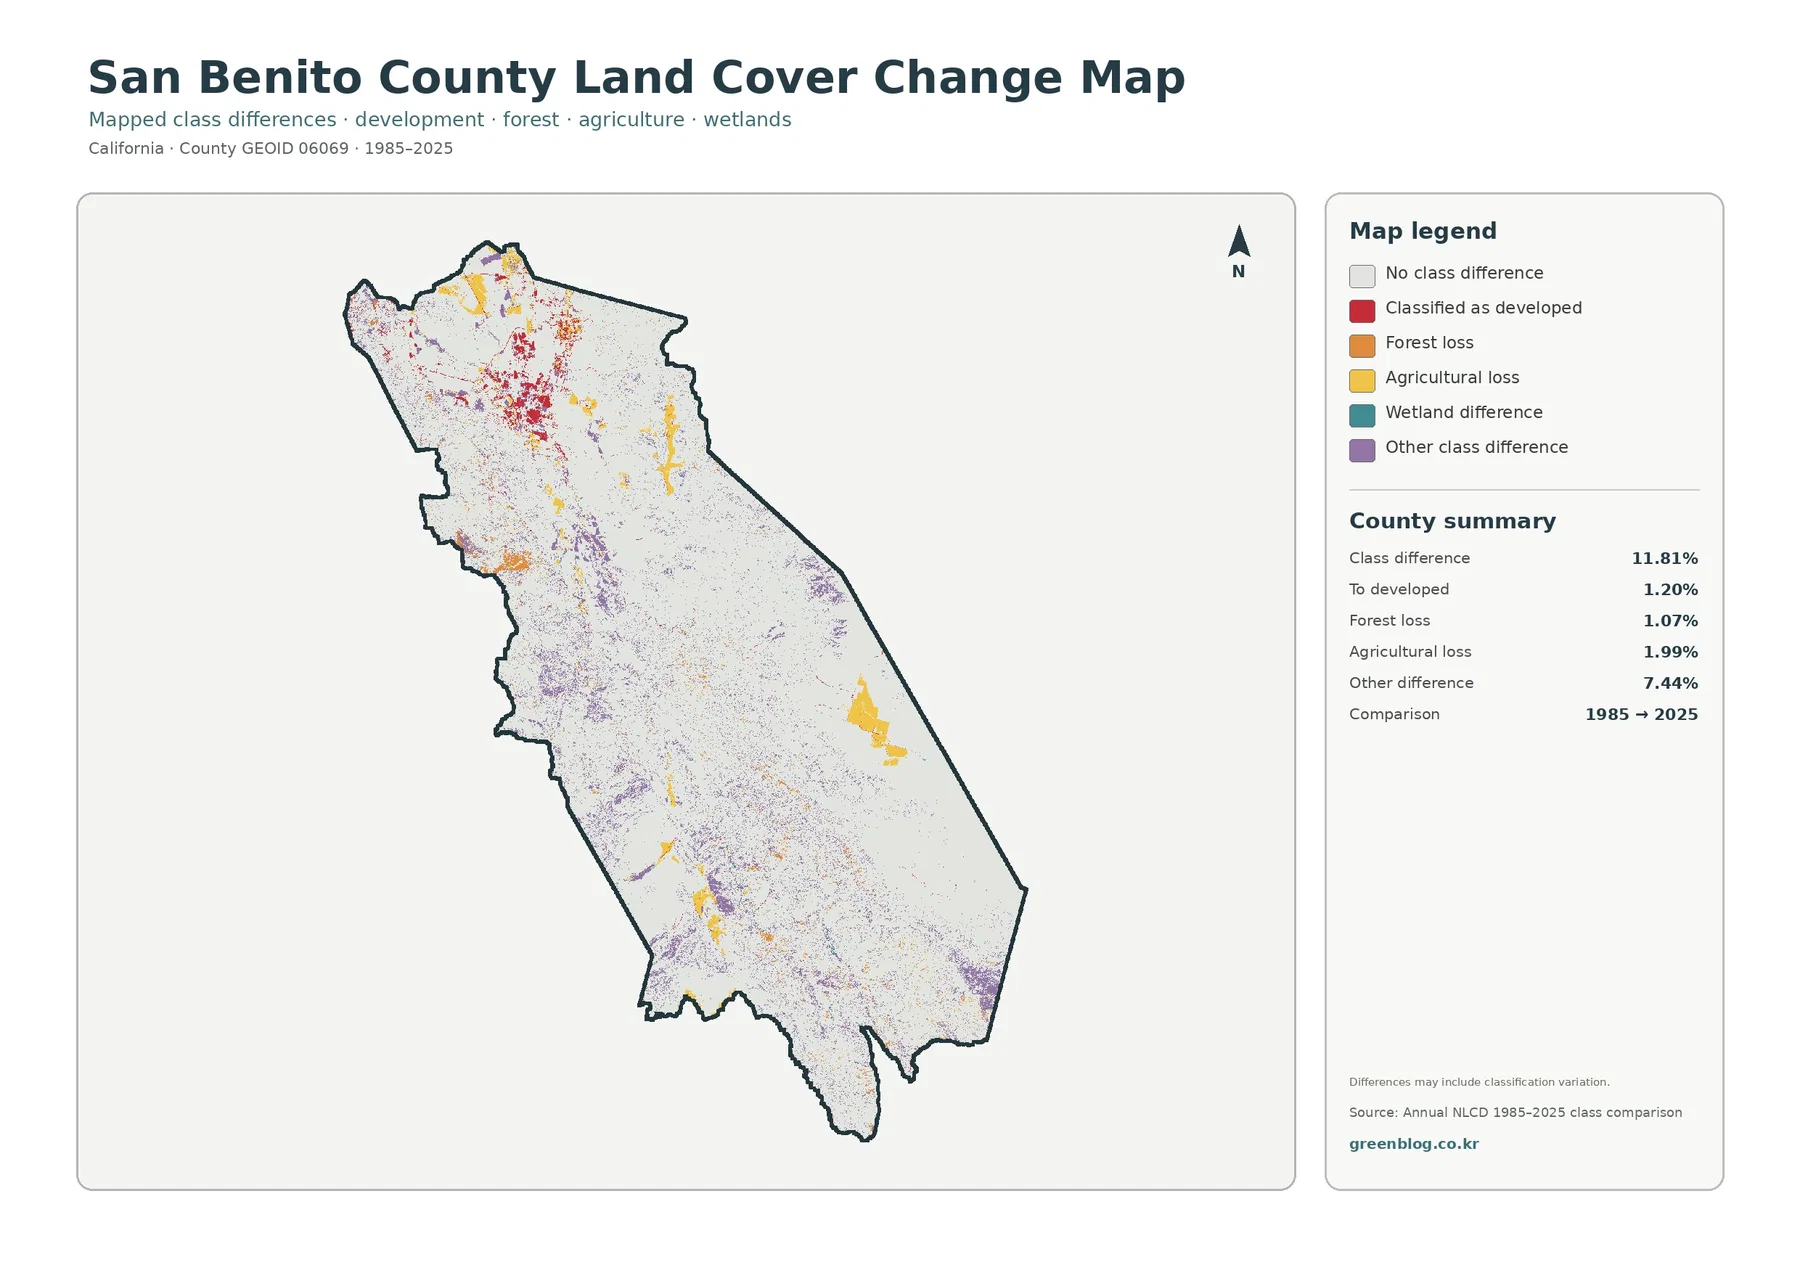
Red “to developed” cells are most visible around the northern developed area, where they occur along and around the present urban cluster. Agricultural-loss colors also appear in parts of the north and in scattered valley patches farther south. Forest-loss pixels are distributed near some of the wooded belts, while the purple other-difference class is scattered across many parts of the county. The pattern is therefore dispersed, with a stronger concentration of obvious development-related difference in the north.
The map itself warns that mapped differences may include classification variation. A different color at the two endpoints can reflect real surface change, but it can also be influenced by vegetation condition, mixed pixels, imagery, or classification boundaries. The 11.81% figure should therefore be described as an endpoint class difference, not as proof that 11.81% of San Benito County permanently changed legal land use.
White “no class difference” areas also have a limit. They indicate that the broad class at the 1985 endpoint and the broad class at the 2025 endpoint match. They do not prove that nothing happened during the 40 years in between. A location could have changed temporarily and returned to the same class, a sequence that this two-date summary would not reveal. Annual data or historical aerial imagery is better for questions about timing.
A practical reading order for the four San Benito County maps
Start with the general map and identify the two dominant covers: grassland and shrubland. Once their large patches are clear, locate the northern developed cluster and the main agricultural areas. This establishes the county’s broad contrast between a small built center and a much larger open landscape. It also prevents the minor classes from appearing more important than they are simply because their colors are visually strong.
Next, use the forest-and-farmland map to follow the green forest bands and yellow agricultural patches without the full general legend competing for attention. That view is useful for habitat discussions, rural-landscape comparisons, and presentations that need to separate cultivated cover from grass and shrub cover. It also makes the very small amount of water and wetland easier to notice.
Then move to the impervious map if the question is settlement intensity. The contrast is immediate: the northern cluster contains nearly all of the darker hard-surface classes, while most of the county has little or no mapped impervious surface. Finally, use the 1985–2025 comparison only after the current pattern is familiar. That sequence keeps present-day developed cover separate from “changed to developed” pixels and keeps current agriculture separate from agricultural-loss categories.
For printing or slide use, retain the title, legend, year, and county summary. The first three maps describe 2025 conditions, while the fourth compares 1985 with 2025. Cropping away those labels can make a current percentage such as 44.70% grassland look interchangeable with a change value such as 11.81%, even though the two numbers answer completely different questions.
Map File Information and four original JPG downloads
The download ZIP contains four San Benito County JPG maps: the 2025 general land-cover map, the forest-and-farmland map, the impervious-surface and developed-land map, and the 1985–2025 land-cover change map. All four use the same county boundary, so they can be placed side by side for classroom work, reports, presentations, or quick visual comparison. They are finished map graphics rather than raw GIS layers.
The general map is the best single overview because it includes every major class and the county summary. The forest-and-farmland map is cleaner when the subject is open vegetation, woodland, or farmed cover. The impervious map is the strongest choice for showing where hard surface is concentrated, and the change map is useful when a discussion needs a 1985–2025 endpoint comparison. Choosing the map that matches the question avoids overloading one image with information it was not designed to show.
Keep each map’s legend readable when resizing the JPG. The summary numbers apply to the county as a whole, not to an individual parcel, neighborhood, or ranch. Anyone who needs exact cell values, area calculations, or overlay analysis should use the source Annual NLCD data and an official county boundary in GIS rather than estimating from the finished graphic.
Raster classification, seasonal vegetation, and administrative boundaries set clear limits
Annual NLCD is a raster classification. Real ground surfaces can contain grass, shrubs, trees, exposed soil, pavement, and water within a small area, but the final map must simplify those mixtures into standardized classes or an impervious percentage. Boundaries between grassland and shrubland may therefore look cleaner than they do on the ground, while narrow streams, roads, field edges, and tree lines can be generalized or interrupted.
Seasonal appearance matters in a county dominated by grass and shrub vegetation. A grass-covered slope can look very different after winter rain than it does in the dry season, and shrub or woodland condition can vary after drought or fire. The map supplies a standardized 2025 classification, but it is not a field inventory of every plant community and it does not record every seasonal shift visible at ground level.
Administrative interpretation requires another layer of caution. San Benito County’s planning GIS contains categories such as Agriculture, Rangeland, Residential, and Urban, while NLCD contains physical covers such as grassland, shrubland, forest, and developed. A parcel can be managed or zoned for one purpose while its visible surface falls into another land-cover class. For permitting, ownership, agricultural preservation, or city-limit questions, county planning and parcel sources should take priority.
The change layer has the same generalization issue plus an additional time limitation. It compares two endpoints, not every year between them. The map is valuable for locating areas that deserve closer review, especially around the northern developed cluster and scattered forest or agricultural patches, but it cannot by itself establish the year, cause, duration, or legal meaning of a change.
Frequently Asked Questions
Why is agriculture only 4.48% when San Benito County is widely described as rural and agricultural?
The terms are measuring different things. County planning and local descriptions can include ranching, grazing land, agricultural zoning, and economic activity, while Annual NLCD classifies the physical surface. Working rangeland can still be mapped as grassland or shrubland if that is what covers the ground. The 4.48% figure therefore represents mapped agricultural cover, not the full extent or importance of agricultural land use.
What does a 0.76% mean impervious value tell me about development?
It shows that hard surfaces occupy a very small share of the county when averaged over the entire area. The detailed map is more informative than the average because high values are concentrated in the northern developed cluster rather than spread evenly. It should not be used as the impervious percentage for a specific neighborhood or parcel.
Does the 11.81% class difference mean 11.81% of the county permanently changed land use?
No. It means the broad mapped class differs between the 1985 and 2025 endpoints for 11.81% of the area. The map notes that classification variation may be included. Real development, forest change, and agricultural change can contribute to the total, but timing and cause require additional annual imagery, local records, or field information.
Sources and reference material
These sources help explain the Annual NLCD classes and provide official local context for San Benito County planning, farmland, and vegetation. Land-cover datasets and county administrative layers serve different purposes, so they should be used together only with that distinction in mind.
- MRLC Annual NLCD Data — annual land-cover and impervious data
- USGS Annual NLCD Land Cover Classification — class definitions and legend guidance
- U.S. Census Bureau TIGER/Line Shapefiles — county boundary reference
- San Benito County General Plan GIS Layer — local planning categories including Agriculture, Rangeland, and urban areas
- San Benito County FMMP 2020 Layer — local Important Farmland and grazing-land context
- Pinnacles National Park Plant Communities — official chaparral, woodland, grassland, and riparian vegetation context
Map File Information
Download the four original San Benito County land-cover JPG maps together in one ZIP file.
- File Type: ZIP containing four JPG files
Related Maps
- Alameda County California Land Cover Map
- Alpine County California Land Cover Map
- Amador County California Land Cover Map
Green Map creates custom-edited map images using open geographic data sources such as geoBoundaries, Natural Earth, OpenStreetMap, and government open data.
These maps are edited visual materials, not raw data files, and are provided for education, documents, presentations, and graphic reference.