You can download four high-resolution A3 JPG McDuffie County maps—county, city, water, and elevation—in one ZIP from this page. McDuffie County in east-central Georgia is easiest to orient around Thomson, where several numbered roads converge before spreading toward Dearing, the county edges, and the surrounding rural landscape. The general county view shows Thomson, Dearing, road corridors, streams, and selected landmarks; the water layer highlights Little River and a dense network of creeks and ponds; and the elevation layer shows rolling terrain with an actual displayed range of about 85 to 185 meters. Lighter WEBP previews are used on the page for faster viewing.
The county looks quite different depending on which layer is open. Thomson stands out as the main road and settlement reference, while Dearing is positioned farther east. North of those cities, Little River and several tributaries cut through a heavily dissected landscape; farther south, smaller creeks, ponds, and low valleys are scattered through the long lower half of the county. Comparing the views side by side makes it possible to understand where the cities sit, which roads cross the county, how water is distributed, and why the relief map shows so many narrow green valleys between higher ridges.
Table of Contents
Thomson is the clearest road hub on the county map
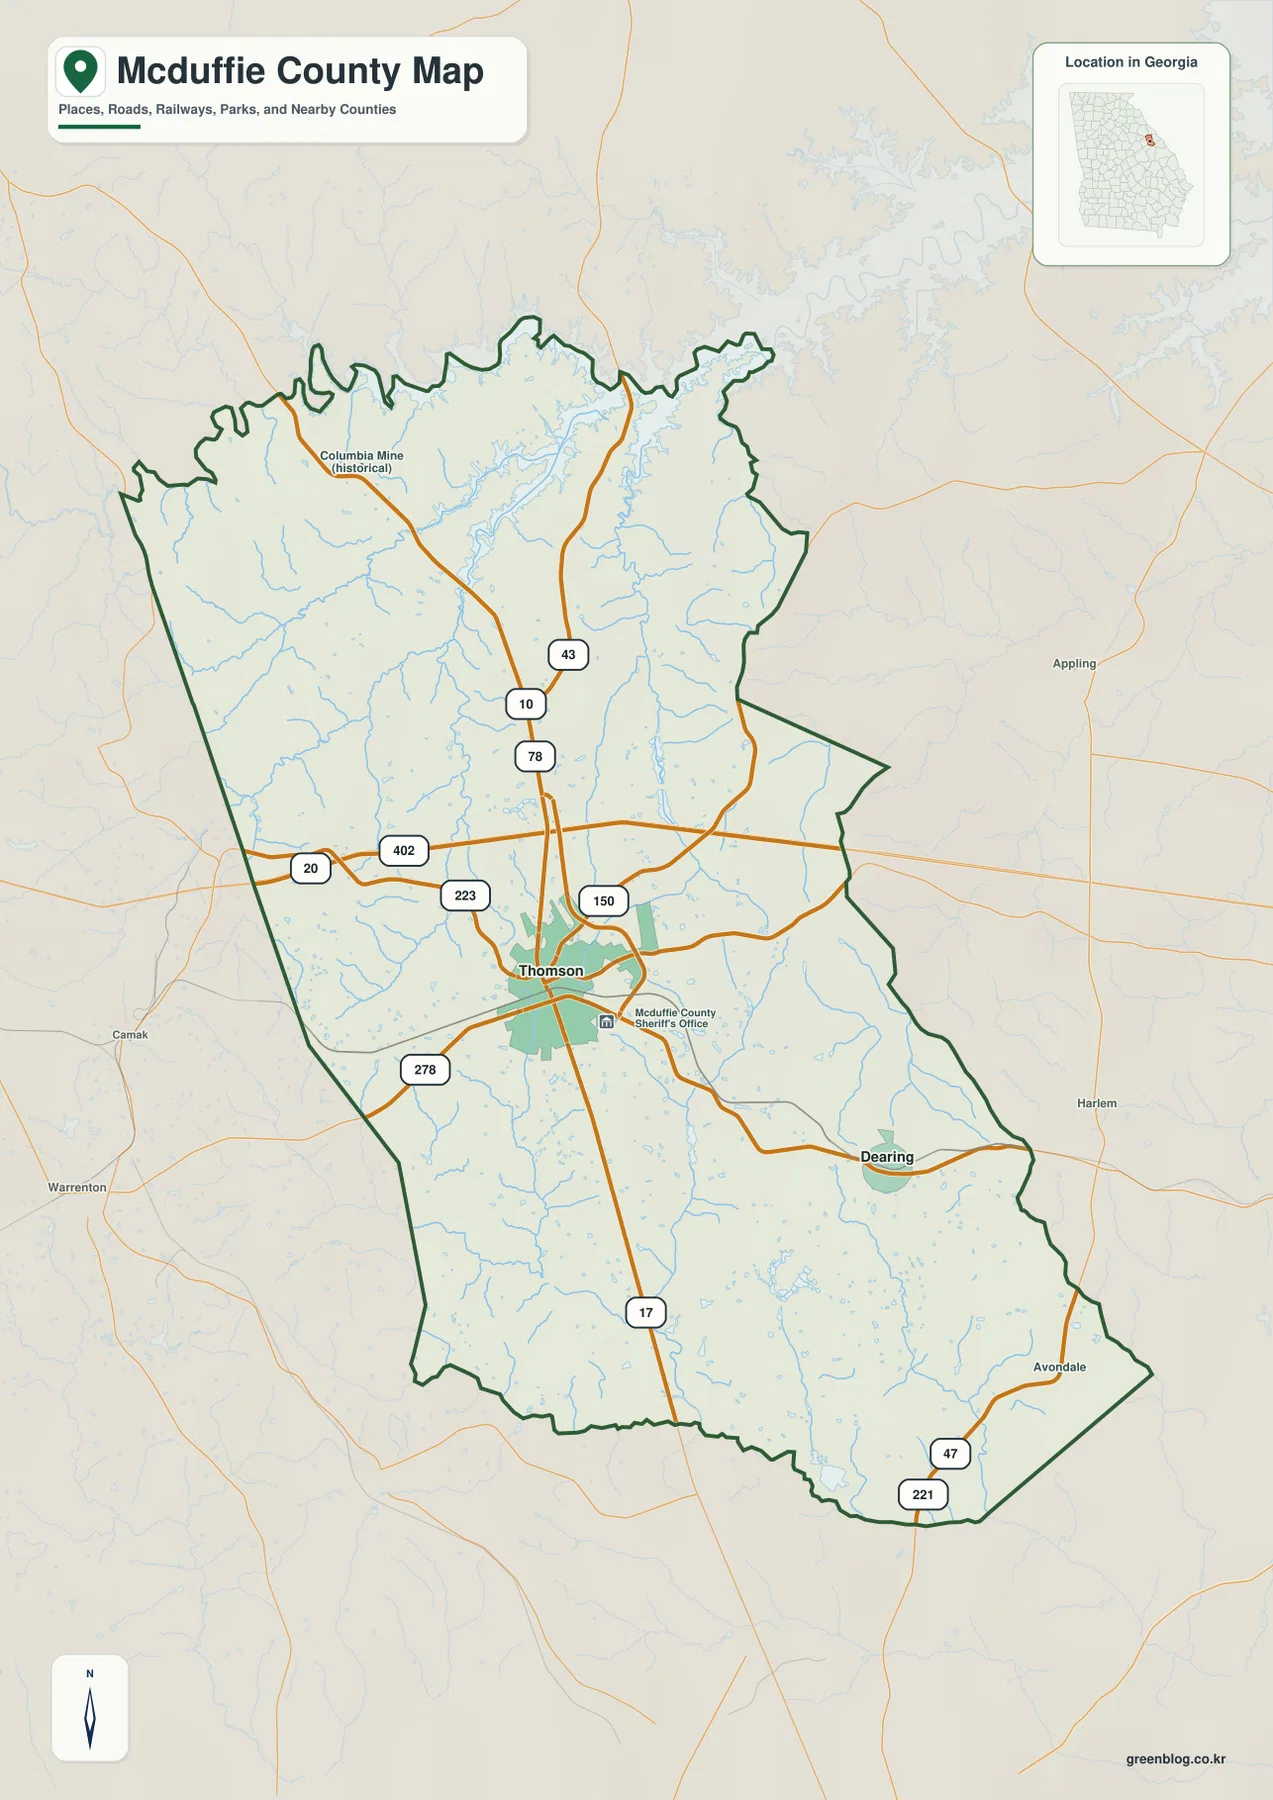
The general county map places Thomson near the middle of McDuffie County, slightly toward the north, and several major routes meet or pass close to the city. North of Thomson, labels 10, 78, and 43 are visible. The east–west corridor above the city carries labels 20 and 402, while 223 and 278 appear to the west and southwest. Route 150 extends eastward, and 17 runs south through the lower half of the county. In the southeastern corner, 47 and 221 provide additional orientation near the county boundary.
Dearing lies to the east of Thomson and gives the eastern side of the county a second clear settlement reference. The McDuffie County Sheriff’s Office is also marked just east of Thomson, helping identify the developed center on the otherwise rural-looking map. Outside the county outline, labels such as Appling, Harlem, Avondale, Camak, and Warrenton provide useful directional context. They should not be read as a list of McDuffie County municipalities; they are surrounding places visible beyond the county boundary.
One unusual label appears in the northwest: Columbia Mine (Historical). It is a useful example of how the general map contains more than present-day cities and highways. The earlier county article also mentions historic Wrightsboro as part of local history, but Wrightsboro is not emphasized as a major label on these four supplied previews. For that reason, the map set is best treated as a county-scale geography reference rather than a detailed guide to every historic site.
The ranked city view reduces the county to Thomson and Dearing
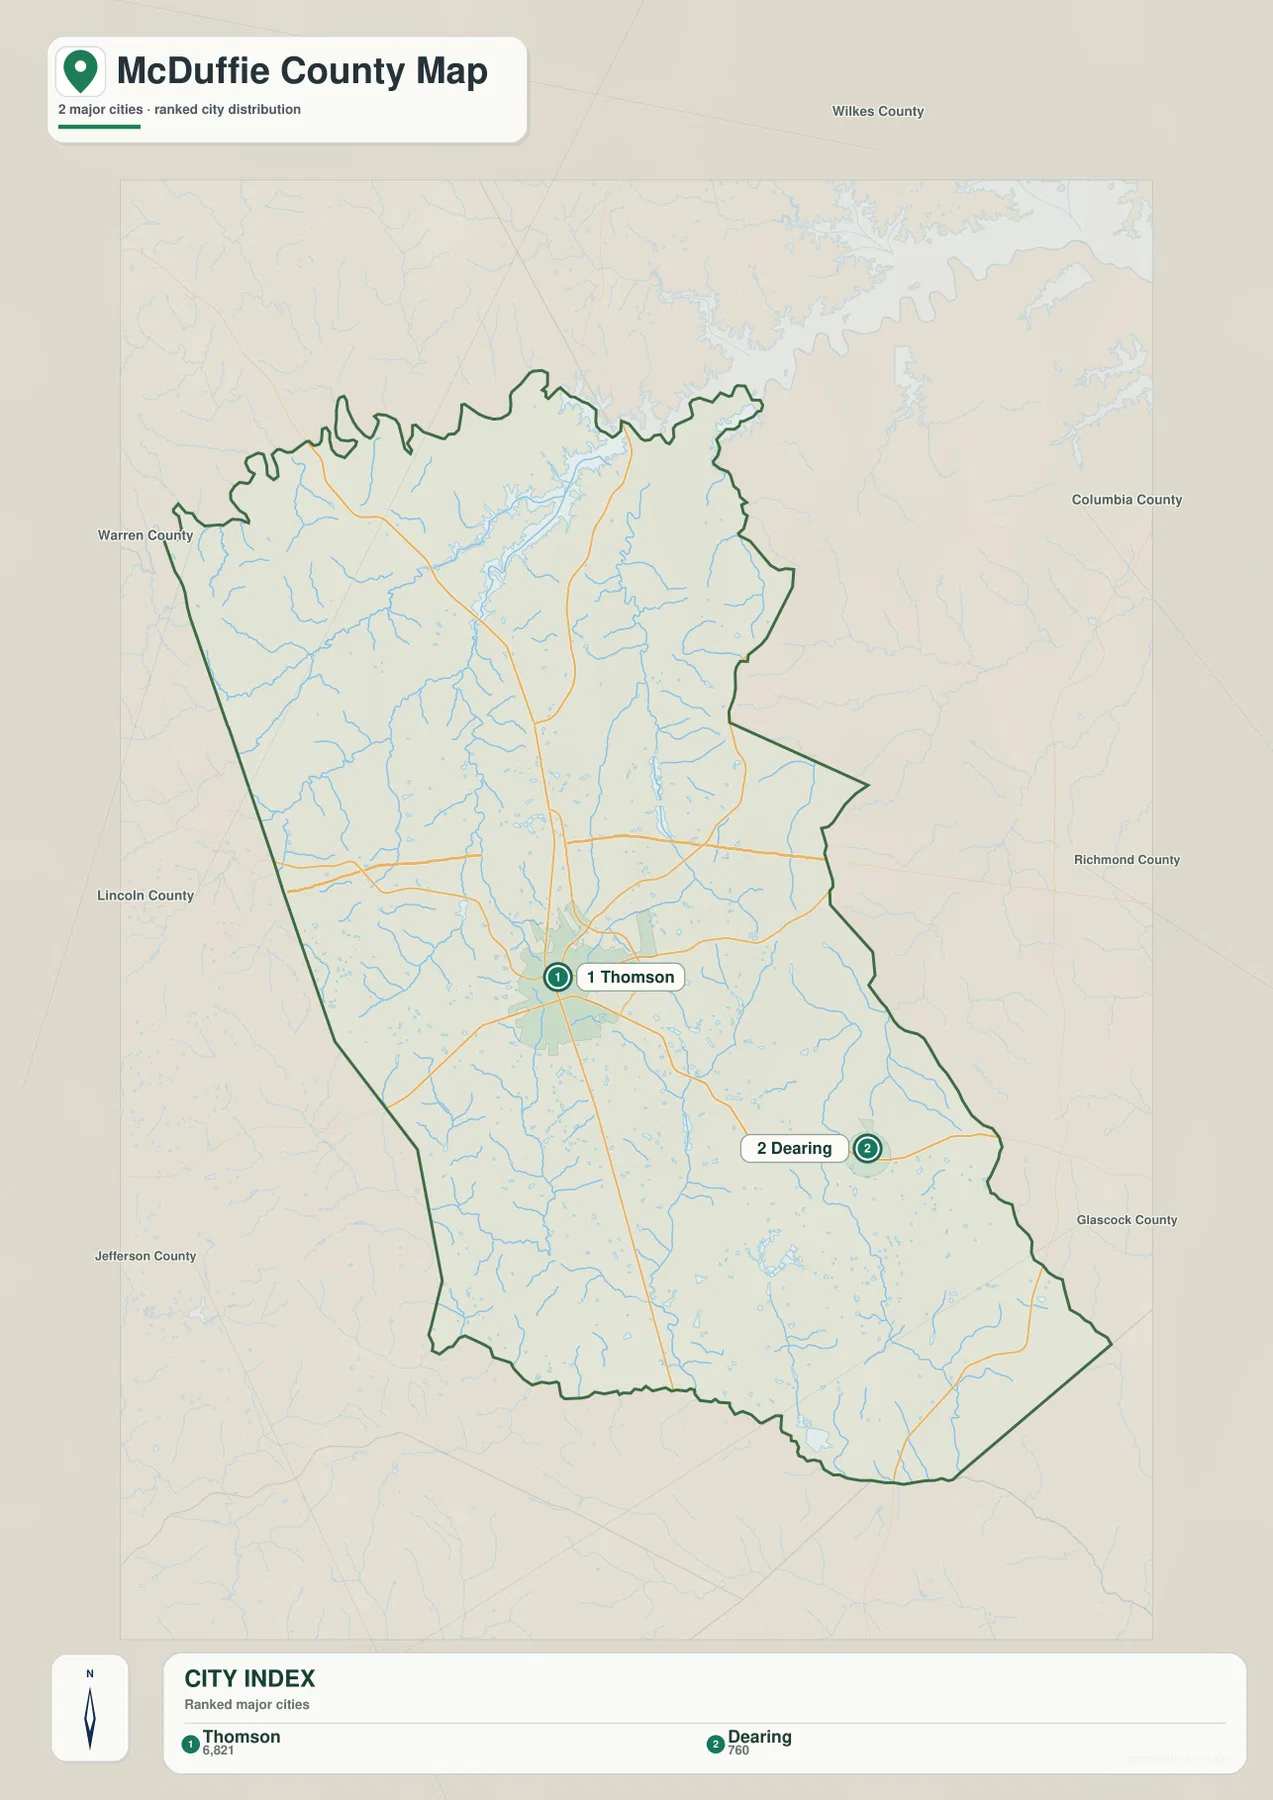
The city-distribution map intentionally removes much of the general map’s detail. It lists two major cities, with Thomson ranked first and Dearing second. The CITY INDEX at the bottom displays 6,821 beside Thomson and 760 beside Dearing. Because the map itself does not state the statistical year or source for those two figures, they are safest to use as values printed on this specific city graphic rather than as a claim about the latest population. Current population research should use a current Census source.
Thomson sits well inside the county boundary, while Dearing is positioned closer to the eastern side. The city layer does not draw a connector line or provide a straight-line distance between them, so it should not be used to estimate travel mileage or driving time. Its real strength is simpler: it makes the settlement pattern easy to see without the heavier road labels, allowing readers to recognize that the two ranked cities are not evenly spaced across the full county.
Seven surrounding county names are visible around the outline: Wilkes County to the north, Columbia and Richmond Counties toward the east and northeast, Glascock County to the southeast, Jefferson County to the southwest, and Lincoln and Warren Counties along the western side. These labels help place Thomson and Dearing within the wider part of Georgia. Dearing is visibly closer to the eastern edge, while Thomson is more central to the county’s road network.
Little River and a branching creek network shape the water map
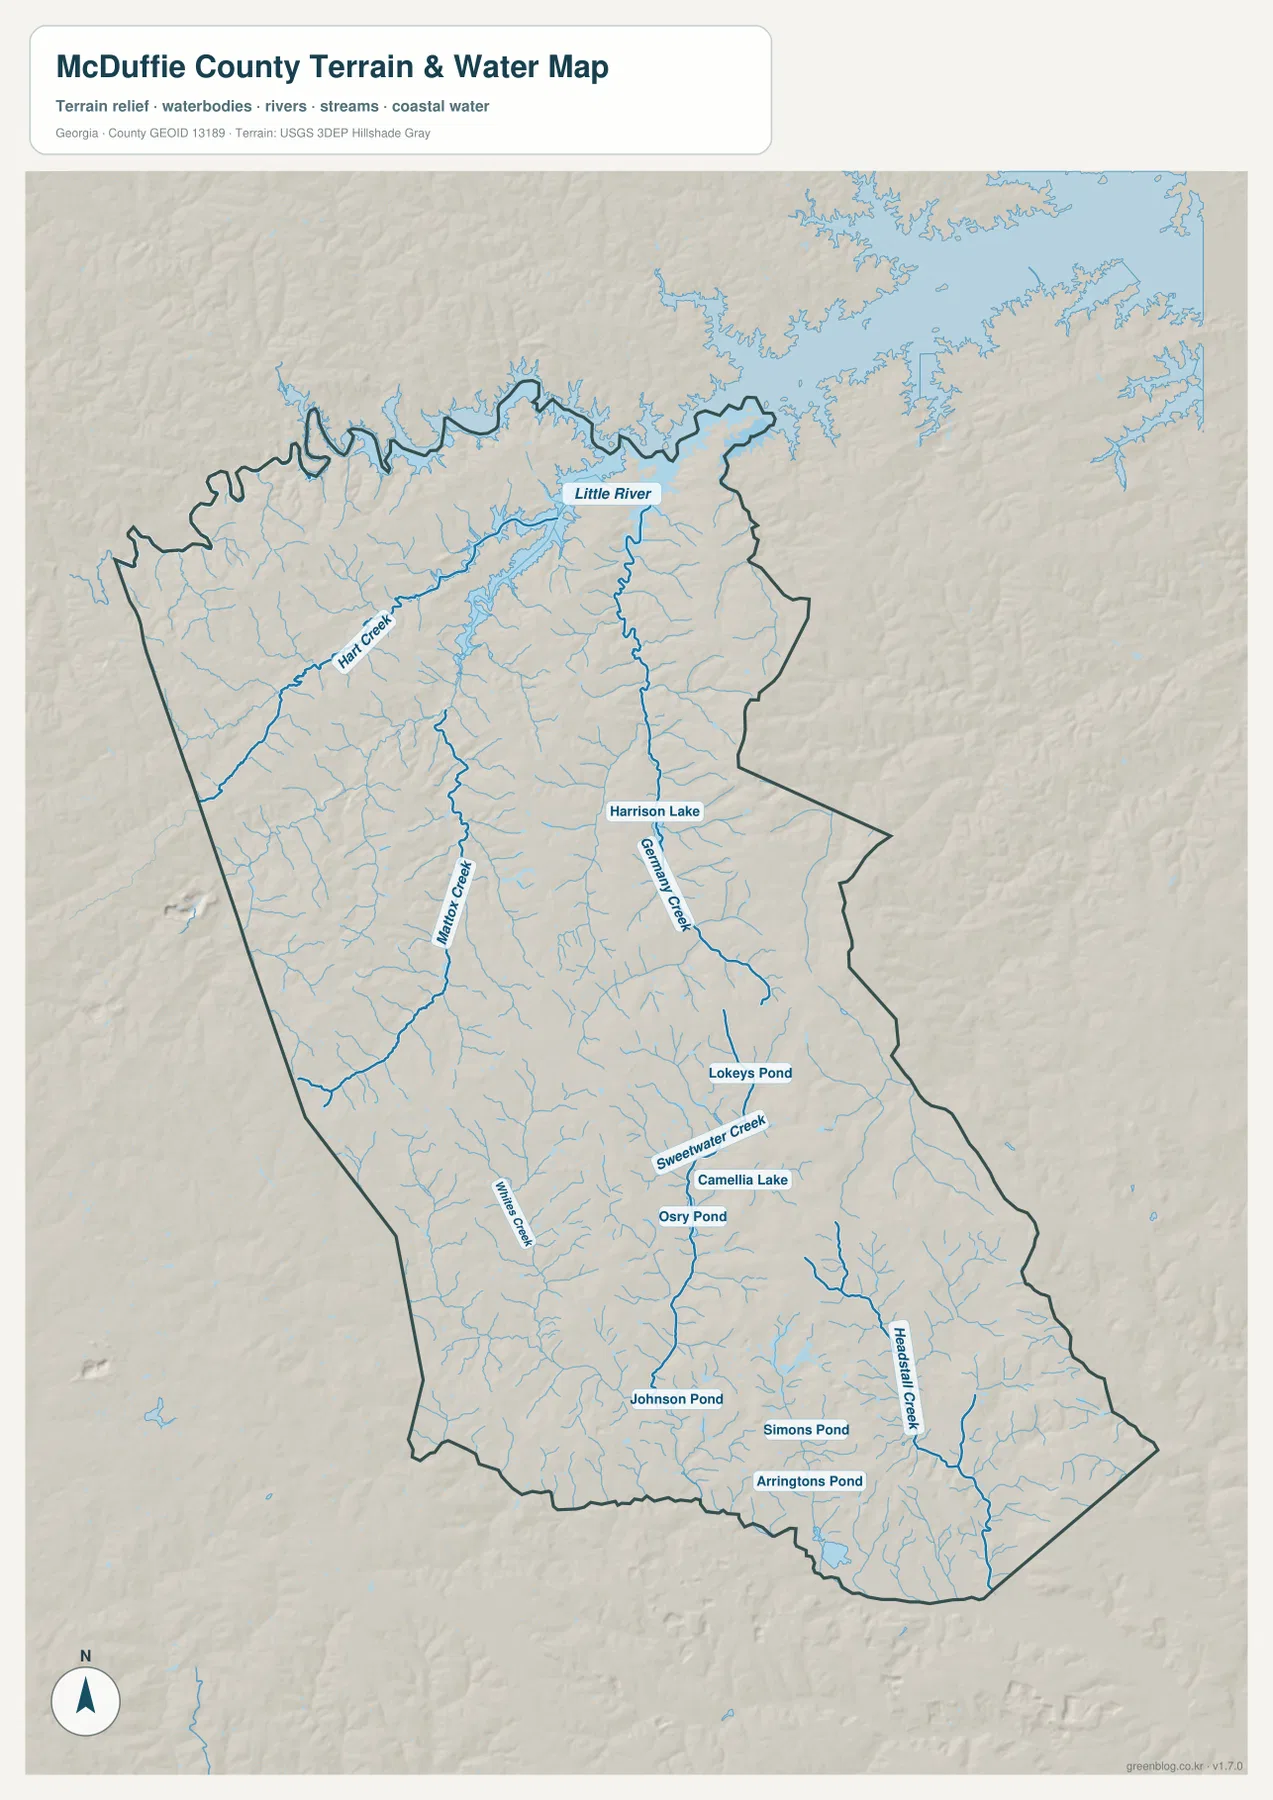
The water layer changes the visual emphasis completely. Little River is labeled across the northern portion of the county, where a broad network of tributaries approaches the river. Hart Creek runs through the northwestern interior, Milner Creek is labeled farther south and west of center, and Germany Creek occupies the central-eastern side near Harrison Lake. These named channels are supported by many smaller blue tributaries, so the northern half appears much more finely divided than it does on the road map.
The central and southern portions contain several smaller water bodies and additional creeks. Lokeys Pond sits near Sweetwater Creek, with Camellia Lake and Osry Pond nearby. White Creek is labeled farther south, and Johnson Pond, Simons Pond, and Arringtons Pond provide other local water references. In the southeastern part of the county, Headsall Creek forms one of the more prominent named channels before continuing toward the lower boundary.
The overall impression is not of one large river dividing the county in half. Instead, Little River forms an important northern reference while multiple creeks occupy separate valleys across the interior and south. This water map is useful for locating those waterways and seeing how tributaries connect, but it is not a flood-hazard, parcel, legal-boundary, or navigation product. Flood probabilities, regulatory floodplains, water depth, and property boundaries require separate official sources.
An 85–185 meter elevation range reveals ridges between narrow stream valleys
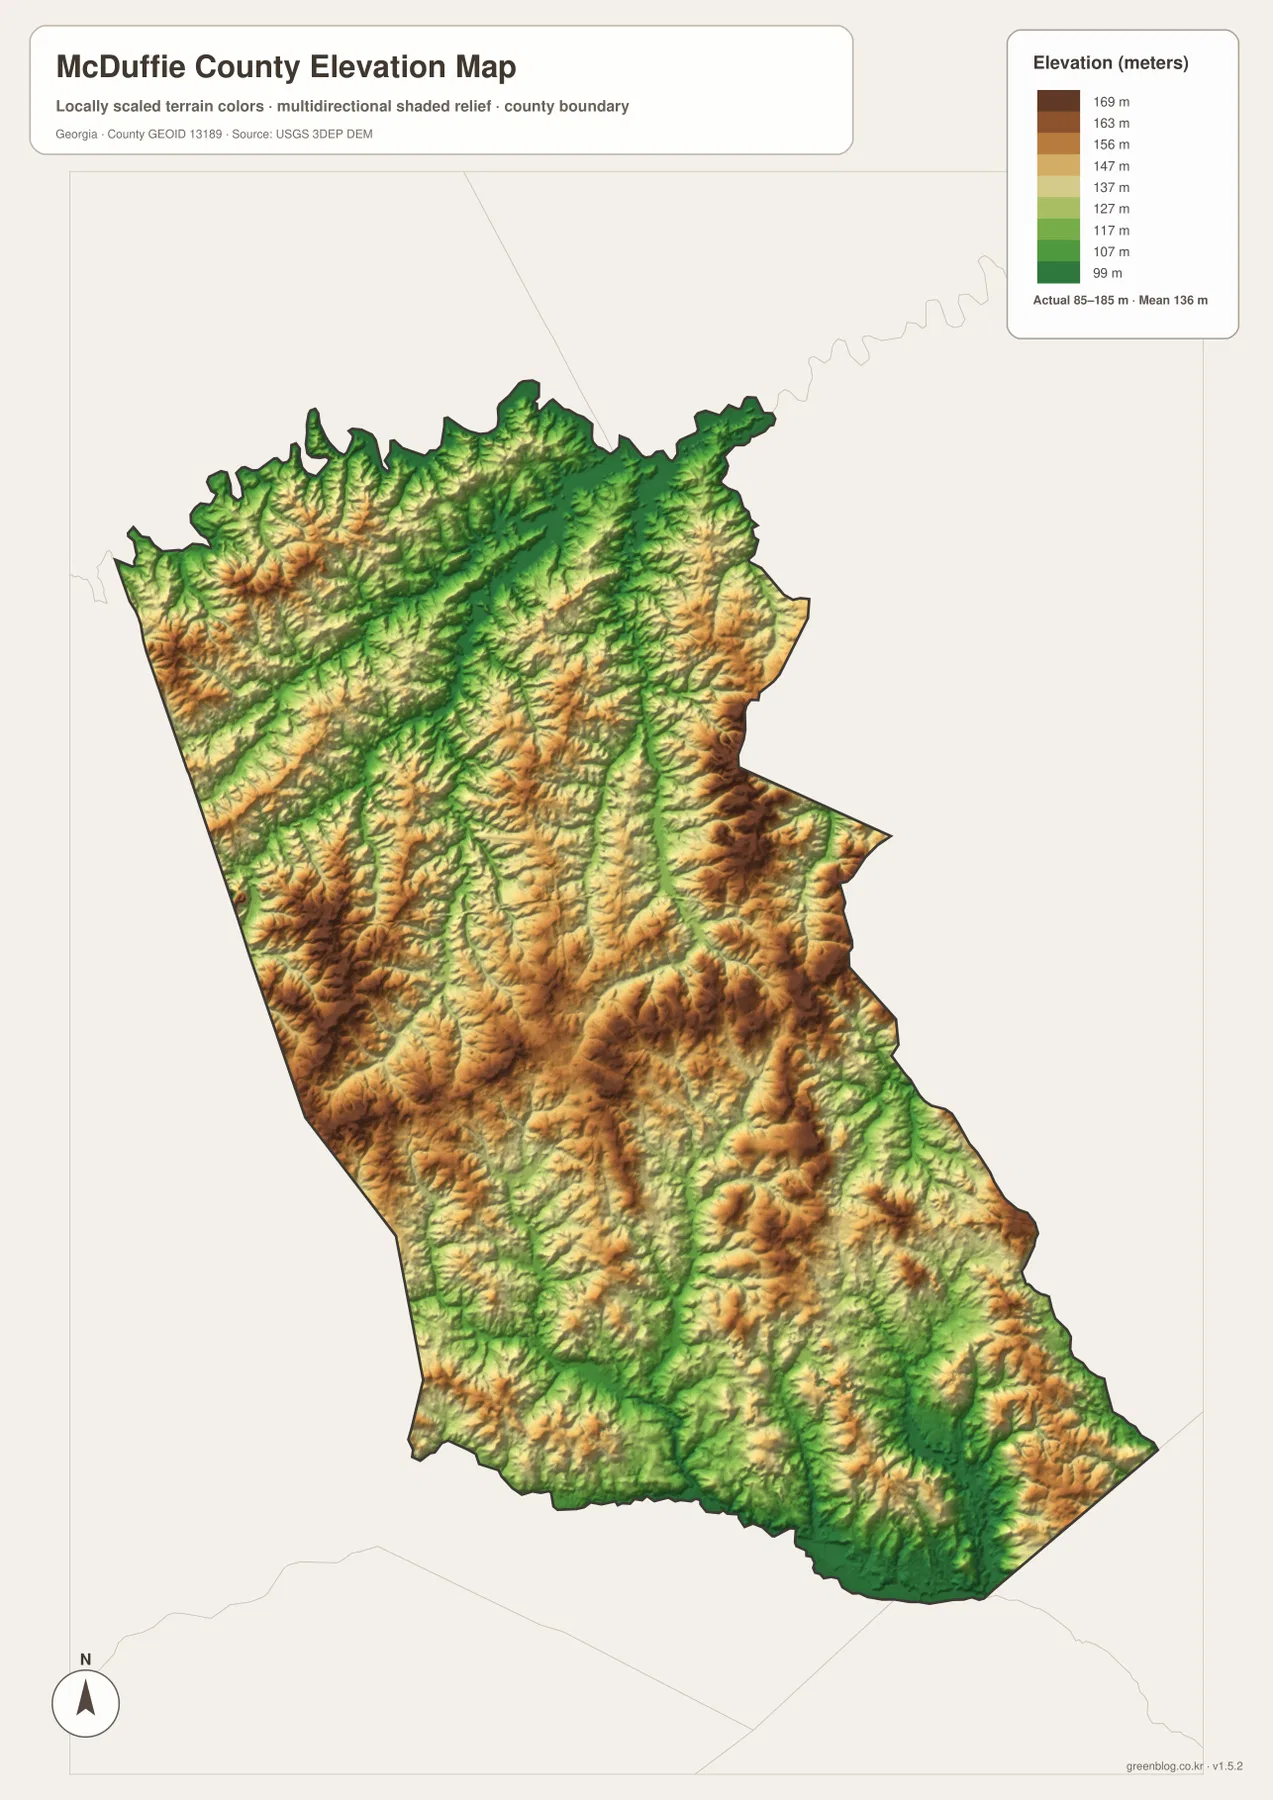
The elevation map reports an actual displayed range of about 85 to 185 meters and a mean elevation near 136 meters. That range does not make McDuffie County mountainous, but the shaded relief shows that the surface is far from flat. Higher brown and orange ridges appear in the northwest, northeast, central east, and scattered parts of the southern half. Between them, narrow green corridors form long low areas that resemble a network of fingers reaching through the county.
Those green corridors make more sense when compared with the water map. Low terrain follows many of the same general paths as Little River tributaries, Hart Creek, Milner Creek, Germany Creek, Sweetwater Creek, and the smaller channels in the south. Rather than sloping evenly from one edge to another, the county is broken into repeated ridges and creek valleys. That repeated relief is one reason the hydrography appears so dense when the blue water lines are emphasized.
The color ramp is locally scaled for comparison within McDuffie County. It is useful for recognizing higher and lower terrain, but it should not be treated as a survey-grade elevation for an individual house lot, road project, or construction site. Detailed engineering or property work requires more precise elevation data and on-site measurement. For ordinary county geography, however, the map clearly shows where the major low corridors and higher ridges are concentrated.
Roads, water, and relief explain why Thomson is such a useful reference point
Thomson looks like a transportation center on the general map because several important road corridors meet around it. On the water map, however, the same central part of the county is crossed and surrounded by numerous small tributaries. The elevation layer adds a third piece of information: those waterways occupy lower corridors between higher ridges. Taken together, the maps show that Thomson is not sitting in a featureless flat plain but within a rolling landscape broken by many small drainage valleys.
Dearing provides a useful contrast. It lies farther east, closer to the county edge, and is much smaller in the city index. The general map still gives it a clear place label, while the water and elevation views show that the eastern side contains its own set of creeks, low corridors, and higher ridges. The different maps therefore help separate settlement importance from physical geography: a place can be small in the city ranking while still sitting within a complex local terrain.
The current county material states that McDuffie County was established in 1870 and identifies Interstate 20, rail history, manufacturing, agriculture, and historic Wrightsboro as parts of local context. Those points help explain the county beyond the map, but the downloadable files are not designed as an industrial, historical-site, or tourism inventory. If a specific historic place or facility is the destination, use the county maps for broad orientation and then consult the relevant local or official site for detailed directions.
Choose the layer that matches the feature you need to find
Use the general county map when you need Thomson, Dearing, major numbered roads, the county outline, and selected surrounding places in one view. The city map is faster when the only goal is to compare the two ranked cities and see where they sit inside the boundary. For Little River, Germany Creek, Sweetwater Creek, ponds, and tributaries, the water layer is far more informative. When the question is why those streams occupy certain corridors, the 85–185 meter elevation map provides the clearest answer by showing the lower valleys between higher ridges.
| Map | Best for |
|---|---|
| County map | Thomson, Dearing, numbered roads, boundary, selected landmarks, and regional orientation |
| City map | Ranked positions of Thomson and Dearing and their placement within the county |
| Water map | Little River, named creeks, ponds, lakes, and branching tributaries |
| Elevation map | About 85–185 m of relief, higher ridges, and lower creek valleys |
The WEBP images on the page are intended for quick browser viewing. For printing, enlargement, or side-by-side comparison, the original JPG files are the better choice. The ZIP below contains four high-resolution A3 JPG maps covering the same county from the county, city, water, and elevation perspectives, so you can keep the complete set together or use only the file that matches your task.
Frequently Asked Questions
What do the 6,821 and 760 values in the city index mean?
They are the values printed beside Thomson and Dearing in the supplied CITY INDEX. Because the map does not state the statistical year or source for those figures, they should not be assumed to represent the latest population. Use a current Census source if you need present-day population data.
Does the water map show flood-risk areas along Little River and the creeks?
No. It is a terrain and water-reference map showing named waterways, ponds, and tributaries. Regulatory floodplains, flood probabilities, water depths, and legal property boundaries require dedicated official sources.
Can the 85–185 meter elevation map be used for site surveying?
No. The map is useful for county-scale comparison of higher ridges and lower valleys, but it is not a survey-grade measurement for a specific parcel or construction point. Detailed site work requires more precise elevation data and field measurement.
Sources for McDuffie County, boundaries, water, and elevation
County background can be checked through local and Census sources, while federal data pages provide documentation for widely used boundary, hydrography, and elevation datasets relevant to the four map themes.
- Official Thomson–McDuffie County website
- U.S. Census Bureau QuickFacts – McDuffie County, Georgia
- New Georgia Encyclopedia – McDuffie County
- U.S. Census Bureau TIGER/Line Shapefiles
- USGS National Hydrography
- USGS 3D Elevation Program
Map File Information
This ZIP contains high-resolution A3 JPG versions of the McDuffie County county map, city map, water map, and elevation map.
- Included Versions: County, city, water, and elevation
- Included Files: Four high-resolution A3 JPG maps
Related Maps
Green Map creates custom-edited map images using open geographic data sources such as geoBoundaries, Natural Earth, OpenStreetMap, and government open data. These maps are edited visual materials, not raw data files, and are provided for education, documents, presentations, and graphic reference.