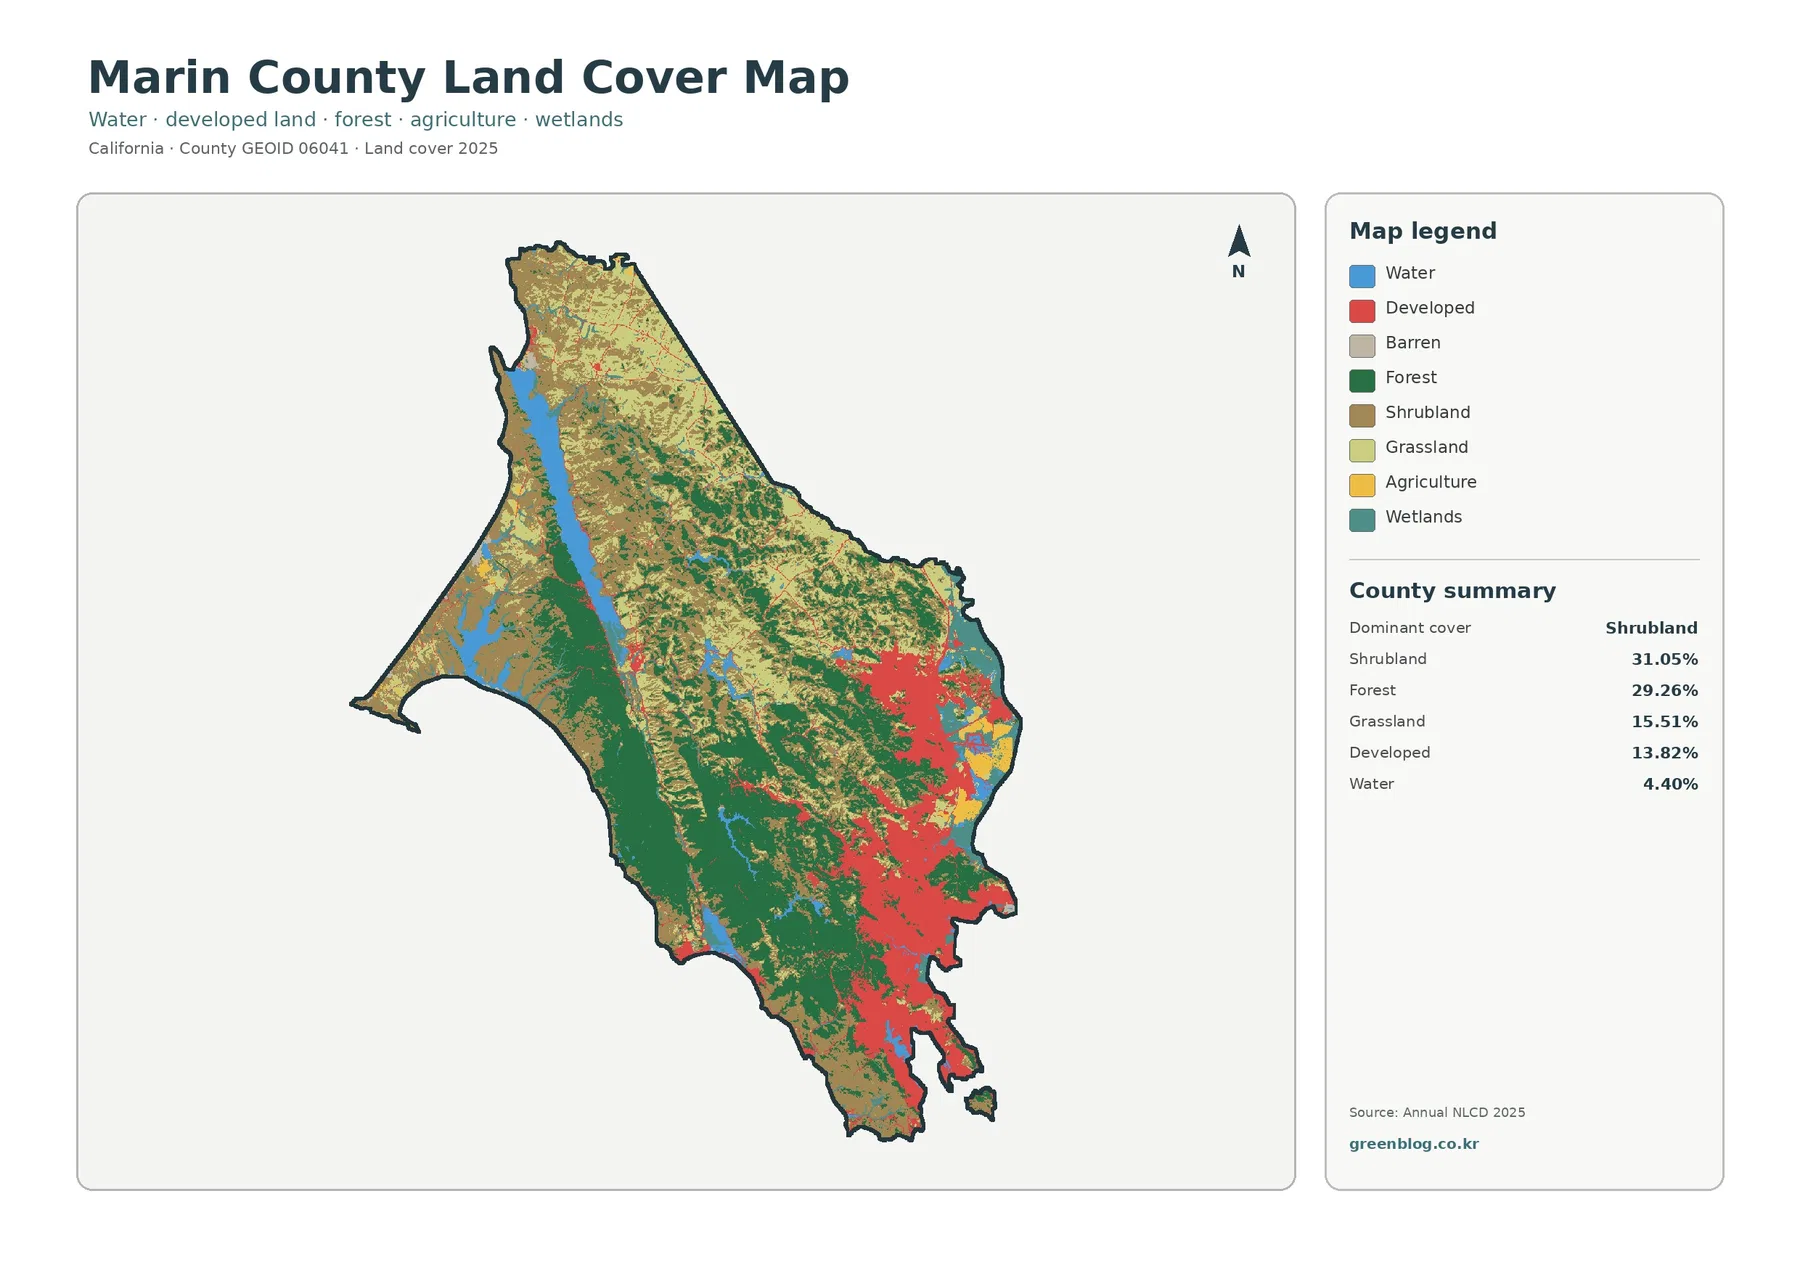
Marin County is close to one of California’s largest urban regions, yet its 2025 land-cover pattern is dominated by shrubland and forest rather than continuous development. The maps on this page make the contrast easy to see: a built-up eastern and southeastern side, broad wooded and open landscapes inland and westward, and the long water feature of Tomales Bay.
The page includes four views: general land cover, forest and farmland, fractional impervious surface, and mapped class differences from 1985 to 2025. Each map can be viewed here as a WebP image, while the four original JPG maps are available together in one download for printing, comparison, classroom use, or reference.
Table of Contents
A bay-side urban corridor beside a much larger open landscape
The strongest developed pattern sits along the eastern and southeastern side of the county. San Rafael and nearby bay-side communities form a dense cluster, and development continues north toward Novato in a more broken network. Farther west, the built surface quickly thins into hills, valleys, ranch landscapes, protected open space, and the Pacific coast.
Tomales Bay provides another strong visual reference. Marin County documents describe it as a roughly 13-mile tidal estuary between the Point Reyes Peninsula and the mainland. On the land-cover map, the narrow blue bay separates neighboring areas with different mixtures of shrubland, grassland, forest, wetland, and small settlements, making it one of the clearest landmarks in the western half of the county.
Shrubland and forest together cover most of the 2025 map
The county summary lists shrubland at 31.05% and forest at 29.26%. Grassland adds another 15.51%, while developed land accounts for 13.82% and water for 4.40%. Those numbers match the visual impression of the map: natural or semi-natural cover occupies most of the county outline even though the developed eastern side is locally dense.
Water and wetlands matter more here than their small-looking map patches suggest
Water represents 4.40% of the county summary, and the forest-and-farmland view separately lists wetlands at 4.32%. Tomales Bay is the largest obvious water shape inside the county outline, but water and wetland colors also occur along the eastern bay margin and in smaller inland locations. These features give Marin a different map texture from an inland county where water appears only in isolated reservoirs or rivers.
The forest-and-farmland view explains a Marin-specific classification issue
The forest-and-farmland map reports forest at 29.26%, shrubland at 31.05%, grassland at 15.51%, wetlands at 4.32%, water at 4.40%, and agriculture at only 1.03%. That low agriculture number can be surprising in a county with a long ranching and agricultural history, but the reason is partly a difference between land cover and land use.
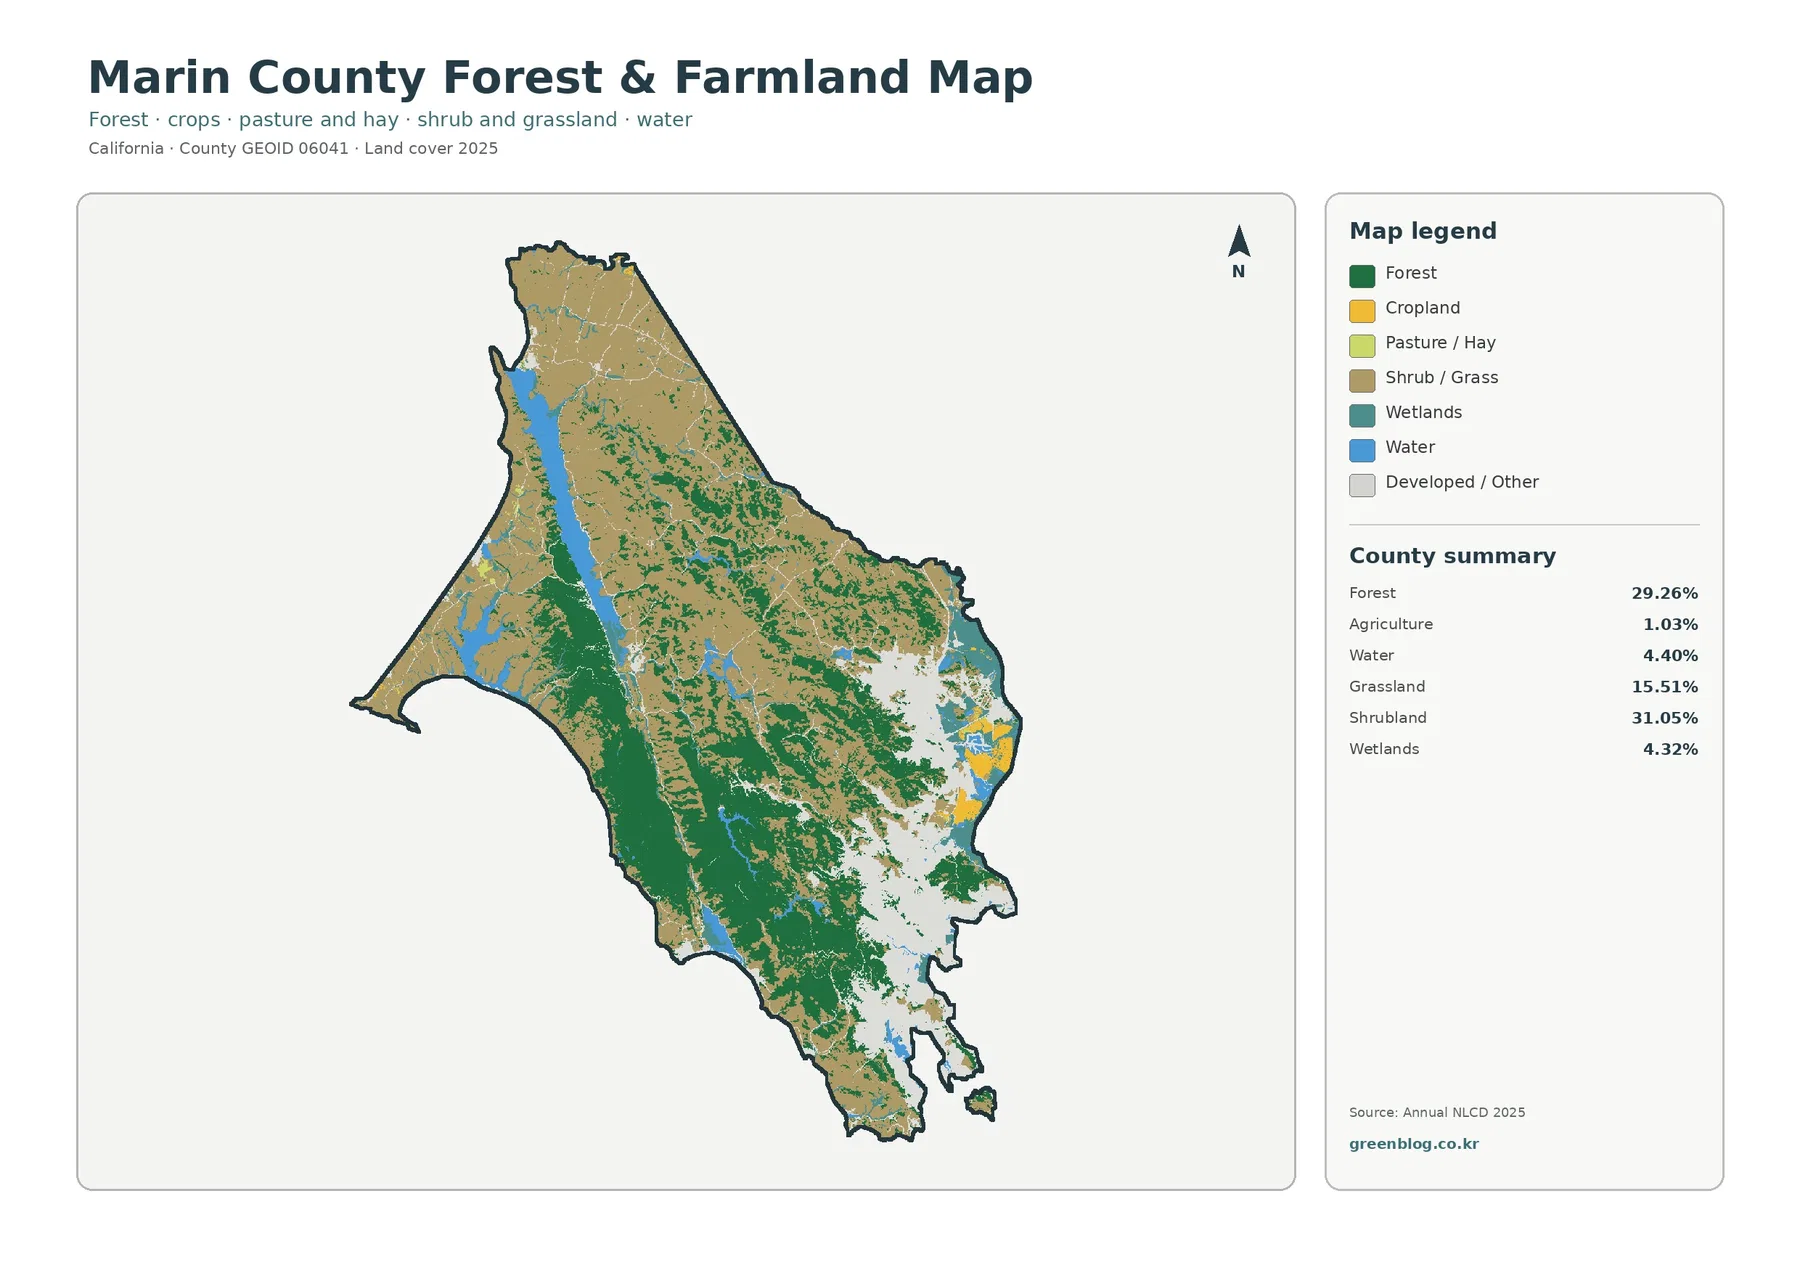
Land used for grazing can still be classified from its surface appearance as grassland or shrubland rather than as a cultivated agricultural class. Marin County’s Agriculture, Weights & Measures department maintains Crop & Livestock Reports dating back to 1935, which is a reminder that an economic or land-use description of agriculture is not interchangeable with the 1.03% mapped-cover value.
Impervious surface isolates the built network much better than the general map
Impervious surface means pavement, rooftops, and similar artificial surfaces that do not readily absorb water. Marin County’s 2025 mean impervious value is 4.76%, and 3.57% of the mapped area is at least 50% impervious. The general land-cover map lists developed cover at 13.82%, so the two percentages are measuring related but different things.
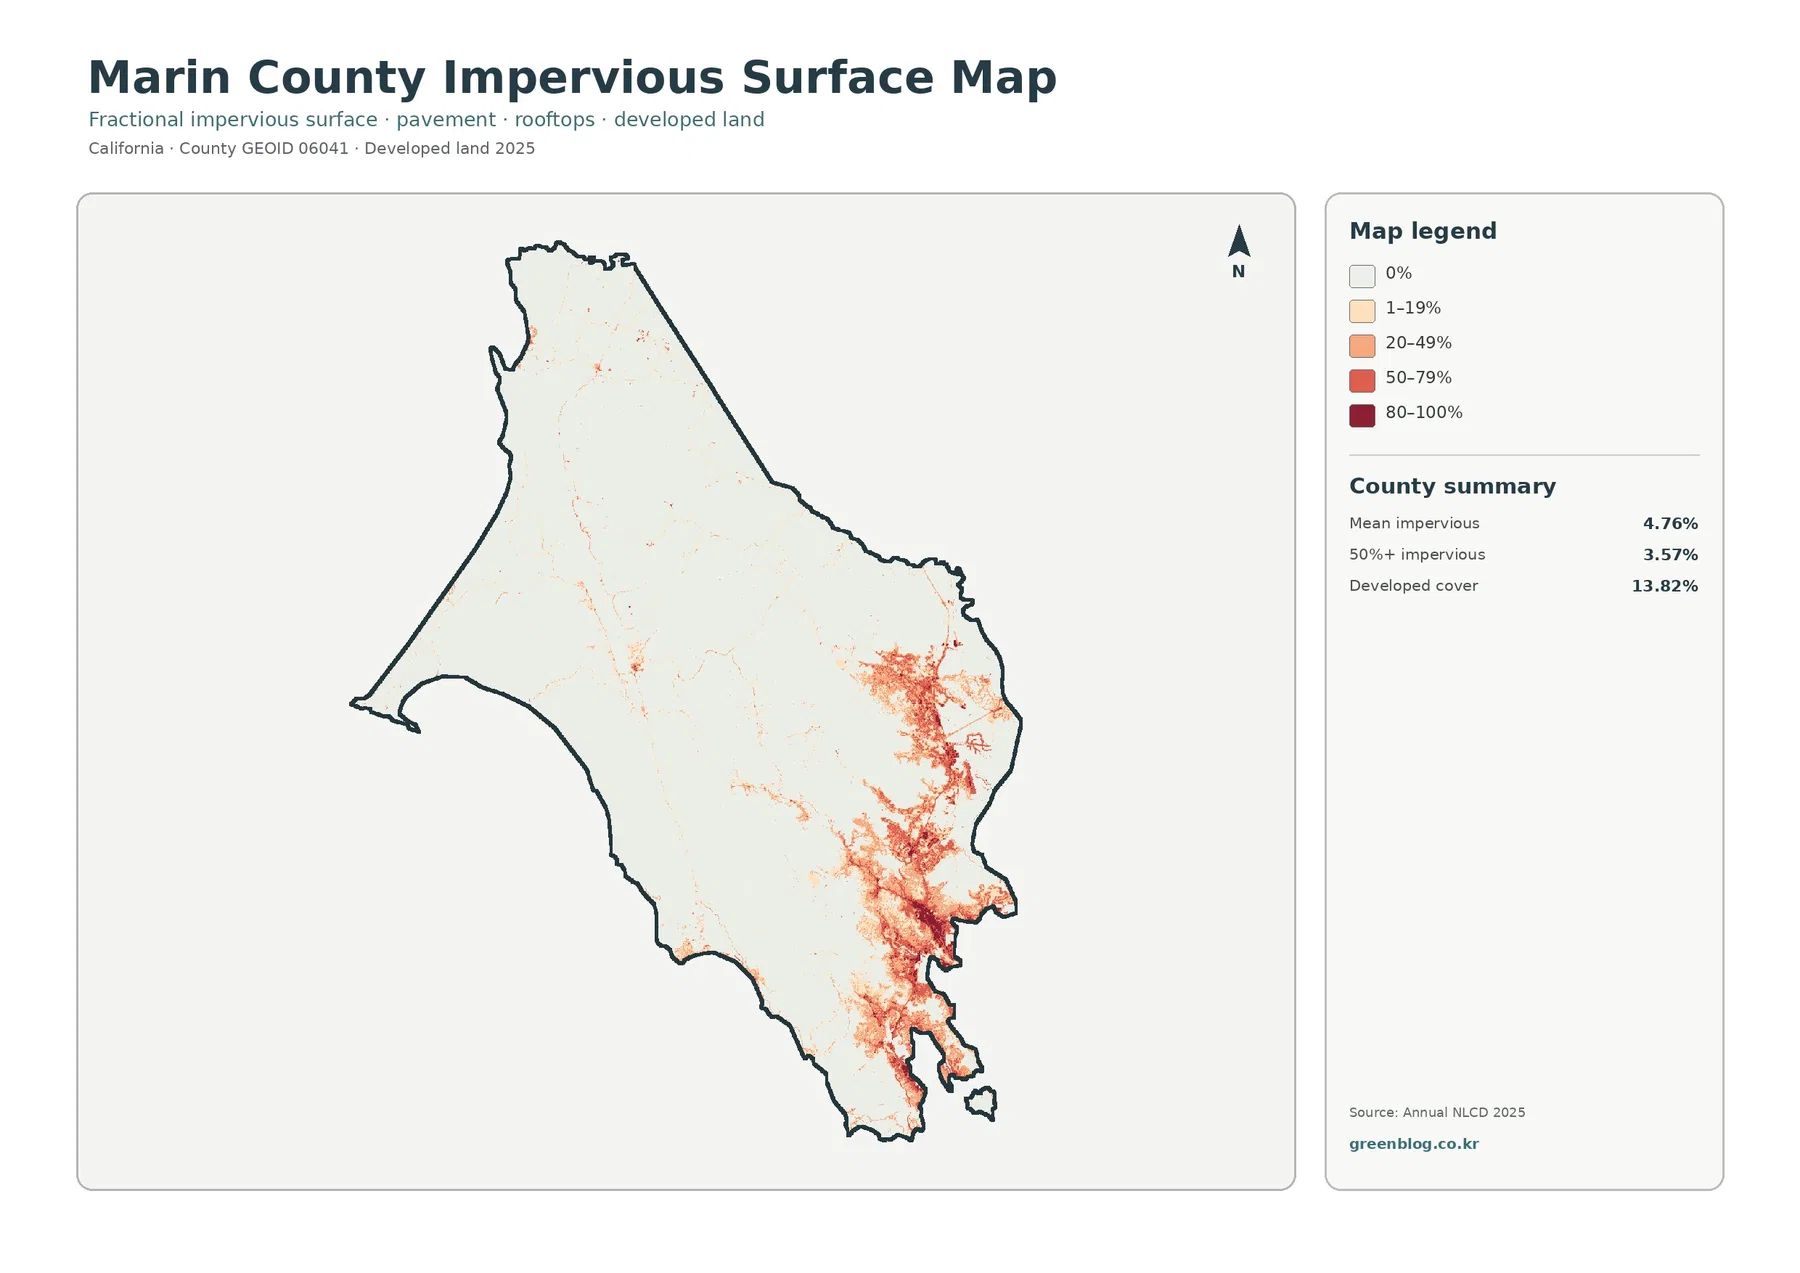
The map strips away much of the vegetation color and makes the settlement pattern unmistakable. Darker values cluster around San Rafael and continue through the southeastern communities, with another developed concentration around Novato. Roads and smaller settlements extend outward as thin lines and small patches, while most of West Marin remains very light.
Most cells keep the same class between 1985 and 2025
The change map reports a class difference across 10.42% of Marin County. Within that total, 1.33% is mapped as changed to developed, 0.73% as forest loss, 0.36% as agricultural loss, and 7.69% as other class difference. The large remainder of the county therefore stays in the no-class-difference background between the two comparison years.
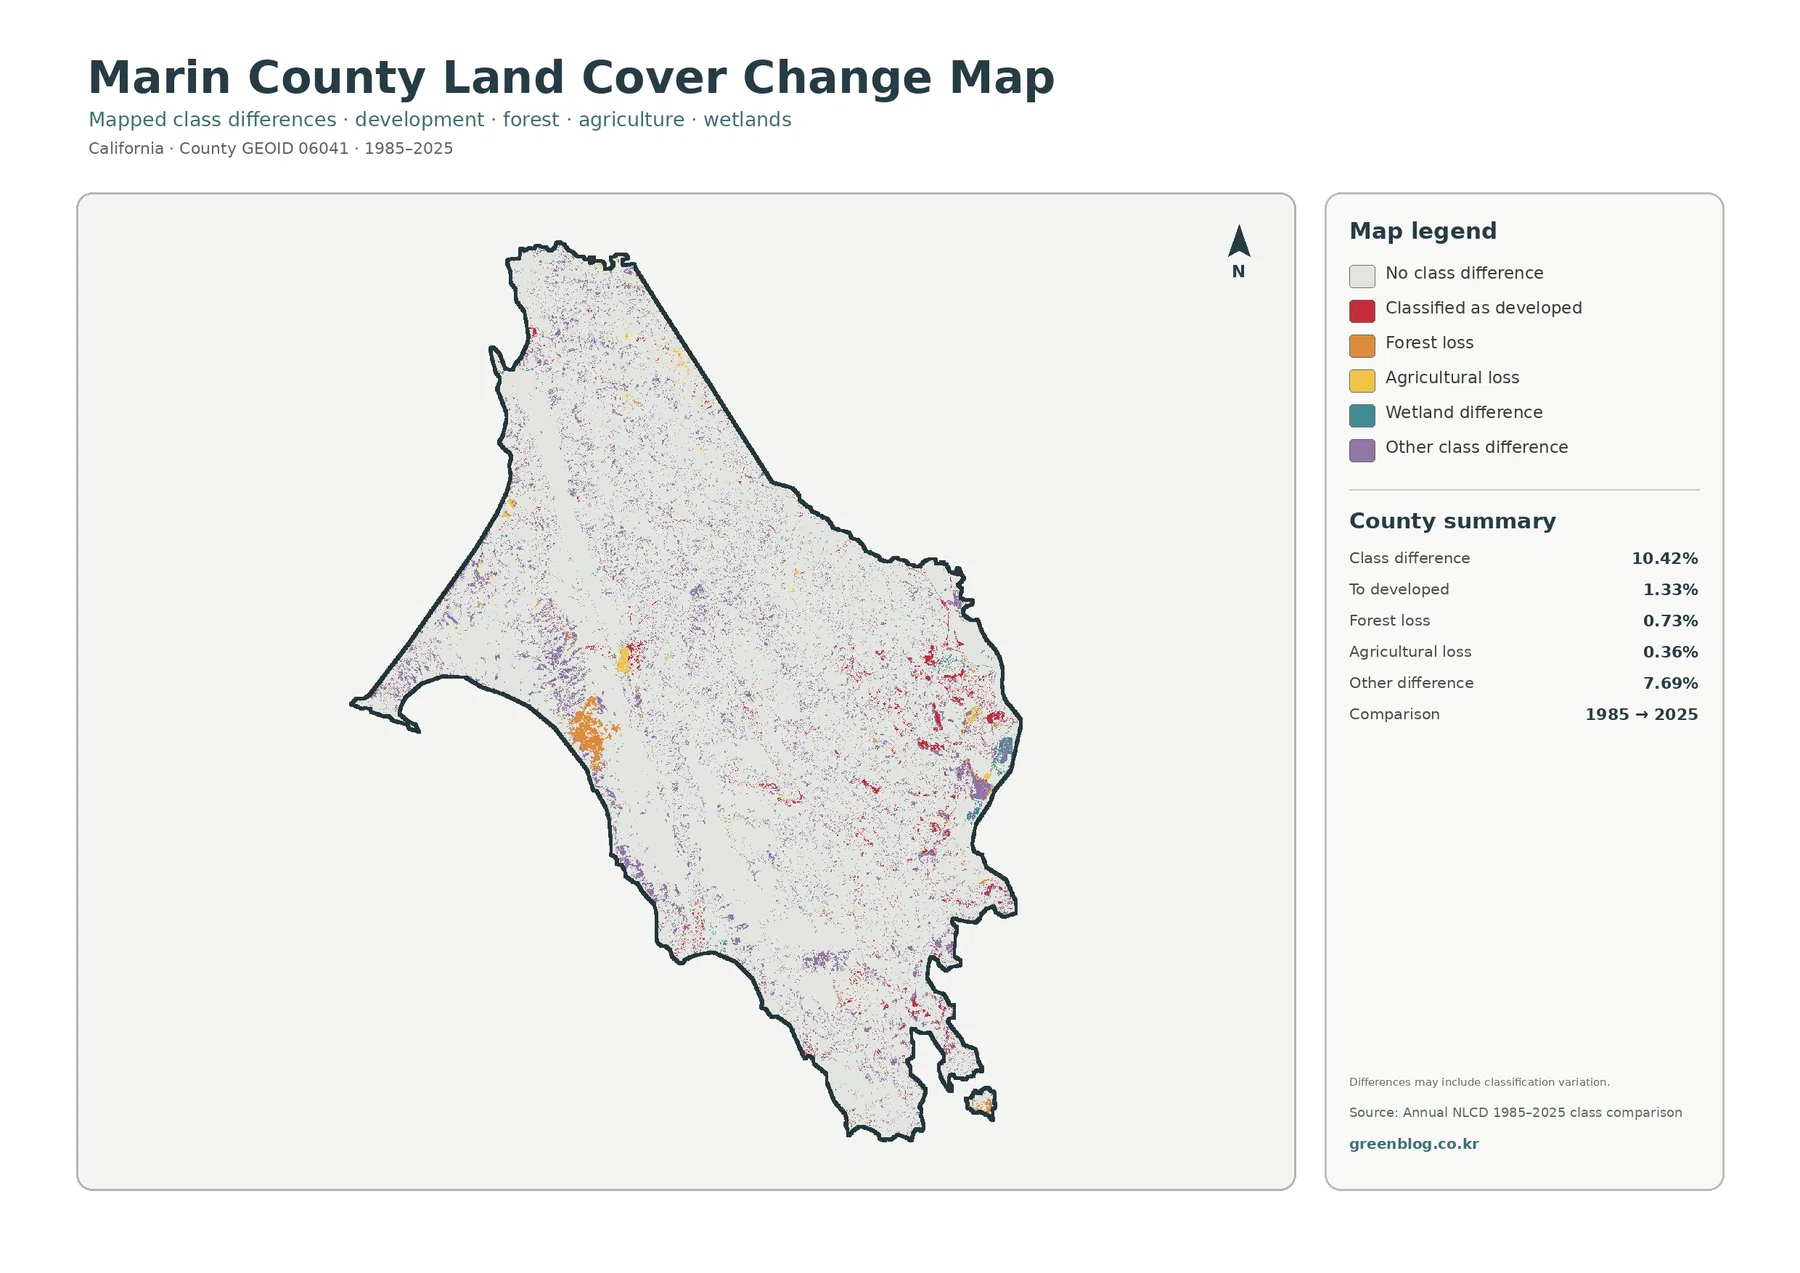
A mapped class difference is not automatically a confirmed event on the ground. Real development, vegetation disturbance, regrowth, agricultural change, or wetland shifts can affect the classification, but satellite observations and classification methods can also create differences between dates. To explain a particular pixel, a user would need additional time-series imagery, local records, or site information.
How to use the four maps without losing the county context
For a classroom comparison, Point Reyes and Tomales Bay can be paired with the San Rafael–Novato side to show how varied one county can be. Environmental presentations can emphasize shrubland, forest, grassland, wetlands, and water, while urban studies can focus on the relationship between developed cover and impervious surface. In each case, using two or more maps prevents a single legend from becoming the whole story.
Map File Information
The download contains the four original JPG maps: general land cover, forest and farmland, impervious surface/developed land, and the 1985–2025 change comparison. Keeping the original files is useful when you want matching map dimensions for side-by-side layouts, offline reference, or insertion into documents without relying on a browser screenshot.
Each JPG is 2480×1754 pixels. That is below the 4961×3508-pixel size normally associated with A3 printing at 300 dpi, so very large prints will require care. The files are well suited to screen use, ordinary documents, teaching materials, and smaller prints where the title, legend, county outline, and major color patterns remain readable.
Land cover is not zoning, ownership, or a parcel survey
A grassland pixel could fall on a ranch, public open space, private property, or another land-use designation. A developed pixel might include homes, shops, schools, roads, or public facilities. Even a change-to-developed pixel does not document a specific permit or identify the date of construction. For property-level questions, use Marin County’s official zoning and property lookup or the appropriate local GIS source.
Thirty-meter cells and observation dates set the map’s practical limit
Annual NLCD Collection 1.2 extends the conterminous U.S. land-cover product through 2025 and uses a 30-meter raster framework. A raster divides the landscape into square cells and assigns a representative value to each cell. When a cell contains trees, pavement, lawn, and a building together, the displayed class is necessarily simpler than the real site.
The date matters just as much as the cell size. The current-cover and impervious maps represent 2025 data, and the change view compares 1985 with 2025. Development, fire, vegetation recovery, flooding, shoreline change, or construction after the observation year is not reflected. When a current decision depends on recent conditions, pair these maps with newer imagery or official local data.
Frequently Asked Questions
Why does the map show only 1.03% agriculture in a county known for ranching?
The 1.03% figure is an NLCD land-cover value, not a measure of agricultural land use or the agricultural economy. Grazed land may appear as grassland or shrubland based on the observed surface. Marin County’s crop and livestock records should be used for agricultural activity, while this map should be used for surface-cover comparison.
Can I use the developed and impervious maps to identify a Marin County parcel?
No. The maps show generalized 30-meter cells and do not contain parcel lines, zoning, ownership, or exact city boundaries. They are useful for seeing where built surfaces cluster, but property-level questions should be checked with Marin County’s official zoning and property information tools.
Map File Information
The ZIP includes all four original JPG land-cover maps for Marin County.
- Included Files: Use only the versions confirmed in the article and supplied images
- File Type: Use the confirmed download contents
- Intended Use: Printing, education, presentations, and map-based projects
Related Maps
- Alameda County California Land Cover Map
- Alpine County California Land Cover Map
- Amador County California Land Cover Map
Sources and References
- MRLC Annual NLCD Data — current Annual NLCD Collection 1.2 land-cover and impervious products
- MRLC Annual NLCD Project — product coverage from 1985 through 2025 and descriptions of land-cover, change, and impervious datasets
- Marin County Agriculture — county agricultural programs and the Crop & Livestock Report archive
- Marin Countywide Plan — official land-use and development policy context
- Tomales Bay Living Shorelines Feasibility Study — county reference describing the location and roughly 13-mile tidal-estuary form of Tomales Bay
Green Map creates custom-edited map images using open geographic data sources such as geoBoundaries, Natural Earth, OpenStreetMap, and government open data.
These maps are edited visual materials, not raw data files, and are provided for education, documents, presentations, and graphic reference.