The Inyo County California Land Cover Map is dominated by a pattern that is unusual compared with many more developed California counties: shrubland covers 81.24% of the mapped area, while barren land accounts for another 12.74%. Forest is concentrated in much smaller mountain areas, and agriculture, wetlands, water, and development appear as narrow or isolated patches. The four maps on this page make those contrasts easier to compare across a very large county.
Visitors can view general land cover, forest and farmland, impervious surface and developed land, and a 1985–2025 land cover change comparison. The four original JPG maps are also available together in one ZIP download below. Land cover is a classification of the surface seen in satellite-based data. It should not be read as zoning, parcel ownership, legal land use, or permission to develop a particular site.
Table of Contents
The countywide pattern begins with 81.24% shrubland
The general 2025 land cover map is visually dominated by the tan shrubland class. It covers most of the broad eastern and southeastern interior and continues through large parts of the north. The county summary reports shrubland at 81.24%, so the statistic matches the first impression of the map. This is not a statement that every shrub-covered cell has the same plants or management history. It simply means those cells fall into the shrubland category used by the supplied land cover dataset.
Barren cover is the next largest class at 12.74%. Pale gray areas form irregular bands and patches through mountain and desert terrain, especially away from the greener western edge. On this map, “barren” is a land cover class rather than missing information. It can include sparsely vegetated rock, gravel, dry surfaces, and similar ground where plant cover is limited. Because Inyo County contains both high mountain terrain and very dry basins, one broad barren class can represent several visibly different landscapes on the ground.
Forest occupies just 3.42% of the county, but its green pattern is geographically distinct. The strongest forest concentrations appear along portions of the western mountain side and in scattered higher-elevation patches farther north and toward the center. California Department of Fish and Wildlife describes Owens Valley as lying between the Sierra Nevada on the west and the White and Inyo Mountains on the east. That verified setting helps explain why the western side of the map deserves separate attention from the shrub-dominated interior, even though the map itself does not label every mountain range.
Grassland at 0.91% and wetlands at 0.82% occupy small countywide shares. Their colors are still useful because they occur in places where the surrounding surface is mostly shrubland or barren. Narrow wetland or grass patches can stand out clearly even when they represent less than one percent of the county. Small springs, stream edges, and wet areas may be generalized by a roughly 30-meter raster grid, so these colors are useful for orientation rather than legal wetland delineation.
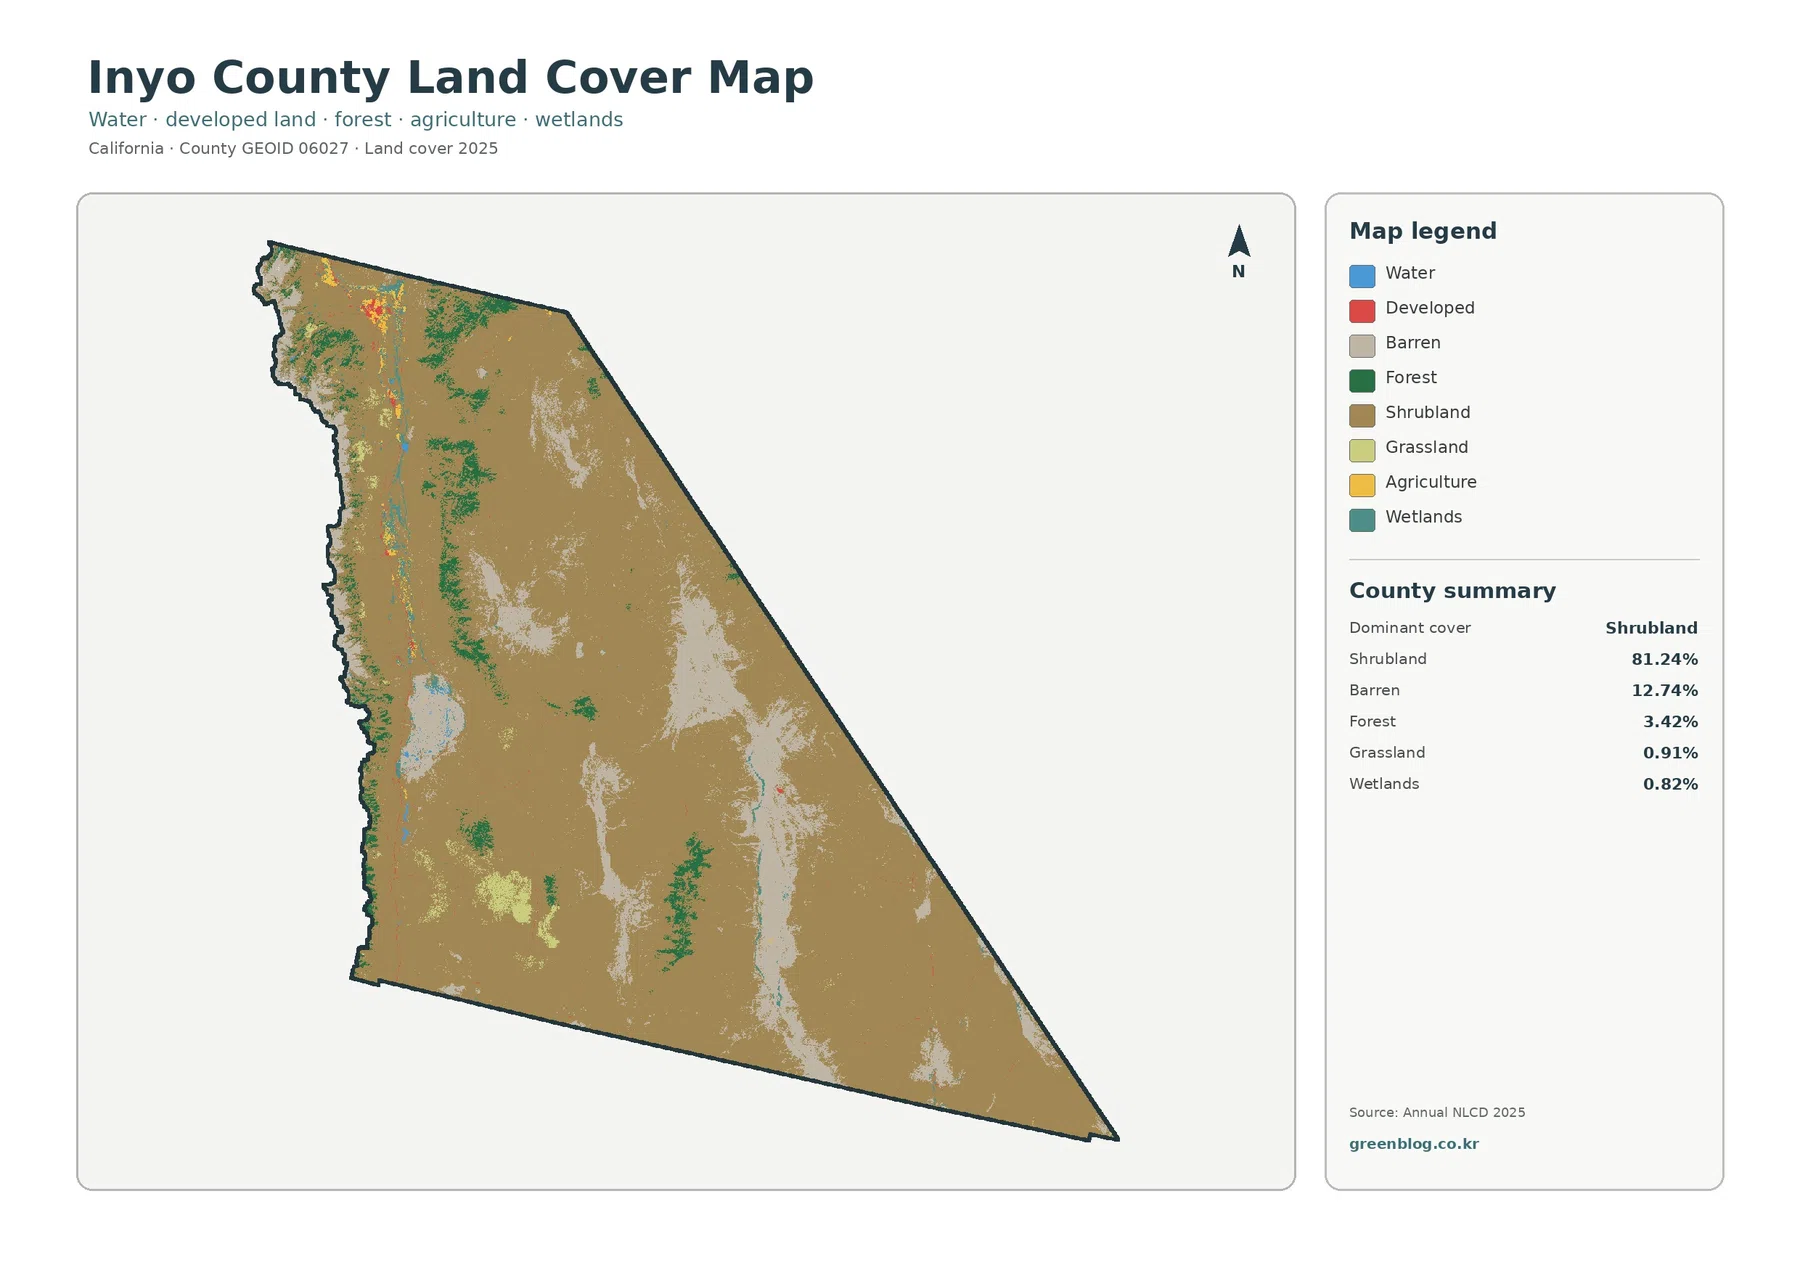
A good way to read this image is to separate the dry classes first. Tan shrubland and pale barren land are both common in arid country, but they are not interchangeable. After that distinction is clear, the smaller green forest patches and the narrow water, wetland, agricultural, and developed areas become easier to find. This sequence highlights Inyo County’s large contrast between broad desert surfaces and the smaller places where vegetation or human development is more concentrated.
Owens Valley creates a narrow strip of more varied cover
The forest and farmland map simplifies the legend and makes the western valley pattern easier to follow. Shrubland remains dominant at 81.24%, while forest is 3.42%, agriculture 0.40%, grassland 0.91%, wetlands 0.82%, and water 0.10%. Agriculture and water are tiny in countywide percentage terms, but they are not evenly scattered. They appear in relatively narrow areas rather than across the broad shrub-covered desert.
Owens Valley provides useful geographic context for that narrow pattern. California Department of Fish and Wildlife describes the valley as a north-south feature in Inyo County, bounded by the Sierra Nevada on the west and the White and Inyo Mountains on the east. The supplied map shows a similar north-south zone near the western part of the county where forest, wetland, water, agriculture, and developed/other colors occur more frequently than in the broad interior. The map establishes the spatial contrast; the official state source supplies the geographic name and setting.
Agriculture accounts for only 0.40%, and most of the yellow map marks are small. The more noticeable agricultural and developed patches occur toward the northwest and in a few places along the western valley corridor. This should not be converted directly into farm acreage or production statistics. The map identifies cells classified as agricultural cover in 2025. Crop type, irrigated acreage, fallow land, grazing use, and agricultural preservation status require different datasets.
Water at 0.10% and wetlands at 0.82% also look minor in the summary, yet local water features are visually important in such a dry county. A larger light blue and wetland-colored area appears in the western south-central portion of the map near the Owens Lake region. California Department of Fish and Wildlife documents freshwater wetlands and springs at the Cartago Wildlife Area on the southwest shore of Owens Dry Lake. That local source confirms that wetland and aquatic habitats occur in this part of Inyo County, though the land cover image should not be used to trace their exact legal boundaries.
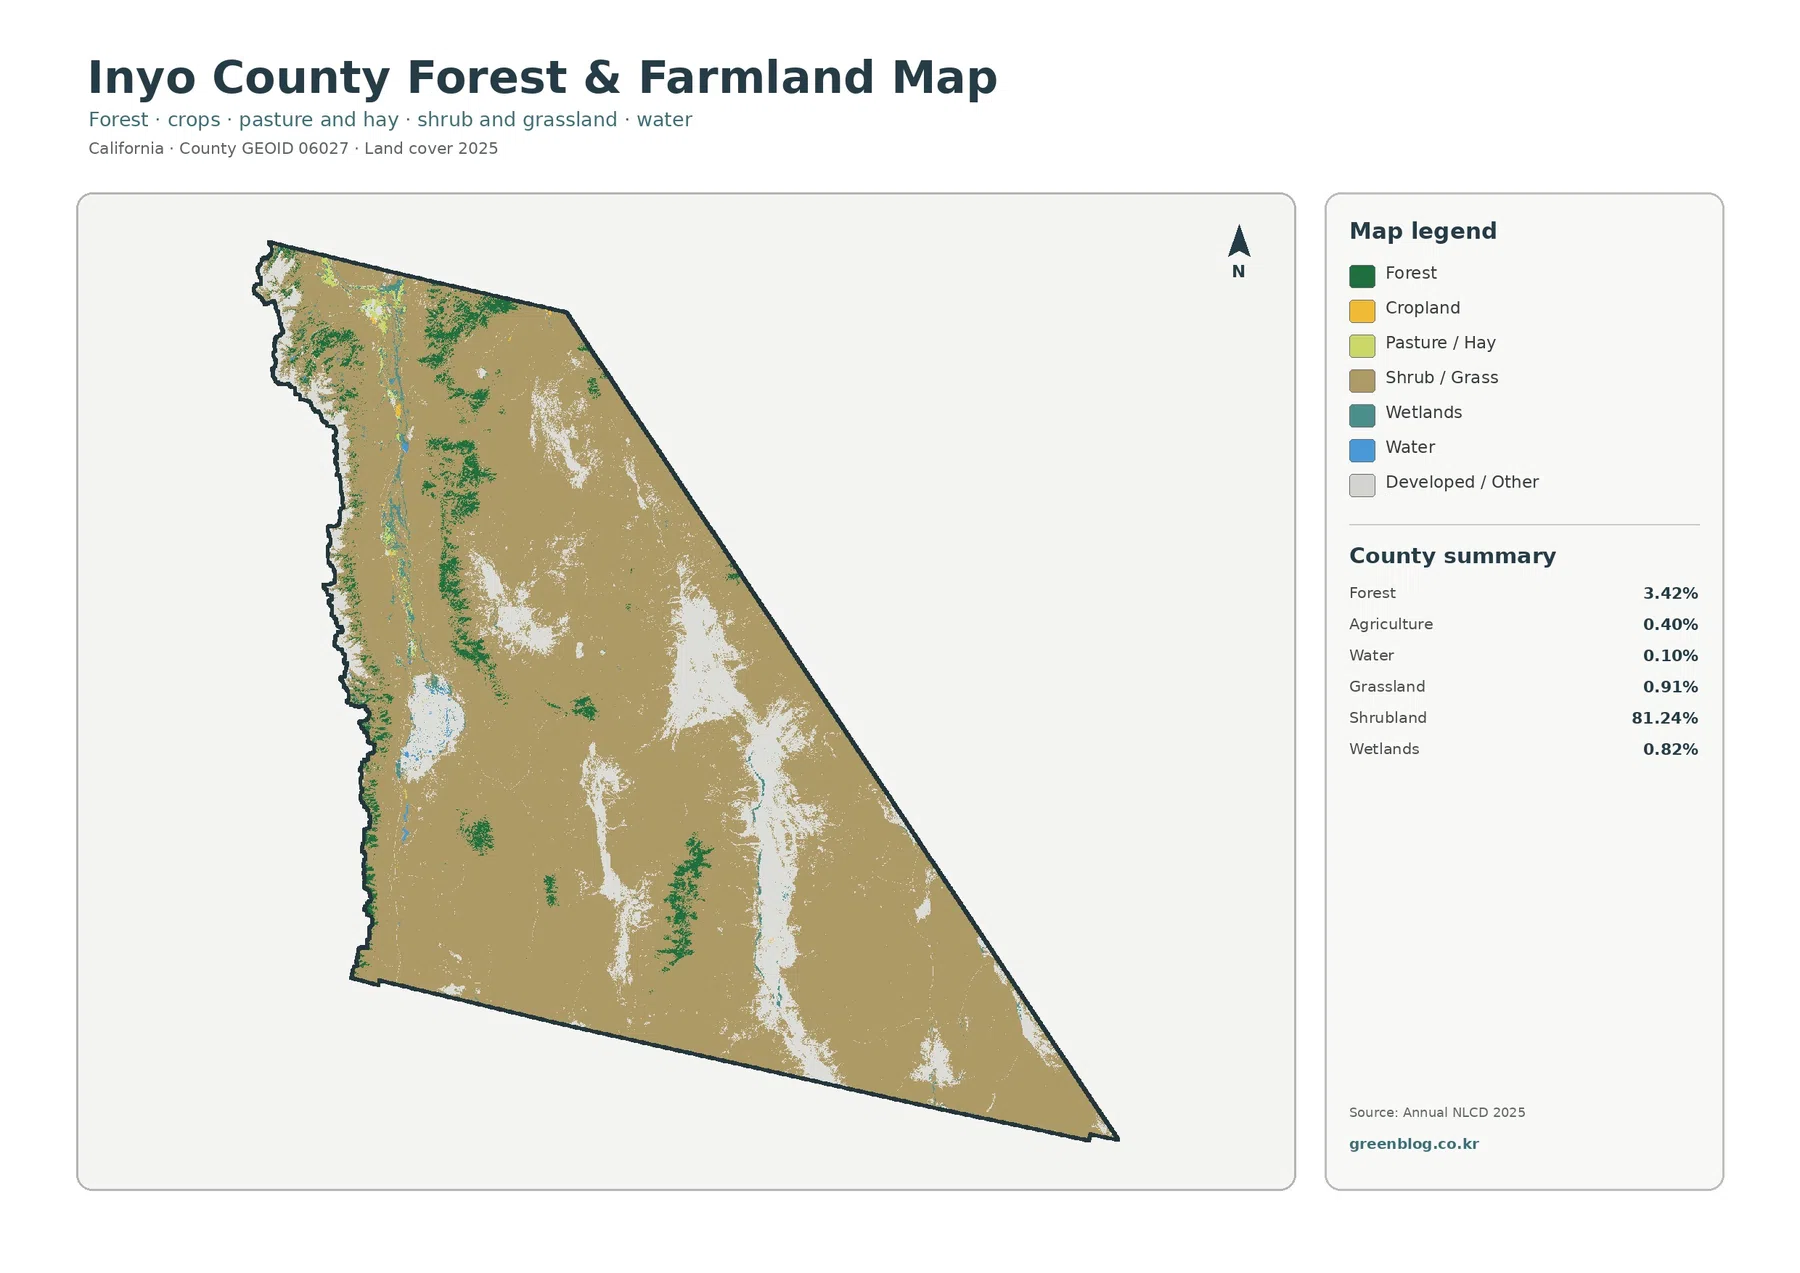
This map is especially useful when a presentation needs to explain why small percentages can still matter. Forest and agriculture together occupy only a modest share of Inyo County, yet their locations are not random. Forest is much more visible in mountain areas, while agriculture and wetlands appear in narrow valley settings. That separation is more informative than a simple ranking table because it shows where different surface types meet the large shrubland background.
Barren ground is not confined to one desert basin
The 12.74% barren share appears in several parts of the county rather than as one solid area. Pale gray bands run through interior mountain terrain, and larger barren patches also occur toward the south and southeast. Inyo County extends into the Death Valley region, where the National Park Service describes a landscape of mountain ranges, salt flats, dry lake playas, canyons, and desert basins. That regional context is consistent with the broad mixture of shrubland and barren surfaces visible in the southern part of the land cover map.
It is important not to treat all pale gray cells as the same physical feature. A high rocky ridge, exposed alluvial surface, salt or playa area, and other sparsely vegetated terrain may all fall into a broad barren classification. The land cover product is designed to separate surface classes at county scale, not to map geologic formations. A geological map or detailed vegetation dataset would be needed to distinguish those surfaces more precisely.
The dominant shrubland class should be interpreted with the same restraint. The map establishes that shrubland was the most common 2025 classification, but it does not identify why each cell has that cover. CDFW describes Owens Valley as a semi-arid desert in the rain shadow of the Sierra Nevada, while the National Park Service describes the Death Valley region as extremely arid. Those official sources provide useful environmental background, but the land cover image itself remains a surface classification rather than a climate or ecological-process model.
For readers comparing the western and southeastern parts of the county, the strongest contrast is between small forested and wet areas near the western mountain-and-valley system and the much broader shrub/barren pattern farther east and south. That contrast is visible without assigning a cause to every patch. It also explains why Inyo County benefits from a multi-map presentation: the large dry classes dominate the first map, while the smaller human and water-related classes require more focused views.
Impervious surface remains almost absent across most of the county
Impervious surface means ground covered by roofs, pavement, parking areas, and similar materials that do not readily absorb water. In 2025, Inyo County has a mean impervious value of only 0.11%. The share mapped at 50% or greater imperviousness is 0.05%, and developed cover is 0.34%. Those extremely low values match the mostly white appearance of the impervious surface map.
The strongest orange and red marks occur in a compact northwestern area and at a small number of locations along the western side. A few isolated points appear elsewhere, but there is no broad developed surface across the eastern or southeastern county. This distribution shows that hard surfaces are concentrated in relatively small settlement and transportation areas. It does not show that a particular highway or town caused development; it only places the mapped hard surfaces in the same geographic corridor.
Developed cover at 0.34% is larger than the 0.11% mean impervious value because the two measures describe different things. A developed land-cover cell can still contain trees, bare soil, yards, or other permeable surfaces. Impervious data estimate the fraction occupied by hard surfaces inside a cell. For that reason, the developed percentage should not be treated as paved area, and the countywide impervious mean should not be used as the pavement percentage for any individual community.
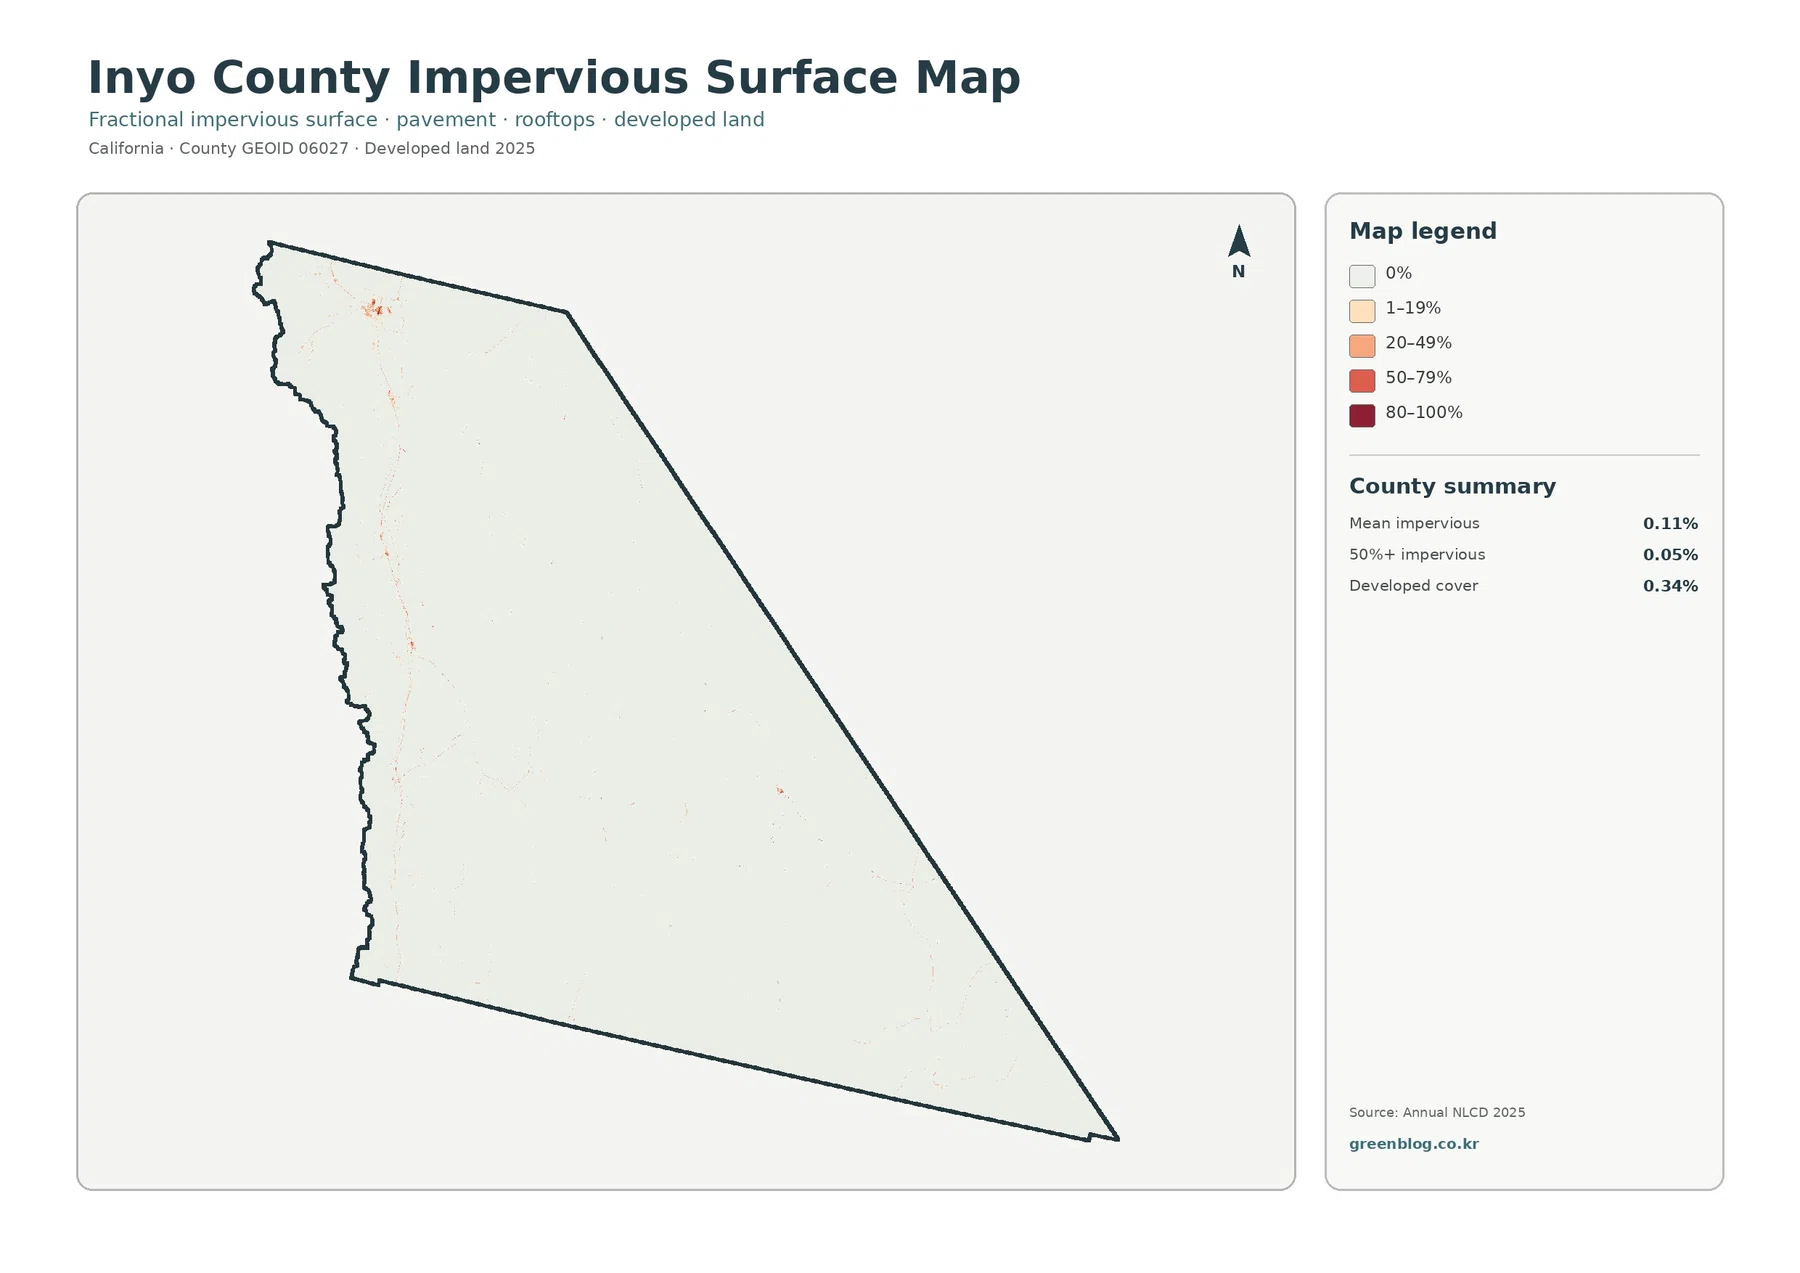
Inyo County’s official General Plan provides a different kind of information. It addresses land use, circulation, conservation and open space, safety, and other policy subjects. That planning framework is appropriate for understanding what the county intends or regulates, while the impervious map is appropriate for seeing where hard surfaces were detected in a 2025 raster dataset. Keeping those purposes separate prevents a satellite classification from being mistaken for zoning or development approval.
The 1985–2025 comparison is dominated by “other class difference”
The change map compares the 1985 and 2025 classifications rather than showing a single year. Inyo County has a total mapped class difference of 4.34%. Most of that amount is the broad “other difference” category at 3.91%. Forest loss accounts for 0.18%, transition to developed land for 0.08%, and agricultural loss for 0.05%. The small totals are consistent with a map in which most cells remain white, but the changed cells are not evenly distributed.
Purple other-difference cells occur in scattered patches through the north, center, western mountain-and-valley side, and parts of the south. A few clusters are much denser than the surrounding map. Because the category combines differences that do not fit the separately named development, forest-loss, agricultural-loss, or wetland-difference groups, it should be used as a pointer to locations that deserve closer review. It is not a single land-change process.
The 0.18% forest-loss category and 0.05% agricultural-loss category appear as small orange or yellow marks rather than broad continuous areas. A cell classified as forest in 1985 and something else in 2025 may reflect a real vegetation change, but the two-date map cannot identify whether fire, harvest, drought, recovery stage, image timing, or classification behavior is responsible. Agricultural cells can also change class as crop conditions and seasonal appearance change.
Transition to developed land is just 0.08%. Red marks are limited and tend to occur near some of the same western areas that contain present-day impervious surface. That comparison is useful, but the percentage is not a building-permit total, urban boundary expansion, or parcel conversion statistic. It simply identifies raster cells whose 1985 and 2025 classifications fit the supplied transition-to-developed category.
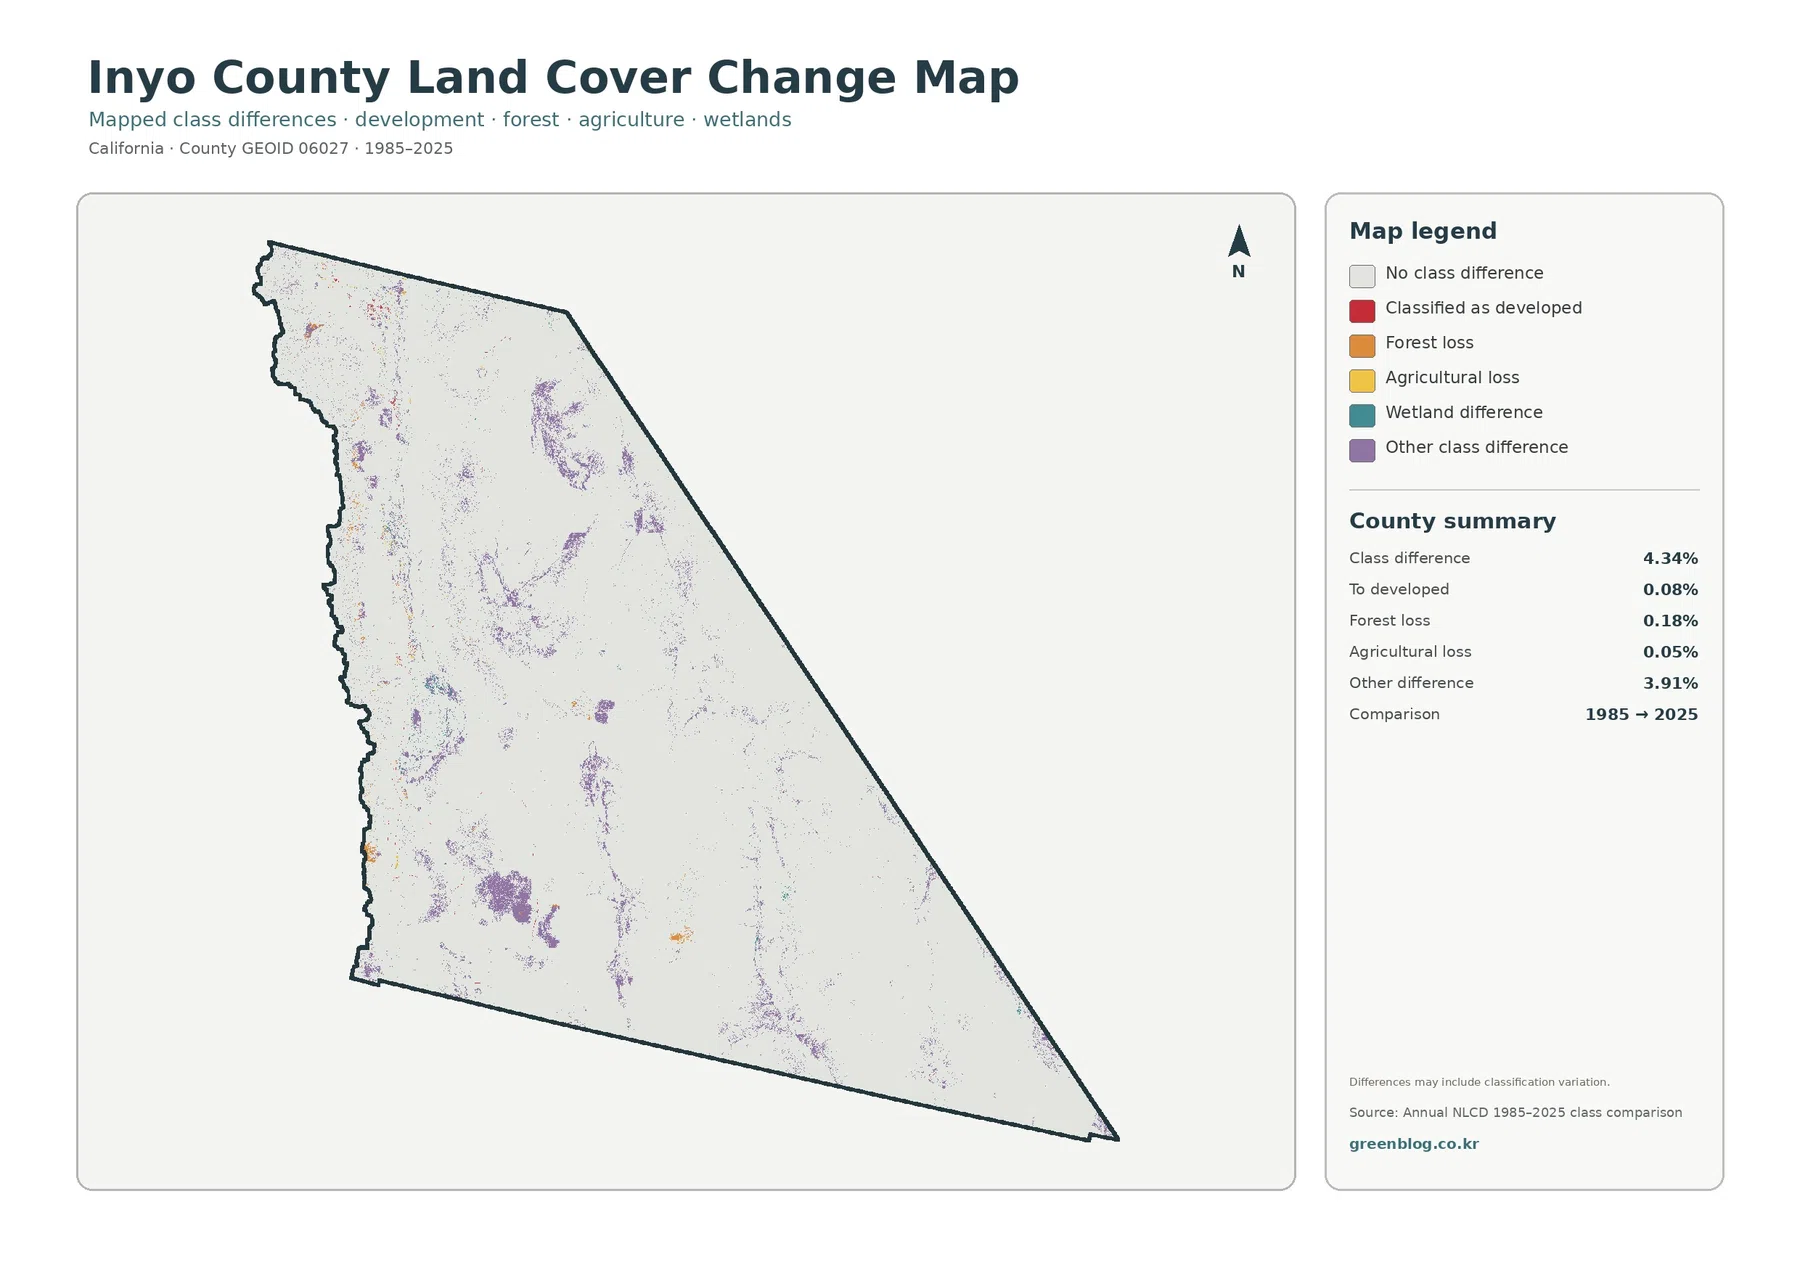
The map includes an important warning that differences may contain classification variation. That note matters in Inyo County because many cells lie along boundaries between shrubland, barren ground, grassland, and sparse forest. A roughly 30-meter cell can contain more than one real surface type, and a modest shift in vegetation appearance may change the assigned class. The change map is best used to identify areas for follow-up with intermediate Annual NLCD years, aerial imagery, or local records.
How to use the four maps without mixing their purposes
For a basic county overview, start with the general land cover map. It establishes the 81.24% shrubland and 12.74% barren pattern and shows how small the forest, grassland, wetland, water, agricultural, and developed classes are by comparison. The forest and farmland map is better when the question is specifically about greener mountain areas or the narrow agricultural and wetland patches of Owens Valley.
The impervious map answers a different question. It does not classify the entire landscape into vegetation types; it isolates the intensity of hard surfaces. This makes the western settlement pattern easier to see even though the countywide mean is only 0.11%. For a planning presentation, showing the general map first and the impervious map second makes it easier to distinguish “developed land cover” from the smaller fraction actually occupied by pavement and rooftops.
The change map should come last because it compares two years. If it is shown by itself, a purple or orange area does not tell the audience what covers that location in 2025. Keeping a current-condition map beside it allows readers to see whether the present surface is shrubland, forest, barren land, agriculture, wetland, or development. Labels and captions should preserve the 1985–2025 date range so the change product is not mistaken for a current land cover image.
The map set is useful for environmental education, county-scale reference work, watershed orientation, and presentation graphics. Inyo County’s geography makes the comparisons particularly clear: a broad desert shrub/barren landscape is interrupted by mountain forest and a narrow western valley with more water, wetland, agriculture, and development. For parcel-level planning, habitat boundaries, water rights, or regulatory decisions, readers should move from these overview maps to the appropriate official dataset.
Download the four original JPG maps
The WebP images on the page are convenient for browser viewing, while the download ZIP contains the four original JPG maps: 2025 general land cover, forest and farmland, impervious surface and developed land, and the 1985–2025 land cover change comparison. Using the same county boundary makes it easy to place them side by side in a report or presentation.
Keep the legend and date visible when reusing the images. Shrubland and barren ground represent different classes, developed cover and impervious percentage are not the same measure, and the change map uses two dates rather than one. Those distinctions are easy to lose if the maps are heavily cropped or if the captions are removed.
These are county-scale reference graphics, not surveys or regulatory maps. They do not replace parcel records, zoning, legal wetland boundaries, agricultural inventories, road engineering data, or site-specific habitat studies. When exact boundaries matter, use the map to identify the area of interest and then consult the responsible agency’s current source data.
What a 30-meter classification can and cannot show
Annual NLCD products generally classify the landscape with raster cells about 30 meters across. A raster cell can be thought of as one square in a large grid. That scale is efficient for comparing a county as large as Inyo, but it can simplify narrow roads, small buildings, springs, thin wetland edges, small crop fields, and abrupt mountain transitions.
A cell can also contain more than one real surface. Shrubs, bare rock, soil, and grass may all occur within the same 30-meter area, yet the land cover product must assign one main class. This is often called a mixed pixel. It is especially relevant where the dominant shrubland meets barren mountain terrain or where sparse forest breaks into open vegetation. The mapped edge may look cleaner or more irregular than the actual ground boundary.
The observation year matters as well. The current-condition maps represent 2025, so changes after that year are not included. The change map compares 1985 with 2025 but does not describe every event between those dates. A place could change several times and return to a similar class, leaving little or no two-date difference. Readers who need the sequence of change should examine intermediate Annual NLCD years and current imagery.
Policy documents require a separate interpretation. The Inyo County General Plan addresses how land use, circulation, conservation, open space, and other subjects are managed. The land cover map only describes a generalized physical surface classification. A shrubland cell might be public land, private land, protected habitat, or an area with some other legal status; none of those distinctions can be inferred from the land cover color.
With those limits in mind, the four maps provide a strong countywide overview. Shrubland dominates, barren ground forms the second major class, and forest is concentrated in smaller mountain areas. Agriculture, wetlands, water, and development are much more localized toward the western valley system. The impervious map confirms how little of the county is covered by hard surfaces, while the change map shows that most of the 1985–2025 difference belongs to the broad other-difference category rather than to development or agricultural loss.
Frequently Asked Questions
What is the dominant land cover in Inyo County in 2025?
Shrubland is the dominant class at 81.24%. Barren land follows at 12.74%, while forest accounts for 3.42%. The map shows shrubland across most of the eastern and southeastern county, with smaller forest and wetland areas concentrated elsewhere.
Why do the Owens Valley areas contain more land-cover colors than the broad desert interior?
The western valley corridor contains more mapped forest, agriculture, wetlands, water, and developed/other cover than the surrounding shrub-dominated landscape. The map demonstrates the concentration, while geographic and water-resource sources are needed to explain the local causes in detail.
Does the 4.34% class difference mean that exactly 4.34% of the county permanently changed?
No. The map compares 1985 and 2025 classifications and may include classification variation. Other class difference makes up 3.91% of the total, so intermediate imagery and local records are needed before assigning a specific cause to a changed cell.
Sources and reference links
Land cover and impervious surface classifications can be reviewed through MRLC Annual NLCD Data and the USGS Annual NLCD Land Cover Classification. County boundary and FIPS references are available from U.S. Census Bureau TIGER/Line.
County planning context is available through the Inyo County General Plan. The geographic setting of Owens Valley is described by the California Department of Fish and Wildlife, and wetland context around Owens Lake can be reviewed through the Cartago Wildlife Area.
For the southeastern desert setting, the National Park Service Death Valley Natural Features & Ecosystems page provides regional background. The percentages used in this article come from the 2025 map summaries supplied in the attached Inyo County package rather than from these external planning or natural-resource pages.
Map File Information
The ZIP includes four original JPG maps for Inyo County: 2025 general land cover, forest and farmland, impervious surface and developed land, and 1985–2025 land cover change.
- Included Files: Use only the versions confirmed in the article and supplied images
- File Type: Use the confirmed download contents
- Intended Use: Printing, education, presentations, and map-based projects
Related Maps
- Alameda County California Land Cover Map
- Alpine County California Land Cover Map
- Amador County California Land Cover Map
Green Map creates custom-edited map images using open geographic data sources such as geoBoundaries, Natural Earth, OpenStreetMap, and government open data.
These maps are edited visual materials, not raw data files, and are provided for education, documents, presentations, and graphic reference.