The Butte County California Land Cover Map set captures a strong transition from intensively farmed Sacramento Valley ground in the west to grassland, shrubland, forest, and mountain terrain toward the east. The 2025 summary is unusually balanced at the top: grassland accounts for 24.97% of the county and agriculture 24.65%, while shrubland and forest are also close at 18.83% and 18.65%.
Four views are provided on this page: current land cover, forest and farmland, impervious surface, and land cover change from 1985 to 2025. The four original JPG maps are available in one download, so the page can be used both for quick on-screen comparison and for printed reference, classroom work, presentations, or further county-level study.
Table of Contents
A Sacramento Valley to Sierra Nevada transition inside one county
Butte County occupies the northeastern side of the Sacramento Valley and extends eastward into the Sierra Nevada. County planning material describes three broad topographic settings: valley, foothills, and mountain country. That progression is easy to recognize in the 2025 land-cover pattern. Large agricultural blocks dominate much of the western lowland, open grass and shrub cover becomes more common through the central foothill zone, and forest expands across the higher northeastern and eastern areas.
The countywide percentages are useful, but they do not describe where each class occurs. Grassland, the largest category at 24.97%, is not spread evenly from boundary to boundary. It is especially prominent between the cultivated valley floor and the more heavily forested mountain areas. Agriculture at 24.65% is much more concentrated, forming large continuous areas in the west and southwest rather than occupying the uplands.
Shrubland covers 18.83% and forest 18.65%, another pair with nearly equal countywide shares but very different spatial patterns. Forest forms broad concentrations in the northeast and along parts of the eastern edge. Shrubland occupies more of the drier or more open terrain between forested areas and the valley, creating a patchwork with grassland through the foothills.
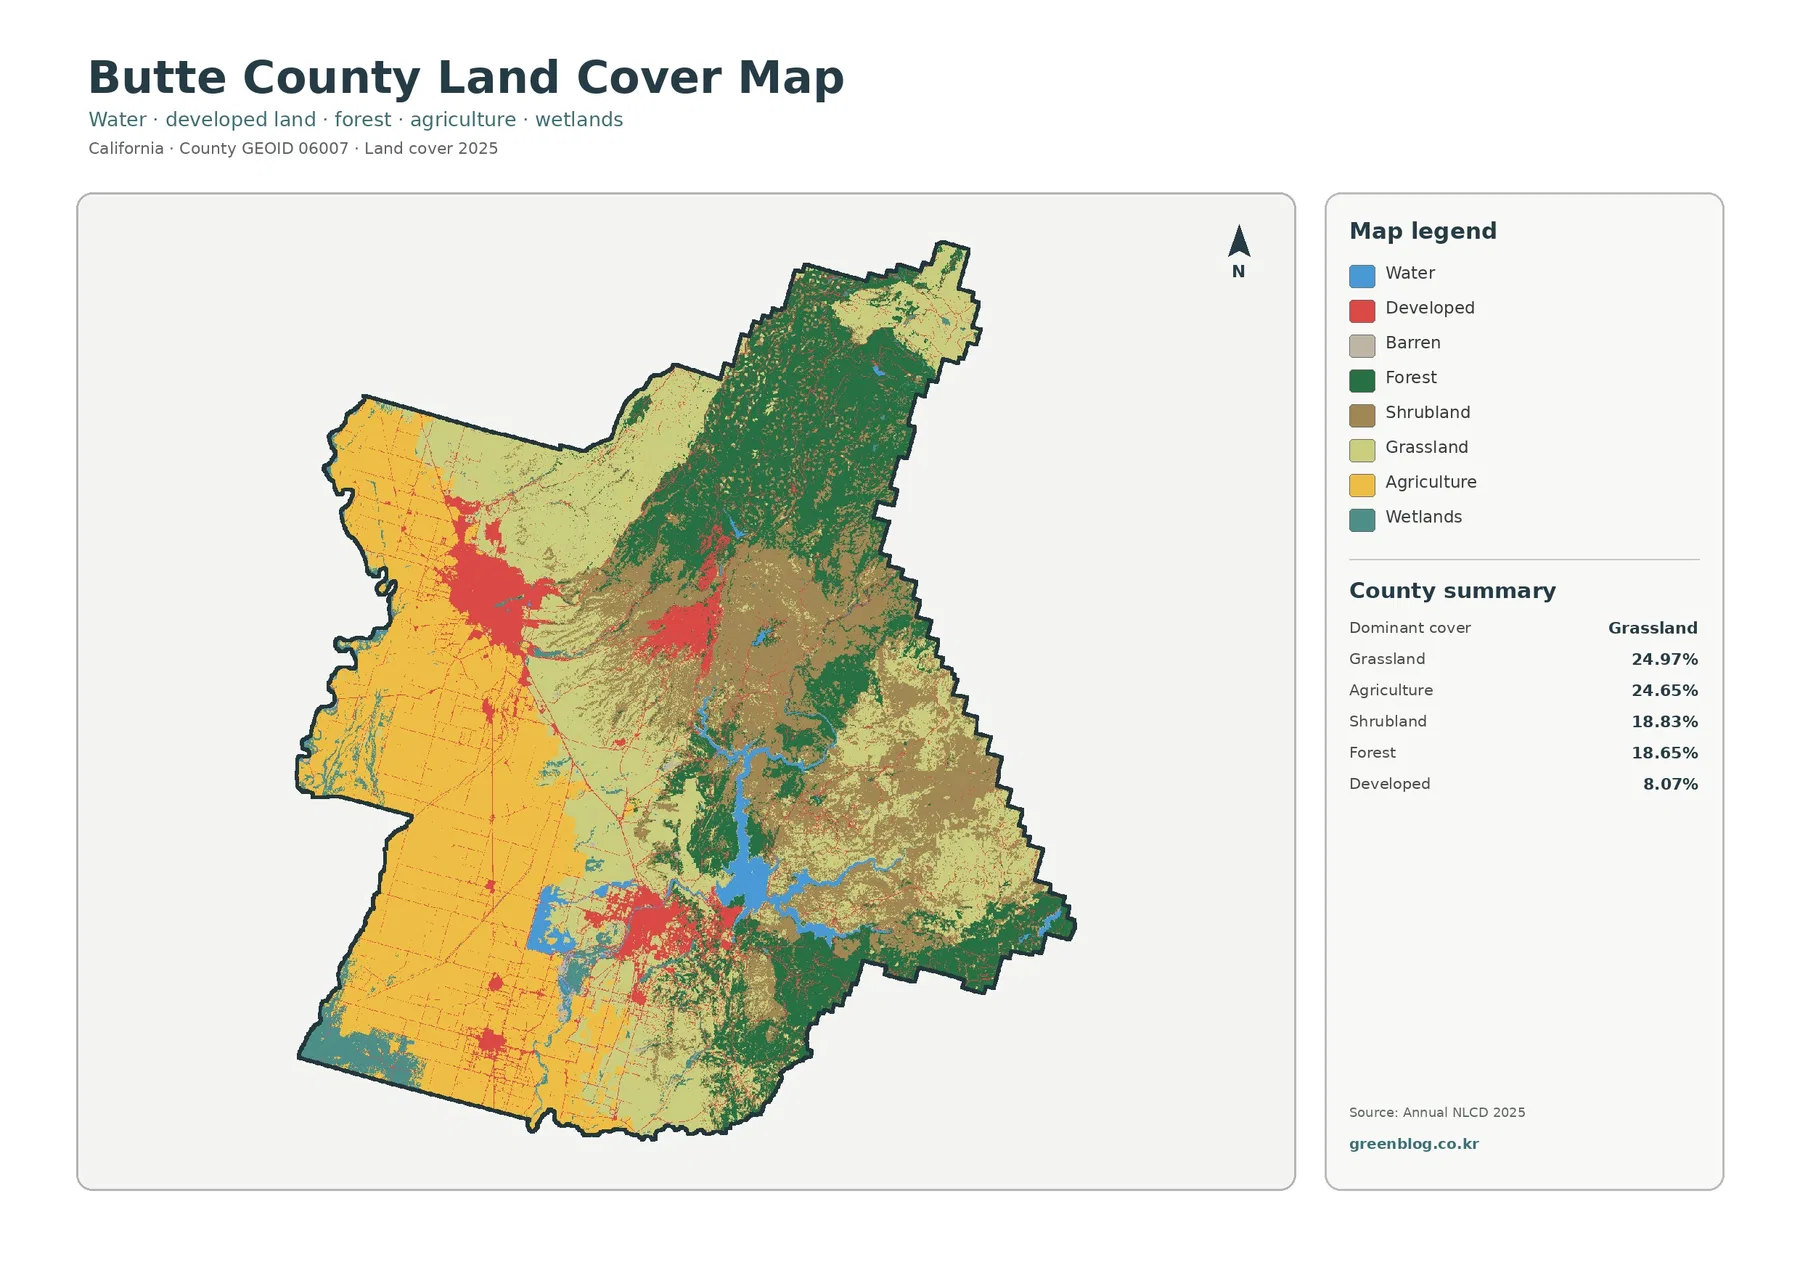
Developed land makes up 8.07% of the 2025 classification. Its footprint is much smaller than agriculture or natural open cover, yet it stands out because it is clustered rather than dispersed. The largest developed concentration is around Chico in the west-central part of the county, with another clear cluster around Oroville farther south. Development also reaches into the foothills around Paradise, where the pattern is narrower and more linear than the broad Chico urban area.
Water accounts for 2.00% and wetlands 2.56%. Lake Oroville is the most visually prominent water feature in the interior of the county, spreading through branching valleys east of Oroville. Smaller water and wetland features are visible across the western lowlands and along drainage corridors. Their area is modest in percentage terms, but they provide useful landmarks when comparing agriculture, open vegetation, and developed land.
Forest and farmland separate most clearly on the simplified view
Within the Butte County California Land Cover Map set, the forest-and-farmland view removes some of the detail of the full classification and emphasizes forest, cropland, pasture or hay, shrub and grass, wetlands, water, and developed or other cover. That makes the western agricultural plain much easier to distinguish from the forested northeast. Instead of reading many classes at once, a visitor can see where cultivated ground ends and open or wooded terrain becomes dominant.
Agriculture is not just a generic background category in Butte County. University of California Cooperative Extension programs for the county specifically cover orchard crops, rice and other field crops, livestock and natural resources, and forestry. County materials also describe fertile agricultural fields around Gridley and Biggs in the west, while Chico and Oroville are major population centers and the Sierra Nevada foothills and mountains lie farther east.
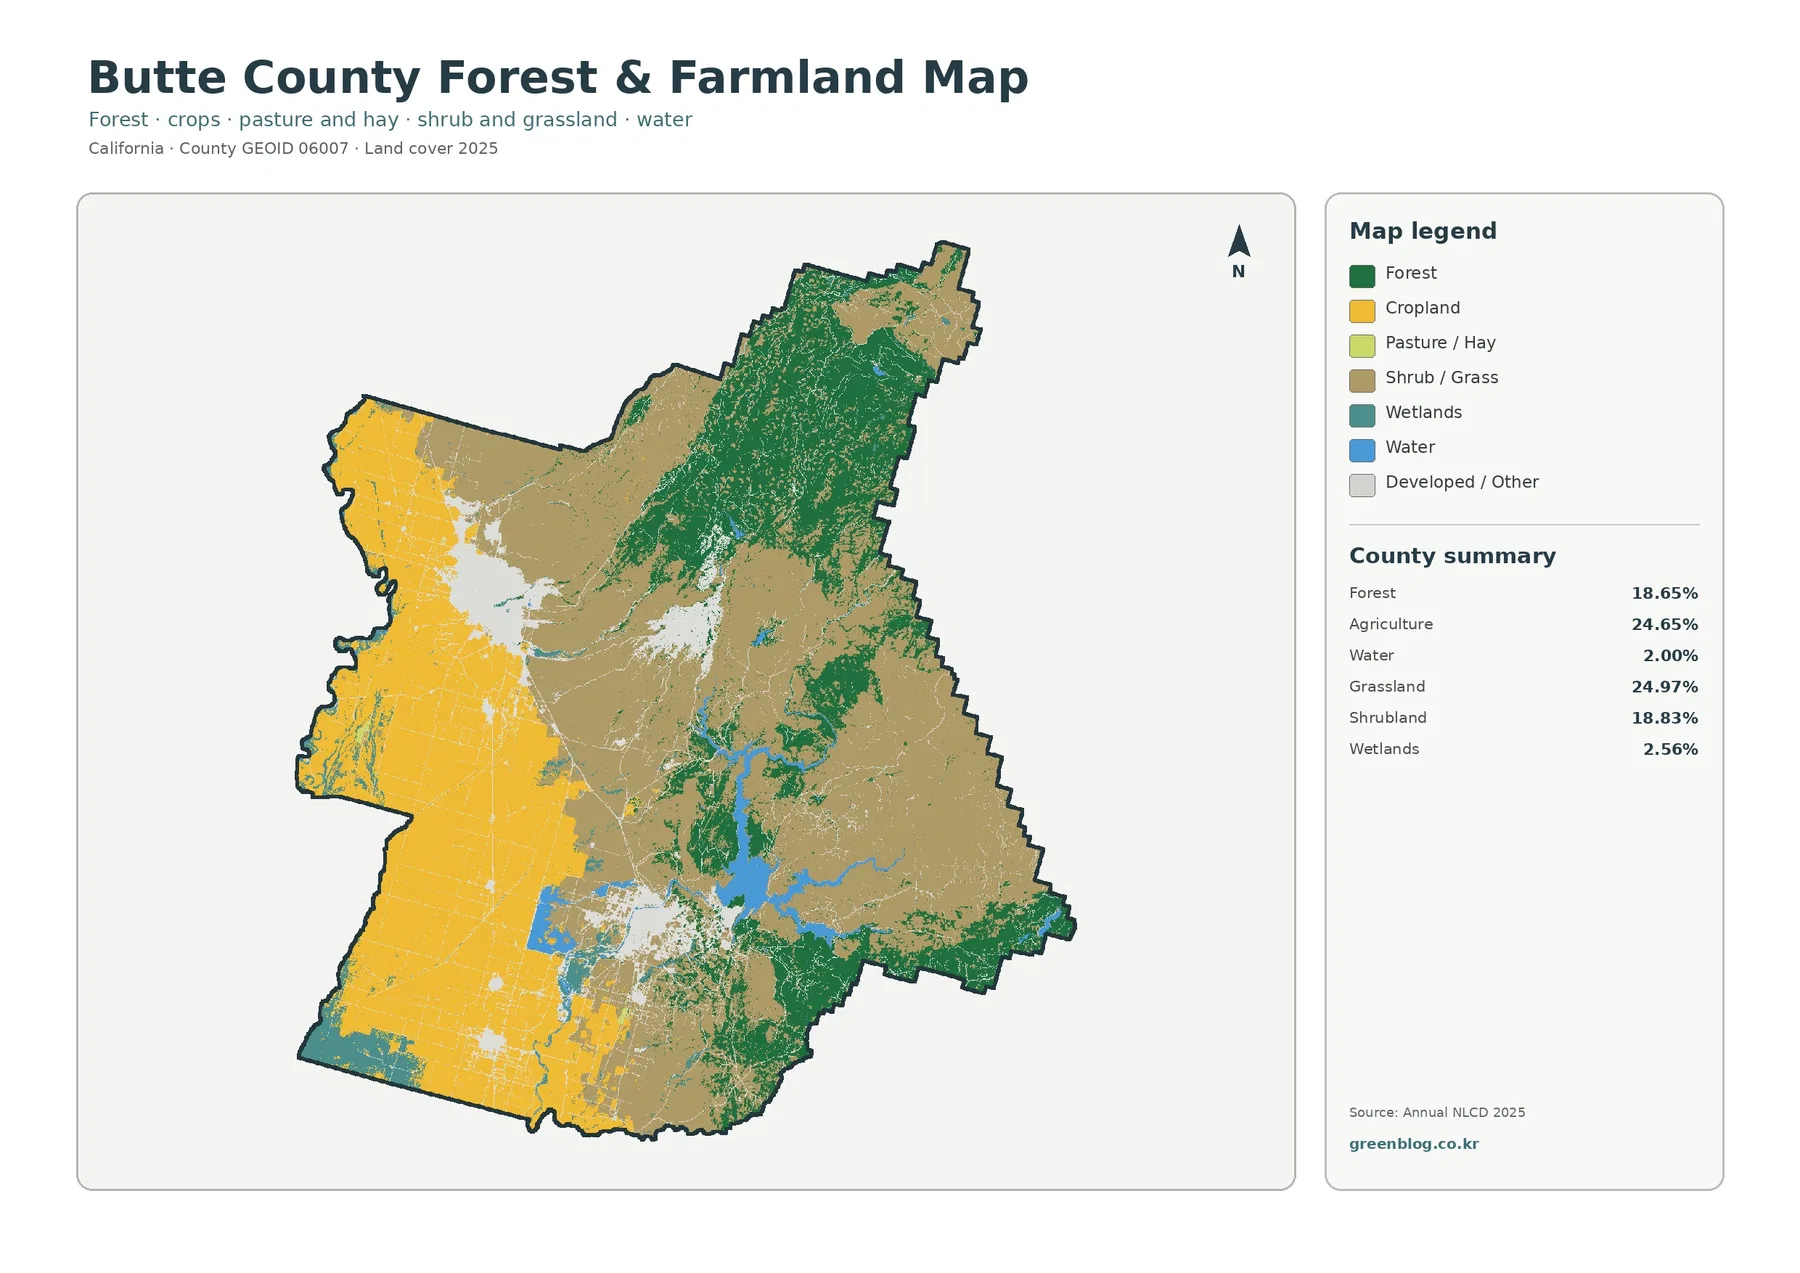
Between those two broad settings, shrub and grass cover occupies a large share of the foothills. The transition is not a clean straight boundary. Open cover, forest patches, settlements, and water features intermix, especially east of Chico and north or northeast of Oroville. This is one reason a countywide percentage cannot substitute for the map itself.
Chico, Oroville, and Paradise stand out on the impervious surface map
Impervious surface means pavement, rooftops, parking lots, and other surfaces that do not readily absorb water. The 2025 county summary gives a mean impervious value of 2.43%, while 1.41% of the county is mapped at 50% impervious or higher. Those averages are low because Butte County includes extensive agricultural and natural land, but the urban clusters are much more concentrated than the countywide number suggests.
Chico forms the largest dense impervious cluster in the west-central valley. Darker tones are concentrated in the urban core and fade outward where development becomes less dense and agricultural or open land becomes more common. Oroville forms a second major cluster farther south, with smaller developed features extending along the surrounding road network and into nearby settled areas.
Paradise appears differently because it lies in the foothills rather than on the broad valley floor. Impervious features extend through a narrower upland settlement pattern, while large areas farther east and northeast remain at or near zero impervious cover. The contrast between Chico, Oroville, Paradise, and the eastern mountains makes this map especially useful for separating urban surface intensity from the broader developed-land class.
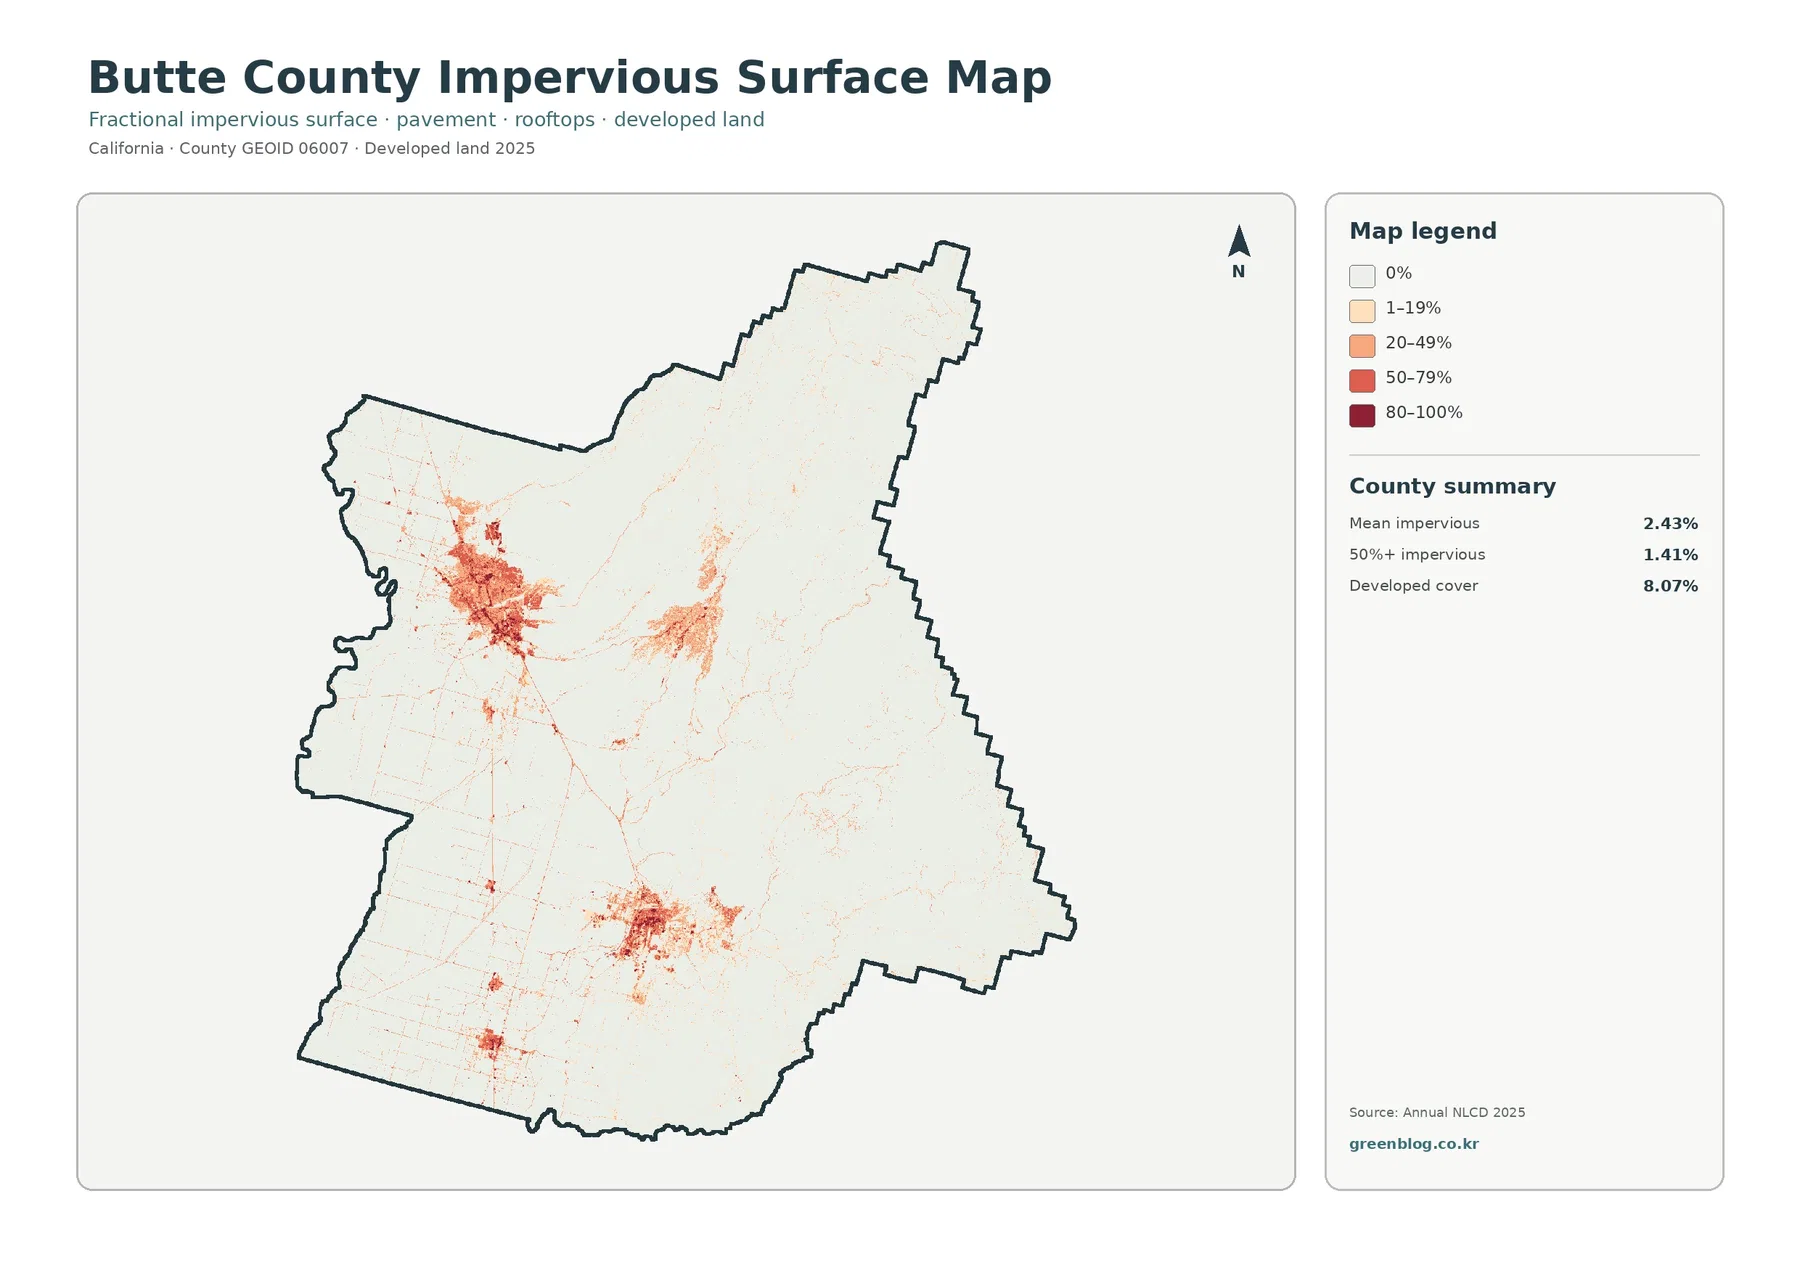
Developed land and impervious surface should not be read as the same measure. The land-cover map classifies 8.07% of the county as developed, but mean imperviousness is only 2.43%. A developed raster cell can still contain lawns, soil, trees, and other permeable surfaces. The impervious product estimates the hard-surface fraction inside the cell, which is why it gives a more focused view of pavement and building density.
The 1985–2025 comparison is dominated by forest-class differences
The long-term change map compares land-cover classes in 1985 and 2025. It reports a class difference across 35.27% of the county. Forest loss is the largest labeled component at 22.91%, while 2.58% is classified as a change to developed land, 0.67% as agricultural loss, and 8.65% as other class difference. The map also includes wetland difference as a separate category.
Orange forest-loss pixels cover large portions of the eastern and northeastern uplands. Many of these areas are adjacent to or intermixed with forest that remains visible on the 2025 map. The label should therefore be interpreted as a difference between the two classified years, not as proof that every orange pixel represents permanent removal of forest. Wildfire, timber activity, vegetation recovery stage, conversion to shrub or grass cover, and classification variability can all affect what a 30-meter cell is labeled in different years.
Changes to developed land are more concentrated near Chico and Oroville and in smaller settled corridors. Their spatial pattern is very different from the broad forest-related changes in the mountains. This distinction makes the comparison map useful because it separates two visually different kinds of county change: extensive vegetation-class differences in the uplands and smaller but concentrated development changes around population centers.
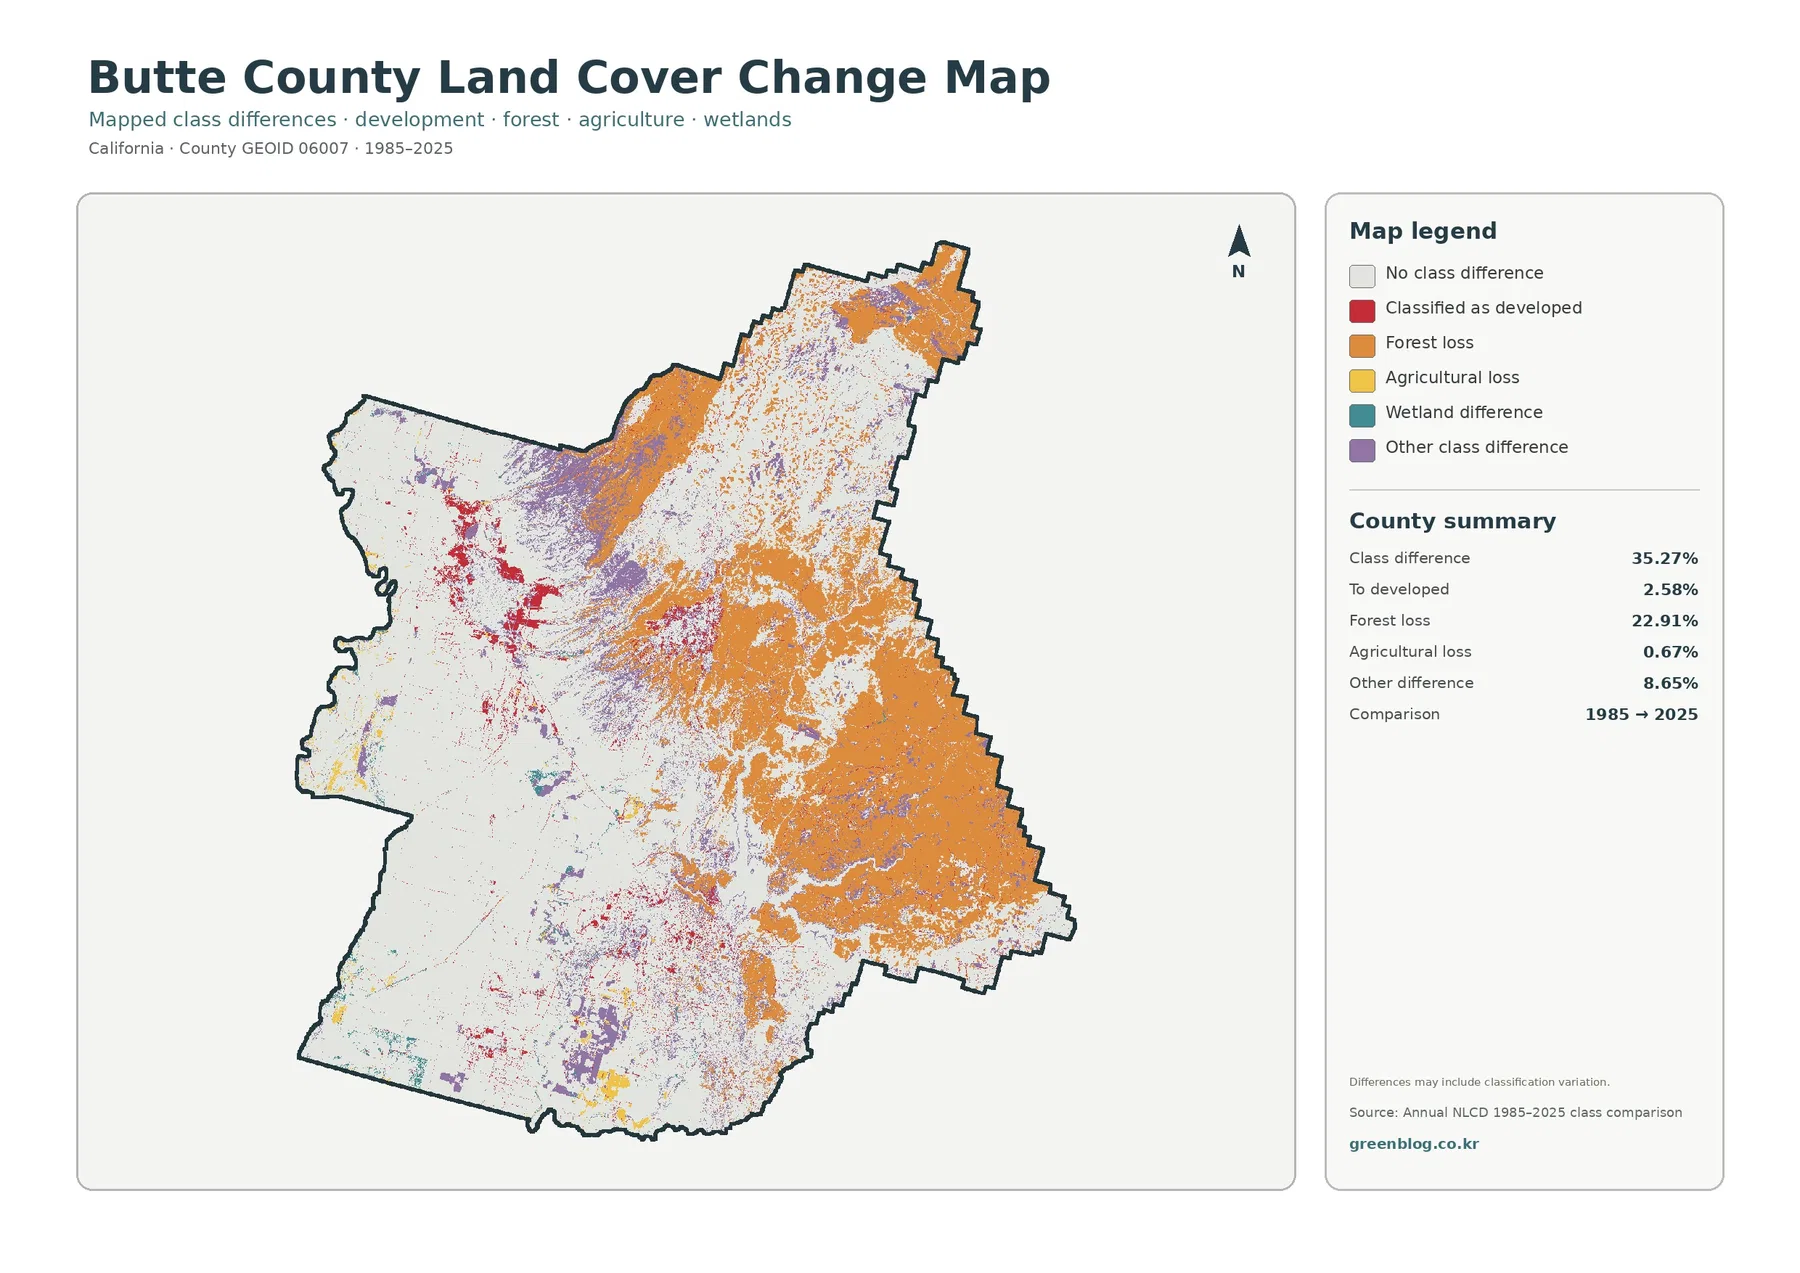
The supplied map warns that differences may include classification variation. That caution matters over a forty-year span. Annual NLCD is a raster dataset at 30-meter resolution, so each cell summarizes a square area that may contain more than one surface type. Small features, mixed vegetation, narrow roads, and edges between classes can shift labels without representing a simple one-time land conversion.
Choosing a map for a class, report, or reference sheet
For a broad overview of the Butte County California Land Cover Map set, start with the full 2025 land-cover view. It is the best single sheet for comparing agriculture, grassland, shrubland, forest, development, water, and wetlands. If the main question is the relationship between farming and wooded uplands, the simplified forest-and-farmland view removes distracting classes and makes the west-to-east contrast clearer.
Use the impervious map when the focus is the built surface rather than the entire developed class. It is especially helpful for comparing Chico, Oroville, Paradise, and rural areas because it distinguishes dense hard-surface clusters from lower-density developed land. For historical context, pair the 2025 land-cover map with the 1985–2025 change map so current conditions and long-term class differences are visible at the same time.
What these maps can and cannot tell you
Land cover describes what is physically present on the ground as interpreted from satellite imagery and supporting data. It is not the same as zoning, legal land use, parcel ownership, development rights, or property boundaries. A place can be legally zoned for one purpose while its current surface cover is grass, forest, agriculture, or a mixture of developed and vegetated land.
The Butte County California Land Cover Map uses Annual NLCD Collection 1.2, which extends through 2025 and is produced at 30-meter resolution. A raster cell is simply one square unit in that grid. Because a cell can contain several real-world surfaces, the assigned class is a generalization. The impervious product adds fractional information for hard surfaces, but it still should not be treated as a survey of individual buildings, driveways, or parcel improvements.
Frequently Asked Questions
Why do agriculture and grassland have almost the same countywide share but look so different on the map?
Agriculture is concentrated across the western and southwestern valley floor, while grassland is much more common through the foothill transition and other open areas. Their 2025 shares are close—24.65% agriculture and 24.97% grassland—but the locations are very different.
Which map is best for comparing Chico, Oroville, and Paradise development?
Use the general land-cover map to see the overall developed footprint and the impervious surface map to compare how strongly pavement, rooftops, and other hard surfaces are concentrated. Chico and Oroville form the largest clusters, while Paradise follows a narrower foothill settlement pattern.
Does the 22.91% forest-loss value mean that nearly a quarter of Butte County was permanently deforested?
No. The value comes from a 1985–2025 class comparison. It marks cells classified as forest in the earlier period and something else in the later comparison, but it does not by itself establish permanence or cause. Fire, harvest, vegetation succession, recovery, and classification variation can all contribute and require other evidence to distinguish.
Map File Information
The ZIP contains four original JPG maps for Butte County: 2025 land cover, forest and farmland, impervious surface, and 1985–2025 land cover change. The JPG files are larger than the on-page WebP previews and are suitable for printing, classroom reference, presentations, and map-based research notes.
- Included Files: Use only the versions confirmed in the article and supplied images
- File Type: Use the confirmed download contents
- Intended Use: Printing, education, presentations, and map-based projects
Related Maps
- Alameda County California Land Cover Map
- Alpine County California Land Cover Map
- Amador County California Land Cover Map
Sources and further reading
Land-cover and impervious-surface information can be explored through the U.S. Geological Survey Annual NLCD program and the MRLC Data portal. Annual NLCD Collection 1.2 extends the conterminous U.S. series through 2025 and provides annual land-cover products at 30-meter resolution.
For local context, see UC Cooperative Extension Butte County – Agriculture and Natural Resources and Butte County Planning. County planning and GIS sources should be used for current zoning, parcel, permitting, and other legal or administrative questions that land-cover maps are not intended to answer.
Green Map creates custom-edited map images using open geographic data sources such as geoBoundaries, Natural Earth, OpenStreetMap, and government open data.
These maps are edited visual materials, not raw data files, and are provided for education, documents, presentations, and graphic reference.