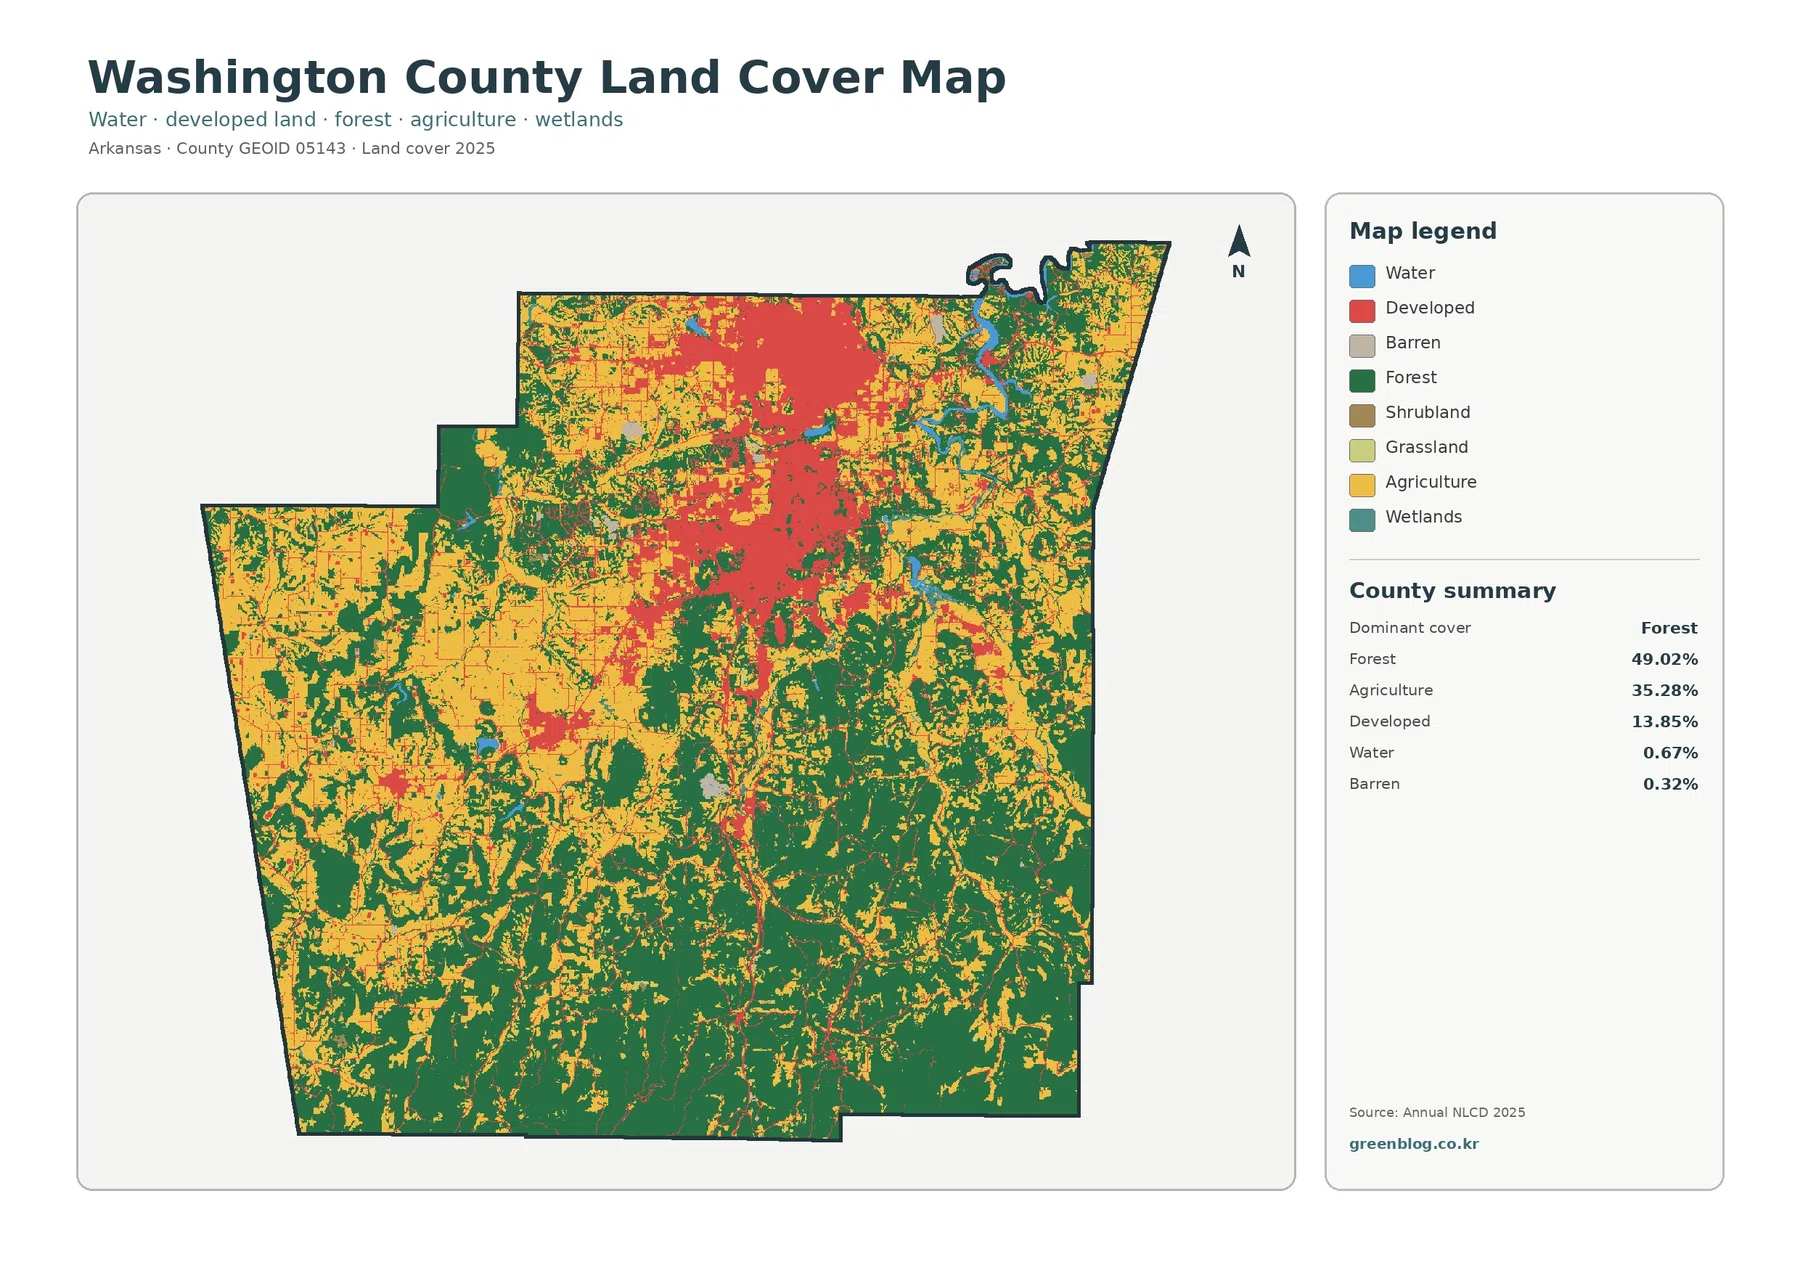
Washington County is one of the clearer examples in Arkansas of forest, farmland, and urban development sharing the same county at a large scale. The 2025 summary lists forest at 49.02%, agriculture at 35.28%, and developed land at 13.85%. A broad built-up area stands out in the north-central part of the county, while large forest blocks cover much of the south and east and agricultural land is more common toward the west and northwest.
This page brings together four views of that pattern: current land cover, forest and farmland, impervious surface, and mapped class differences from 1985 to 2025. WebP previews are provided for quick viewing, and the four original JPG maps are available in one ZIP for printing, classroom comparison, presentations, or local reference. Looking at the maps together helps separate broad developed land from hard surfaces and current conditions from long-term class change.
Table of Contents
The Fayetteville–Springdale area forms the county’s strongest developed concentration
On the current land-cover map, the largest developed area occupies the north-central part of Washington County. Its size and shape align with the Fayetteville–Springdale urban area, which is part of the larger Fayetteville–Springdale–Rogers metropolitan region described by the county government. Smaller developed patches appear elsewhere, but none approach the continuous footprint visible around the main population corridor.
The 13.85% developed share is important because it is large enough to change the overall appearance of a county that still has forest as its dominant cover. Development is not spread evenly from border to border. It becomes much lighter toward the south and much of the east, where forest occupies larger connected areas, and it breaks into smaller settlements across the agricultural west. That uneven distribution is more informative than the countywide percentage alone.
Impervious surface narrows the urban footprint to the hardest built surfaces
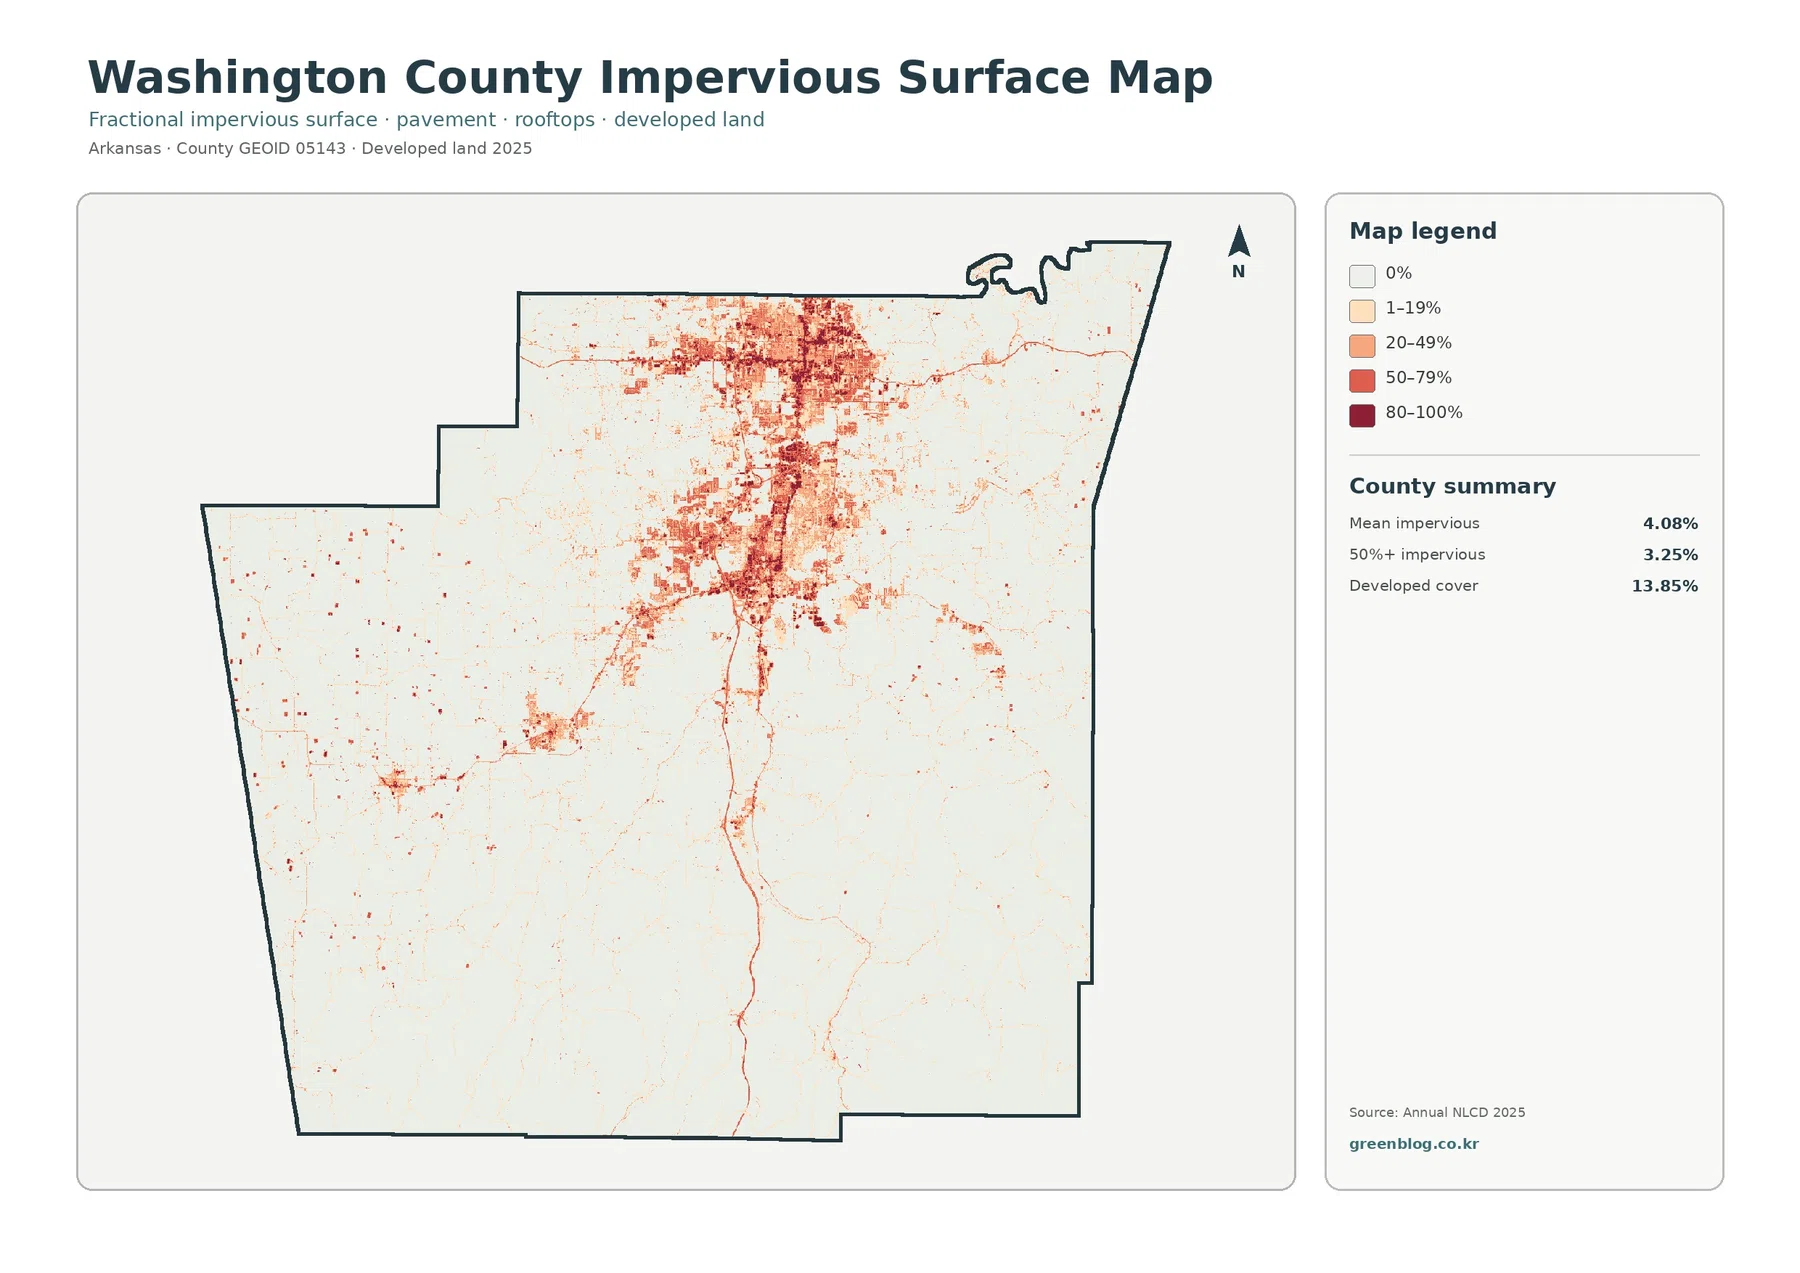
Developed land and impervious surface answer different questions. A developed land-cover class can include lawns, trees, bare soil, and other surfaces mixed among buildings and streets. Impervious surface focuses more directly on pavement, rooftops, parking lots, and similar surfaces that do not readily absorb water. That distinction explains why Washington County can have 13.85% developed cover while its mean impervious value is only 4.08%.
The impervious map makes the north-central concentration even more obvious. Darker cells cluster around the main urban area, with lighter linear traces extending away from it and much sparser hard-surface patterns across the southern half of the county. Areas mapped at 50% or more impervious surface account for 3.25% of the county, so only part of the broader developed class consists of very dense hard surfaces.
Nearly half the county is forest, but farmland remains a major part of the western landscape
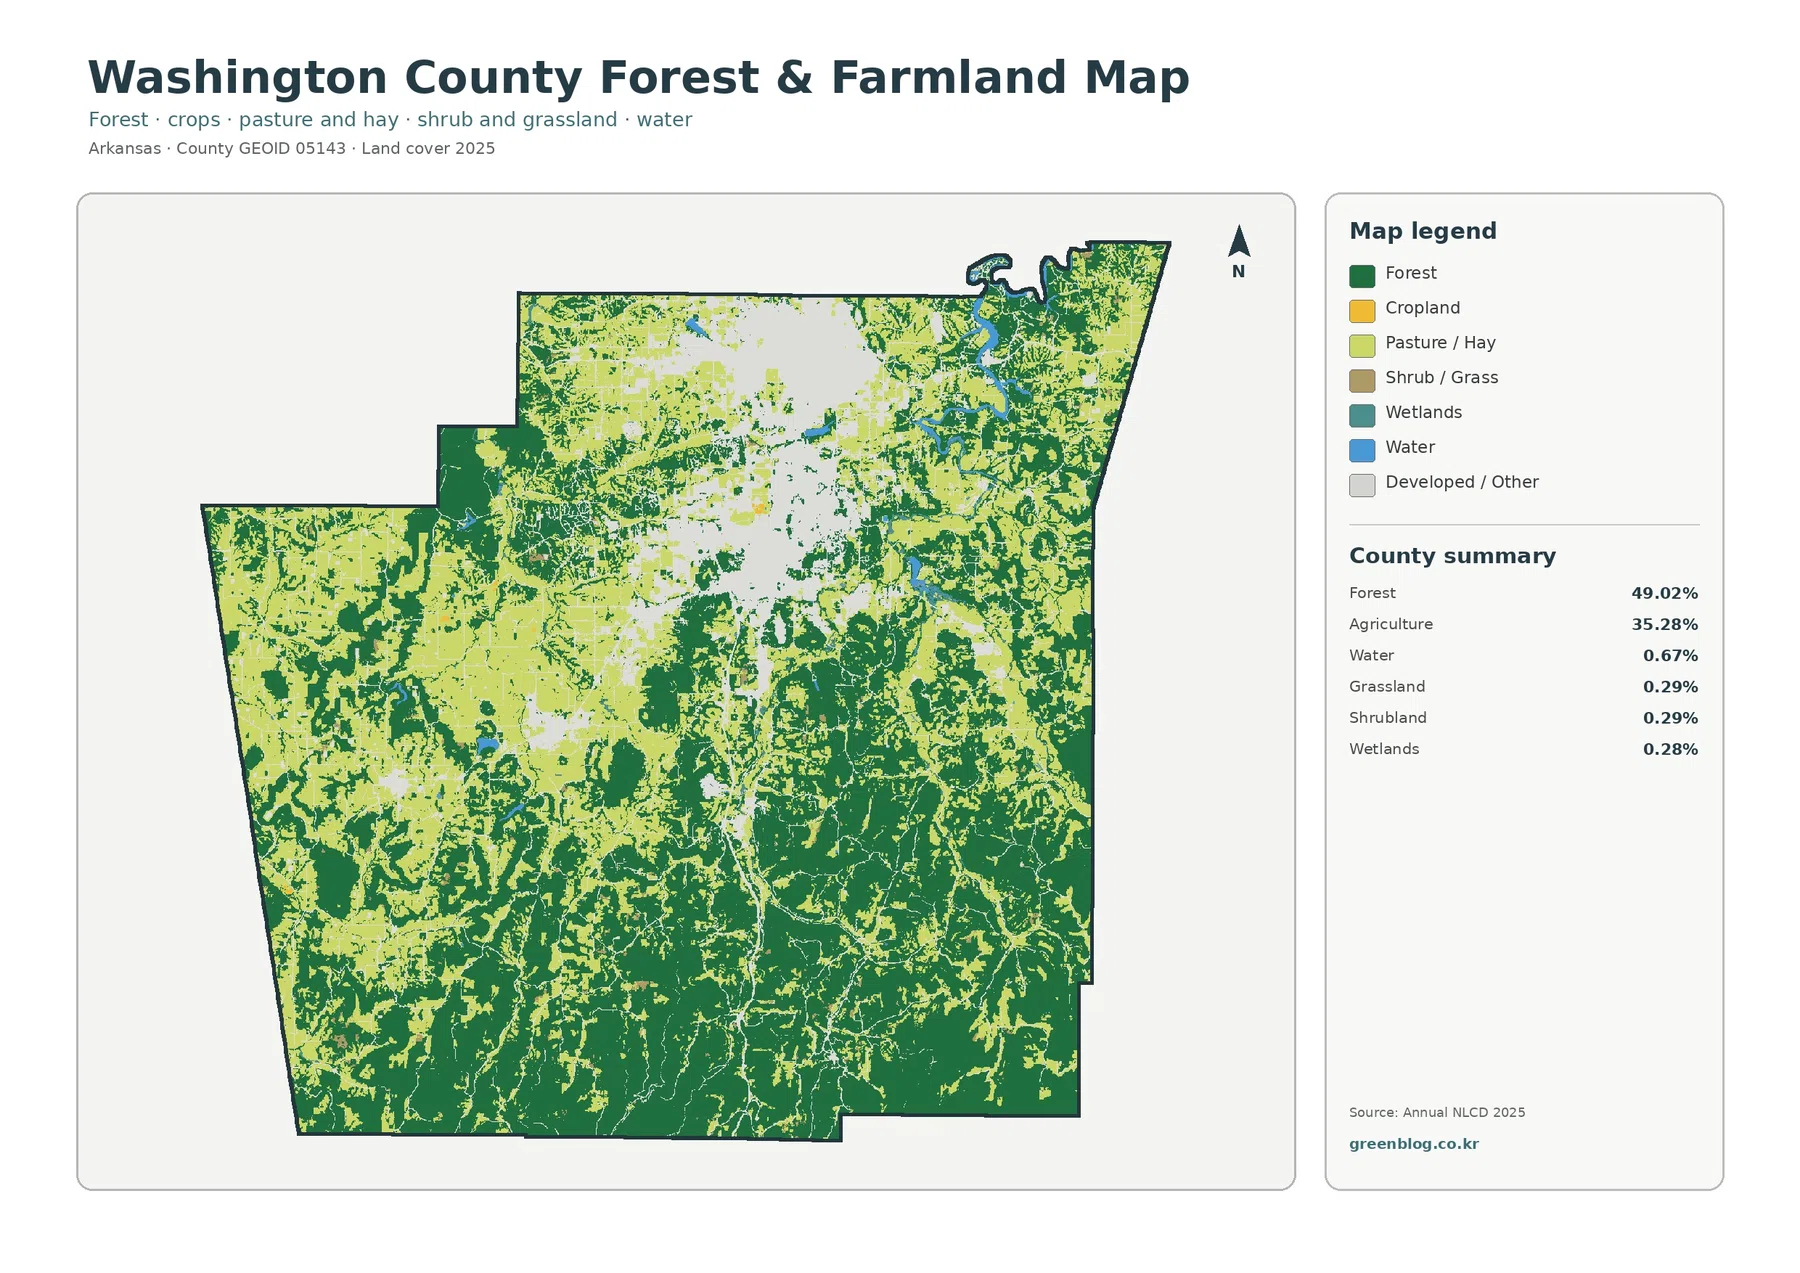
Forest is the largest 2025 class at 49.02%, yet Washington County does not look uniformly wooded. The strongest forest continuity appears through much of the south and southeast, with additional wooded areas in the east. In contrast, agricultural cover is more extensive across the west and northwest. The result is a county where the dominant land cover changes noticeably as the map moves from the urban north-central area toward rural sections in different directions.
Agriculture accounts for 35.28%, a share large enough to shape much of the county outside the urban core. The forest-and-farmland map is especially useful here because it reduces the distraction from the full set of classes and makes open agricultural areas easier to follow. Western fields and pasture-like areas form broad zones, while forest often appears as irregular strips and blocks within them. Southward, that balance reverses as larger forest areas become more continuous.
The University of Arkansas Cooperative Extension office in Washington County provides local programs on agriculture and natural resources, soil testing, livestock and forage, water conservation, and related topics. Those services confirm that agriculture remains an active part of the county’s landscape, but the map’s 35.28% agriculture category should not be read as a single crop or land-use type. The image combines agricultural cover classes, so a specific bright patch cannot be identified as a particular farm operation without more detailed data.
Small water and wetland percentages still add detail along local corridors
Water covers 0.67% of Washington County in the supplied 2025 summary. Barren land is 0.32%, while grassland and shrubland are each 0.29% and wetlands are 0.28%. None of these classes competes with forest, agriculture, or developed land at the county scale, but they add important local detail. Blue water cells and narrow wetland traces appear in places where the dominant forest, farm, or developed pattern is interrupted.
The 1985–2025 comparison is dominated by locations classified as developed
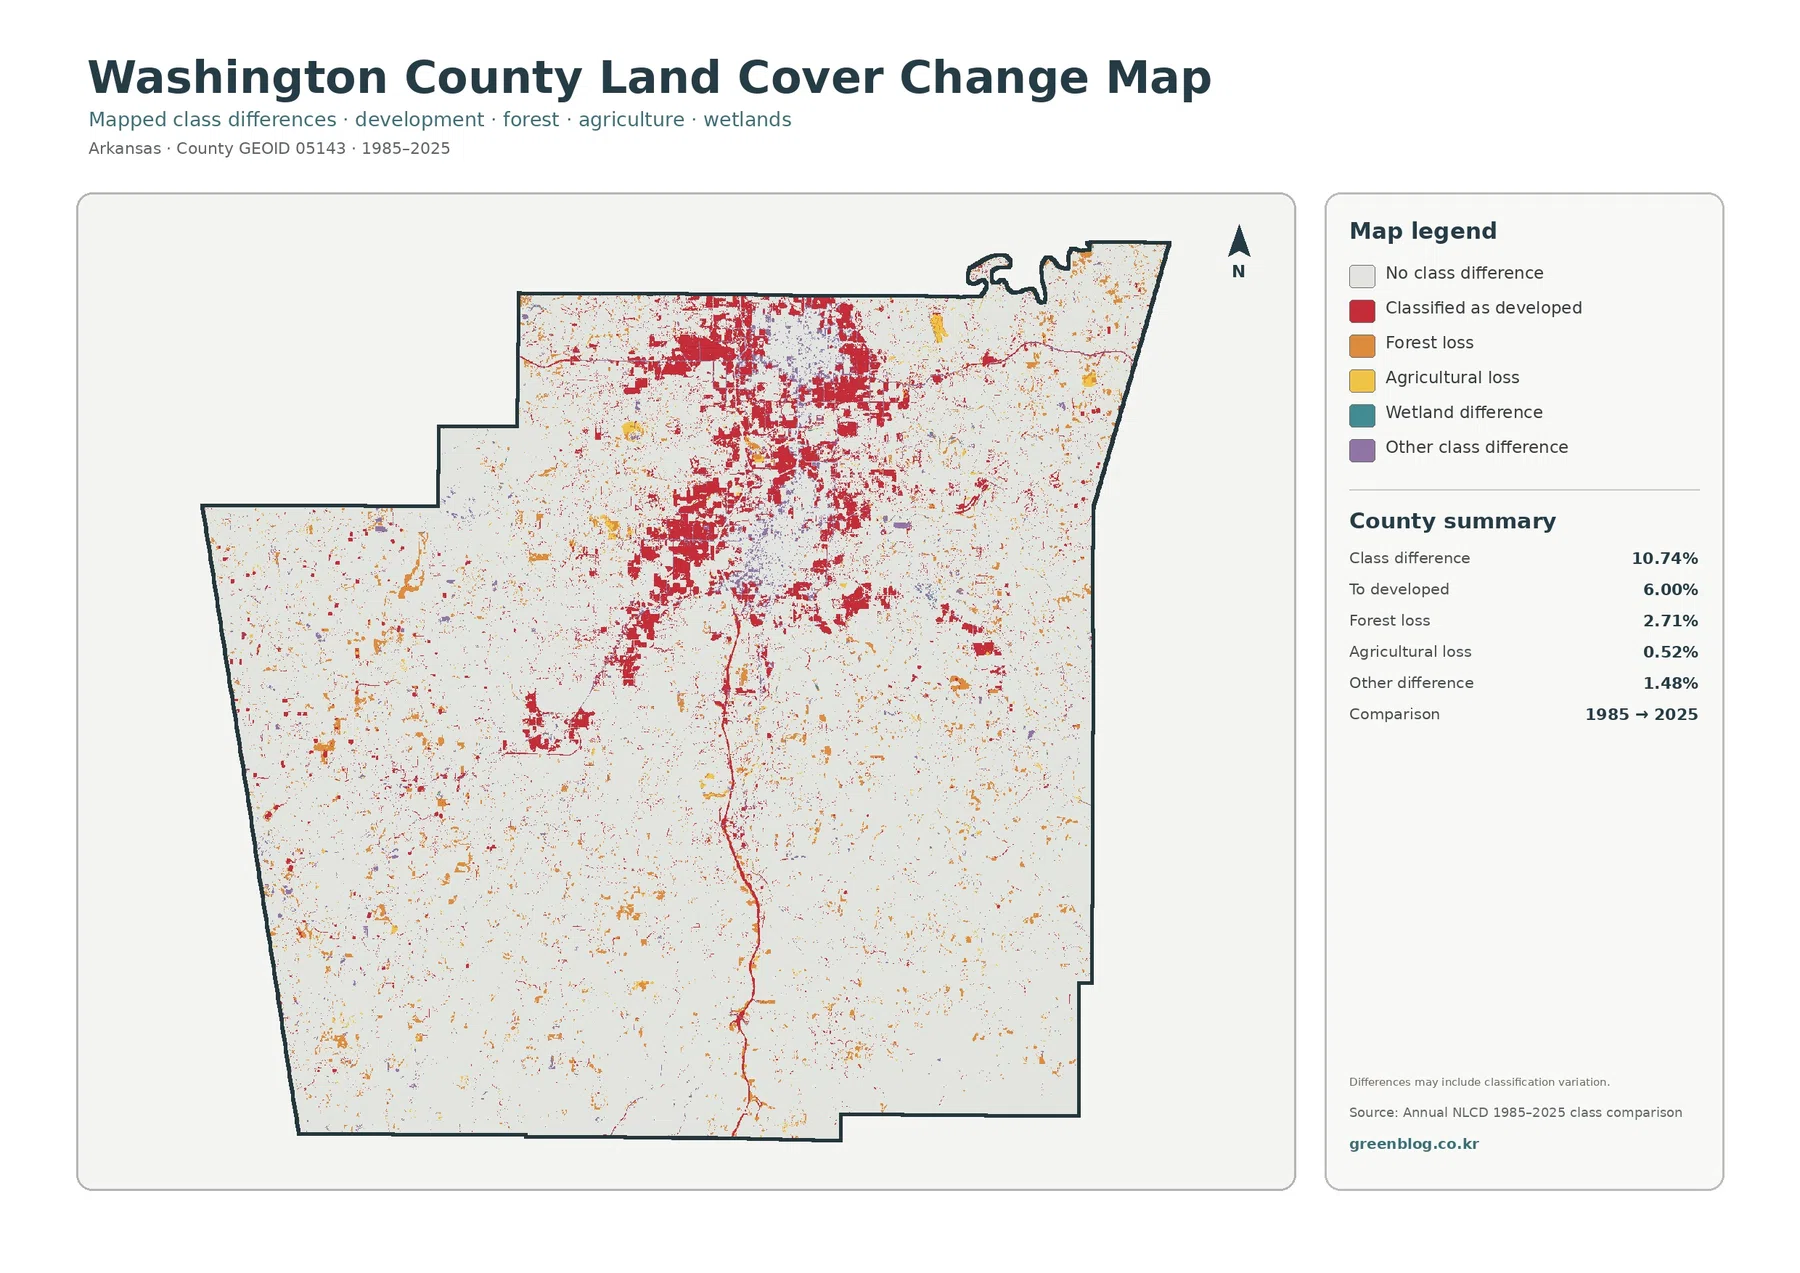
The change map reports a total mapped class difference of 10.74% between 1985 and 2025. The largest listed component is “to developed” at 6.00%, followed by forest loss at 2.71%, other class difference at 1.48%, and agricultural loss at 0.52%. These values describe cells whose classifications differ between the two comparison years; they are not the current percentages of those land-cover classes.
Red change cells are especially concentrated in the north-central part of the county and extend southward in narrower patterns. That distribution overlaps in part with the present-day developed and impervious concentrations, making the urban area the most obvious place to compare current cover with long-term class differences. Orange forest-loss cells and smaller other changes are more scattered across rural sections, while agricultural-loss markings occupy a smaller share overall.
A class difference should not automatically be treated as proof of a particular event. Satellite dates, vegetation condition, mixed pixels, and classification methods can all affect how a cell is labeled. The map itself notes that differences may include classification variation. For a specific tract, the safer approach is to use the change map to flag a location and then check dated aerial photography, county development records, or another time-specific source before drawing a conclusion about what happened there.
The map pattern also reflects Washington County’s position in the Ozarks
Washington County’s official background page places the county in the northwest corner of Arkansas in the Ozark Mountains. That regional setting is useful when reading the broad forest pattern, especially the larger wooded areas in the south and east. At the same time, the map shows that the county cannot be summarized simply as mountainous forest: agricultural cover is extensive in the west and northwest, and a substantial metropolitan footprint occupies the north-central area.
Land cover should not be confused with zoning, ownership, or development permission
Land cover describes what the surface is classified as—forest, agriculture, water, developed land, and related categories. It does not establish who owns a parcel, how a property is zoned, whether construction is allowed, or where a legal wetland boundary lies. A field mapped as agriculture is not automatically an agricultural zoning designation, and a developed class does not mean additional development is permitted.
That distinction matters in Washington County because urban and rural cover meet across many parts of the map. The county Planning office handles land-development review outside city limits and provides GIS information for local planning questions. Anyone using these maps for a property decision should treat the land-cover set as regional context and then consult the current local records that match the actual question.
A simple reading order keeps current conditions separate from long-term change
For a first review, start with the current land-cover map and identify the three large components: north-central development, southern and eastern forest, and western or northwestern agriculture. Next, use the forest-and-farmland view to simplify the rural landscape. If the focus is urban form, move to the impervious map and compare the 13.85% developed class with the smaller hard-surface concentrations.
Only after the current pattern is clear does the 1985–2025 map become easy to interpret. The 6.00% “to developed” category then reads as a change measure rather than as the present urban share. The same logic applies to forest loss and agricultural loss. In a classroom or presentation, placing all four maps side by side makes these distinctions easier to explain because every image uses the same county outline.
Thirty-meter land-cover cells are useful for county patterns, not parcel boundaries
Annual NLCD land cover is built as a raster, meaning the landscape is divided into grid cells and each cell receives a representative classification. At roughly 30 meters, one cell can contain more than one real-world surface: trees beside a road, lawn around a building, or a field edge next to woodland. The classification simplifies that mixture to a single mapped class.
Download the four JPG maps for side-by-side use
The WebP images on the page are convenient previews, while the ZIP contains one JPG for each of the four map views. Each supplied JPG is 2480×1754 pixels. That is the original size in this package and is below an A3 high-resolution reference, so very large printing should be tested for sharpness first. For screen comparison, ordinary printing, classroom handouts, and presentation layouts, the files can be resized to suit the project.
Frequently Asked Questions
Why does Washington County show so much developed land compared with many rural Arkansas counties?
The 2025 map shows a broad north-central developed concentration associated with the Fayetteville–Springdale urban area. Developed land totals 13.85%, while the south and east remain much more forested and western sections contain extensive agricultural cover.
Is the 4.08% mean impervious value the same as the 13.85% developed share?
No. Developed land can include lawns, trees, soil, and other permeable surfaces around buildings and roads. Impervious surface focuses on pavement, rooftops, parking lots, and similar hard surfaces, so its countywide mean is lower.
Does the 6.00% to-developed value mean 6% of Washington County is currently urban?
No. The 6.00% figure belongs to the 1985–2025 change comparison and represents cells classified as developed in the mapped difference categories. Current developed cover is a separate 13.85% value.
Sources and reference material
Percentages and 1985–2025 difference values in this article come from the supplied Washington County map package. The official resources below provide the classification framework, county background, local planning context, agricultural information, and administrative boundary data used for further reference.
- MRLC Annual NLCD Data — official access to Annual NLCD land-cover products and supporting data.
- USGS Annual NLCD Land Cover Classification — explains the forest, agriculture, developed, water, wetland, and other mapped classes.
- Washington County, Arkansas – About the County — official county background on its Ozark location and metropolitan context.
- Washington County Planning — current information on development review outside city limits, planning GIS, subdivisions, and related processes.
- University of Arkansas Cooperative Extension – Washington County — local agriculture, natural resources, soil, livestock, forage, and water-conservation services.
- U.S. Census Bureau TIGER/Line Shapefiles — official administrative boundary data used for county mapping.
Map File Information
Washington County Land Cover Map Files
- File Type: ZIP containing 4 JPG files
Related Maps
- A Craighead County Arkansas Land Cover Map
- Arkansas County Arkansas Land Cover Map
- Ashley County Arkansas Land Cover Map
Green Map creates custom-edited map images using open geographic data sources such as geoBoundaries, Natural Earth, OpenStreetMap, and government open data.
These maps are edited visual materials, not raw data files, and are provided for education, documents, presentations, and graphic reference.