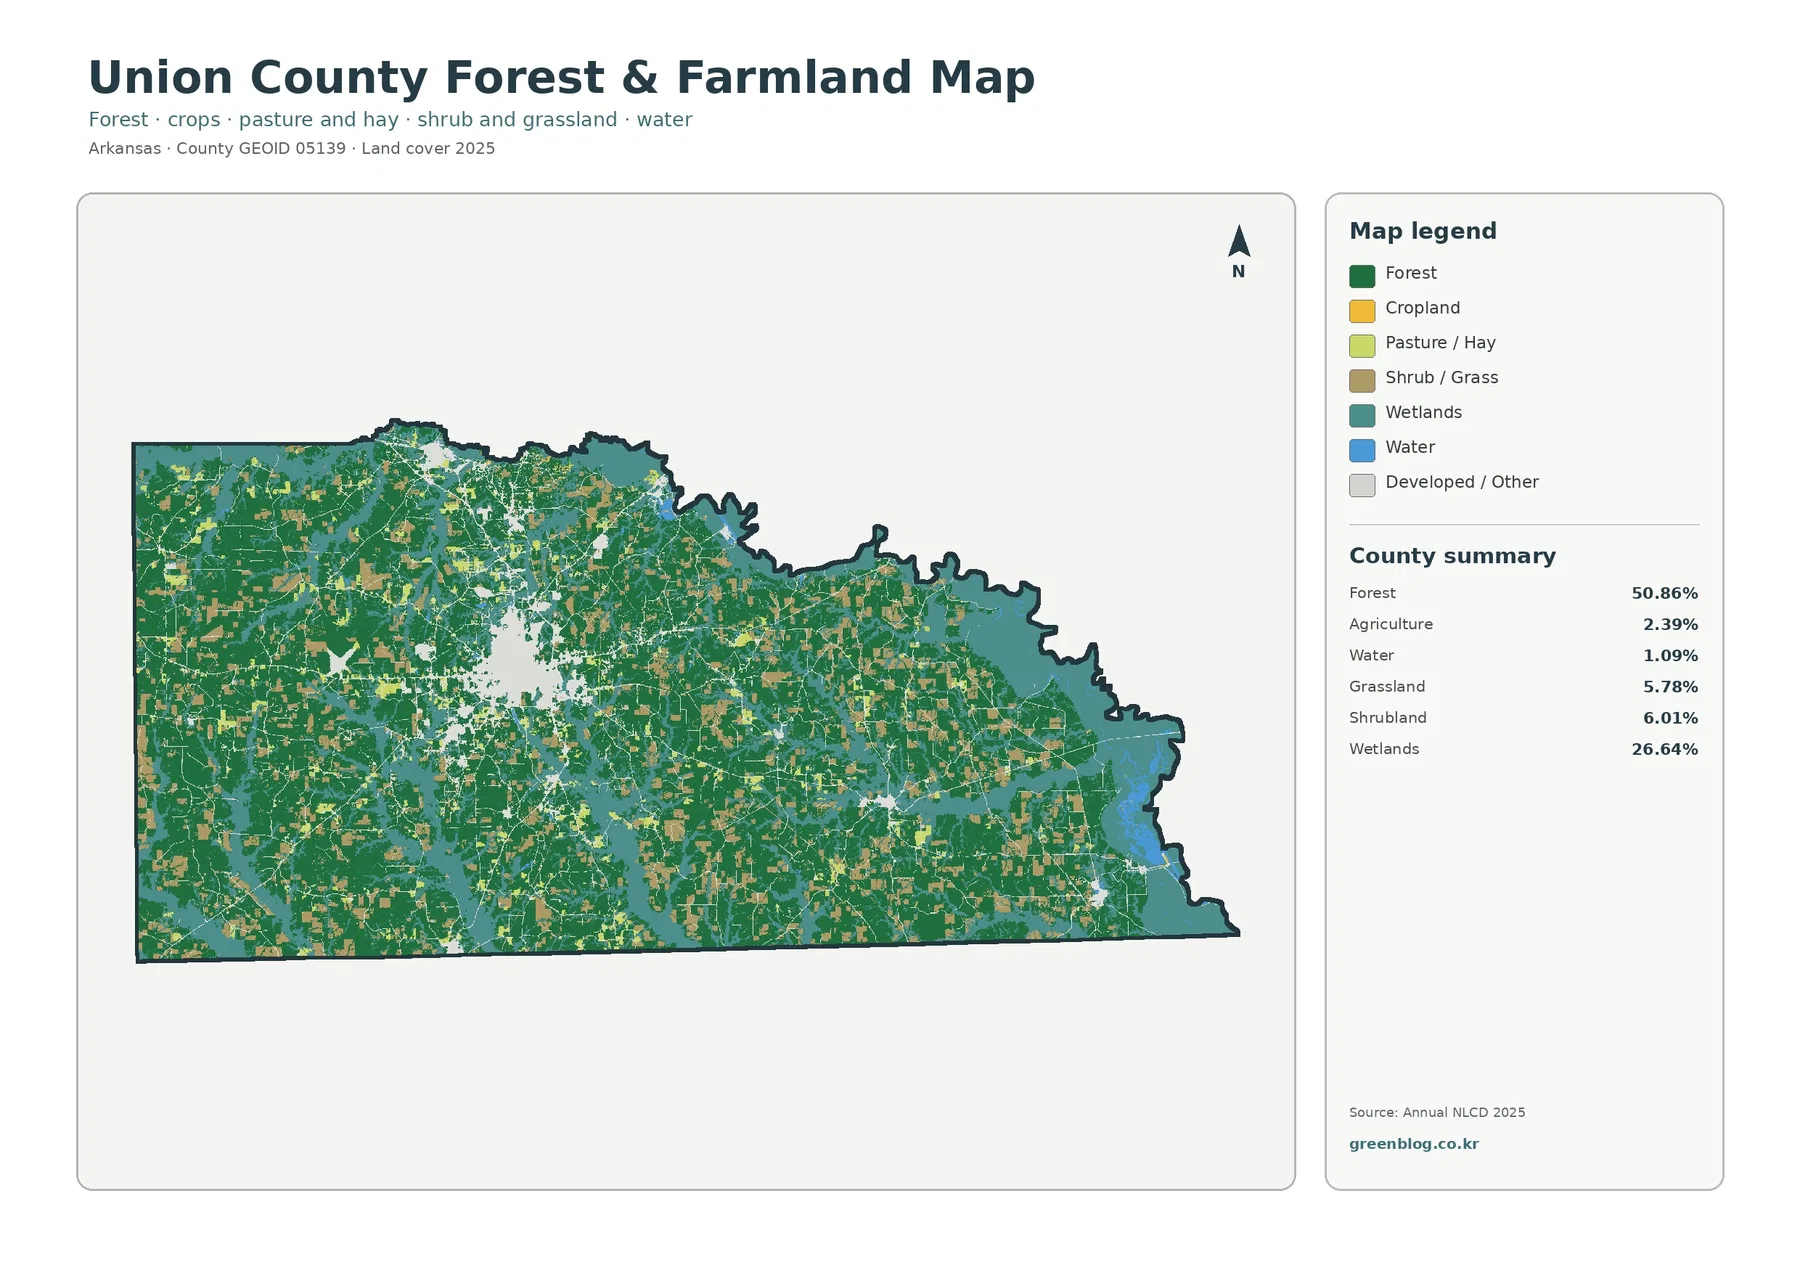
Union County sits on Arkansas’s south-central border, and its 2025 land-cover pattern is defined by two large categories rather than one. Forest covers 50.86 percent of the county, while wetlands account for another 26.64 percent. The broad wetland areas along the eastern and northern side stand out almost as strongly as the forest, while the largest developed concentration is clustered around the El Dorado area.
The four maps on this page separate that landscape into views for general land cover, forest and farmland, impervious surface, and class differences from 1985 to 2025. They are useful for comparing the river-influenced eastern side with the more forested interior and for seeing how the El Dorado built area differs from the rest of the county. The four original JPG maps are also available together in one ZIP download.
Table of Contents
Union County is green and wet before it is urban
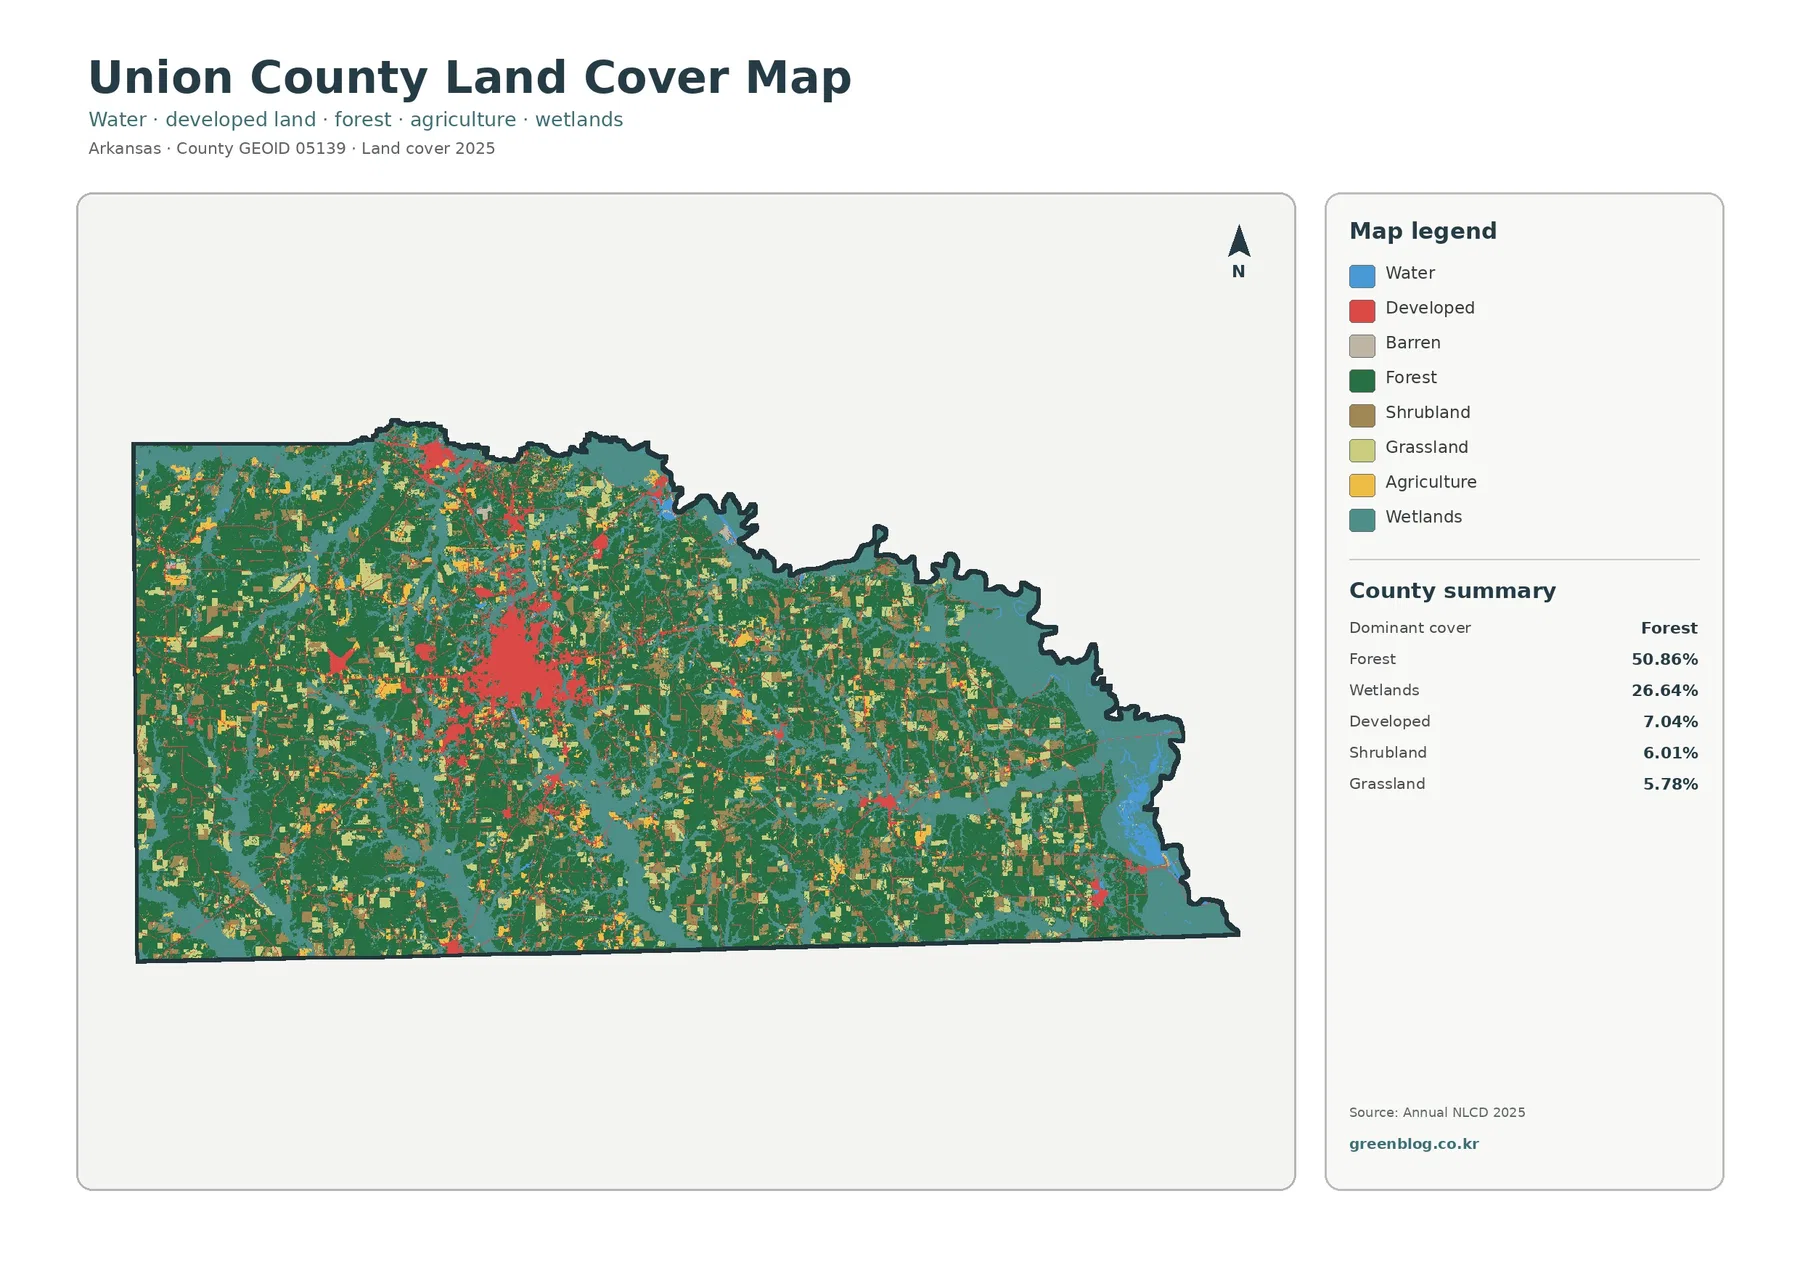
The general map gives the clearest first impression. Forest is the largest 2025 class at 50.86 percent, but wetlands are unusually prominent at 26.64 percent. Developed cover makes up 7.04 percent, shrubland 6.01 percent, and grassland 5.78 percent. Agriculture is 2.39 percent and water is 1.09 percent. The result is not a simple forest-versus-city pattern: large wetland areas, open classes, and a compact urban center all interrupt the forest in different ways.
The El Dorado cluster is easy to find, but hard surfaces cover a much smaller share
The largest developed patch appears in the central-western part of the county. Union County’s official site identifies El Dorado as the county seat, and the University of Arkansas Cooperative Extension office for Union County is also based there. That makes the large central cluster useful for orienting the map even though the land-cover image itself does not label streets or neighborhoods. Smaller developed marks appear elsewhere, but none approaches the size or density of the El Dorado area.
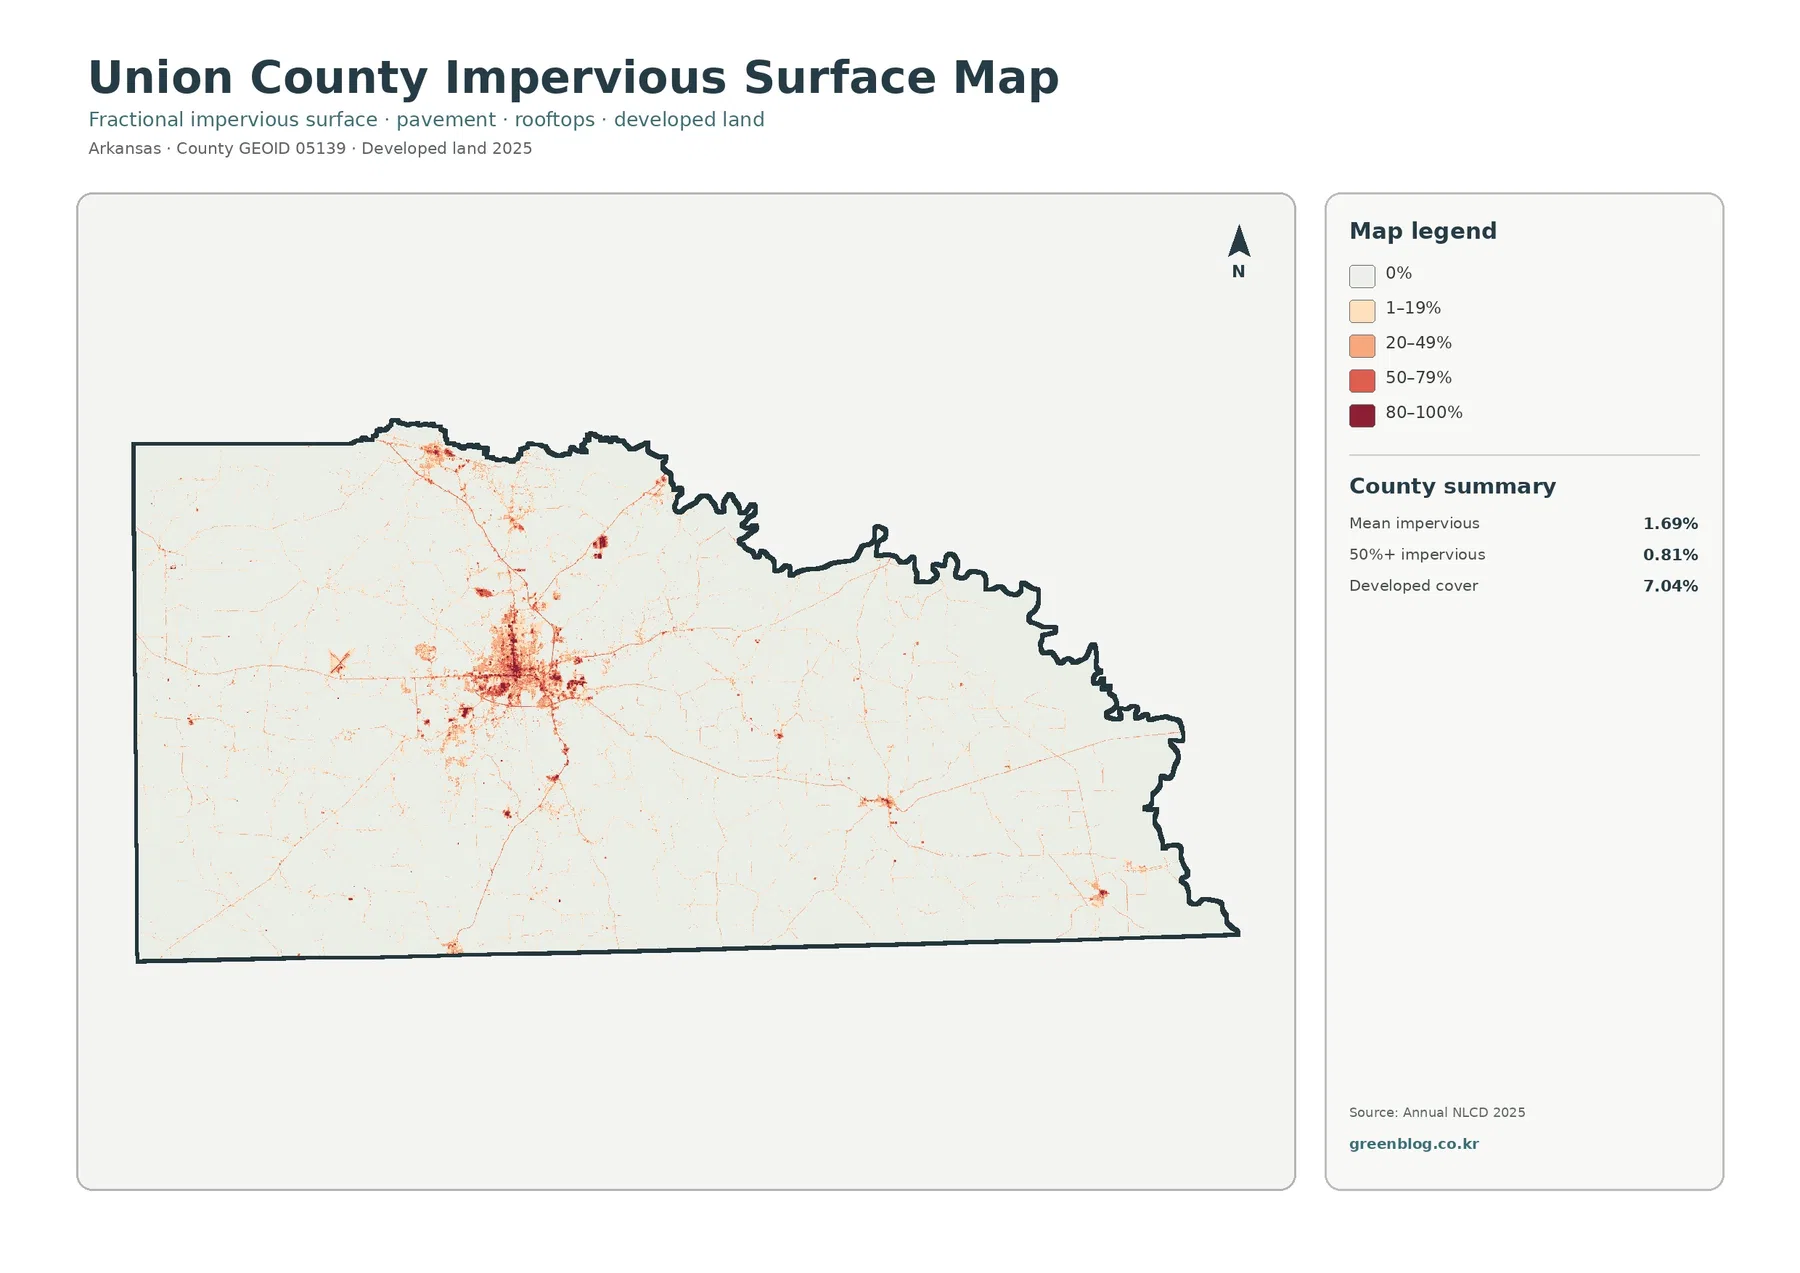
Impervious surface means pavement, rooftops, parking areas, and similar hard materials that do not readily absorb water. The impervious map makes the contrast much sharper than the general map. Most of Union County stays in the lightest categories, while the El Dorado area forms a compact group of orange and red cells. Thin traces extend outward from that core and resemble road-and-development corridors, although no road names are printed on this map. A few smaller clusters appear to the north and toward the southeast, which is consistent with a county that has several towns but one much larger built center.
Agriculture is a small class; grass and shrub add more of the open ground
The forest-and-farmland map simplifies the legend enough to make the county’s open areas easier to compare. Agriculture accounts for 2.39 percent of Union County, much less than forest or wetlands. Grassland covers 5.78 percent and shrubland 6.01 percent, so a visitor who looks only for cropland colors would miss a substantial share of the nonforested open surface. Water, at 1.09 percent, appears as narrow channels and small water bodies within the larger wetland setting.
The Ouachita and Felsenthal context helps explain why wetlands matter here
Felsenthal National Wildlife Refuge adds another useful piece of verified context. The U.S. Fish and Wildlife Service describes the refuge as a 76,000-acre landscape dominated by the Ouachita and Saline Rivers and an intricate system of rivers, creeks, swamps, lakes, bottomland hardwood forest, and upland forest. A Fish and Wildlife Service planning document places parts of the refuge in Union County as well as neighboring counties. These sources help explain the importance of wetland and bottomland environments in the region.
The 1985–2025 layer is a locator for change, not a complete history
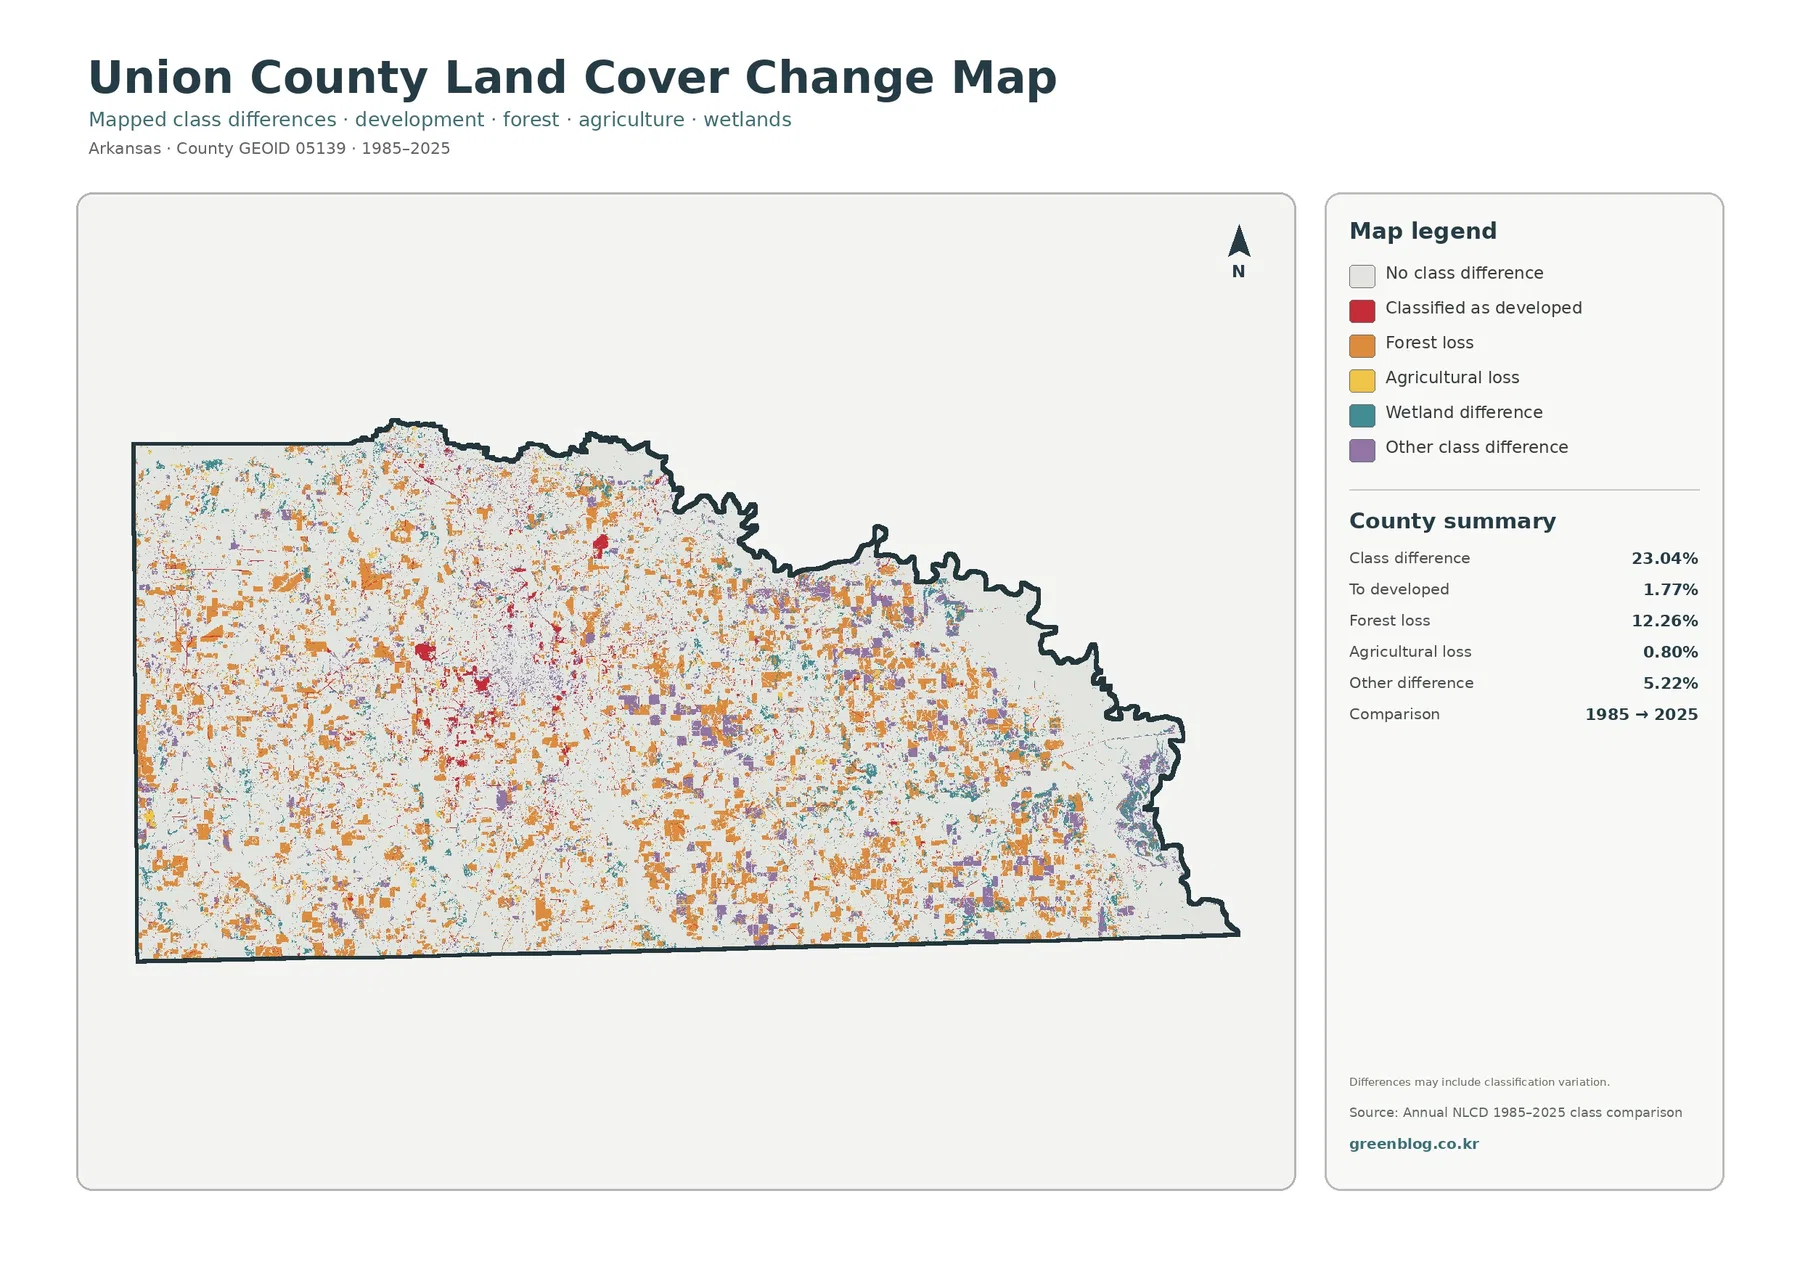
The change map compares classifications from 1985 and 2025 and reports class differences across 23.04 percent of Union County. Forest loss is the largest listed component at 12.26 percent. Areas classified to developed account for 1.77 percent, agricultural loss for 0.80 percent, and other class differences for 5.22 percent. Wetland differences are also mapped as a separate color, but the summary panel does not print a percentage for that category, so no additional number should be inferred from the graphic.
None of those colors automatically proves a specific event such as logging, subdivision construction, drainage, or farm abandonment. The map itself warns that class differences may include classification variation. Seasonal conditions, sensor differences, updated processing, and mixed pixels can all change the assigned class even when a site has not experienced a simple one-way conversion.
A useful reading sequence depends on the question
If the goal is to compare rural land surfaces, move next to the forest-and-farmland map. It shows that agriculture itself is only 2.39 percent and that grassland and shrubland contribute more open cover than cropland or pasture categories combined in the summary. If the goal is urban form, skip directly to the impervious map and compare the 7.04 percent developed class with the much smaller 1.69 percent mean impervious figure.
Scale, 30-meter cells, and the limits of a countywide land-cover product
Annual NLCD products are designed for consistent regional and national comparison. At the commonly used 30-meter raster scale, each grid cell represents an area larger than many individual structures, narrow roads, small ponds, or thin stream banks. A cell near a forest edge may contain trees, pavement, and grass at the same time but still receive one representative class. This mixed-pixel effect is normal in a countywide raster dataset.
For that reason, the Union County maps should not be treated as property, zoning, wetland-jurisdiction, or engineering maps. A developed pixel does not establish that construction is permitted. A wetland pixel does not replace a regulatory wetland determination. A forest pixel does not identify a timber owner or management plan. The maps are strongest when the question concerns broad pattern, comparison, or where to begin a more detailed investigation.
The dates matter as much as the scale. The current maps summarize 2025 land cover, while the change layer compares 1985 with 2025. Development, forest management, storm effects, vegetation recovery, or water changes after 2025 will not appear. Older and newer classifications can also differ because the underlying imagery and processing methods evolved, which is another reason to confirm important site-level conclusions with current local data.
Frequently Asked Questions
Why does Union County show so much wetland cover?
Wetlands make up 26.64 percent of the 2025 summary and are especially prominent toward the north and east. The county’s official website notes that the Ouachita River borders much of those sides, and Felsenthal refuge sources describe a regional landscape of rivers, swamps, lakes, and bottomland forest.
Is El Dorado the main developed concentration on these maps?
Yes. The largest developed and impervious cluster is centered in the El Dorado area. Developed cover is 7.04 percent countywide, while mean impervious surface is 1.69 percent, showing that the broader developed class includes many surfaces that are not fully paved or built over.
Does 23.04 percent class difference from 1985 to 2025 mean that much of the county was permanently converted?
No. The figure combines several mapped class differences, including forest loss, areas classified to developed, agricultural loss, wetland differences, and other differences. Classification variation can also contribute, so a specific location should be checked with historical imagery or local records. Map File Information The download combines the four original Union County JPG maps in one ZIP file. Use the WebP previews on the page for a quick comparison, then use the JPG set when you need larger graphics for printing, teaching, presentations, watershed or land-cover comparison, and personal reference.
Sources and reference material
- MRLC Annual NLCD Data — Source portal for Annual NLCD land-cover data used for current and long-term comparison.
- USGS Annual NLCD Land Cover Classification — Official explanation of national land-cover classes such as forest, wetlands, and developed land.
- Union County, Arkansas official website — County information on the Ouachita River boundary, El Dorado, timberland, and local geography.
- University of Arkansas Cooperative Extension – Union County — Local agriculture and natural-resource services for El Dorado and other Union County communities.
- U.S. Fish & Wildlife Service – Felsenthal National Wildlife Refuge — Official background on the river, swamp, lake, wetland, and forest environments associated with the refuge.
- U.S. Census Bureau TIGER/Line Shapefiles — Official source for county boundary geometry used in mapping workflows.
Map File Information
Download the map files associated with this page for reference, printing, and compatible visual projects.
- Included Files: Use only the versions confirmed in the article and supplied images
- File Type: Use the confirmed download contents
- Intended Use: Printing, education, presentations, and map-based projects
Related Maps
- A Craighead County Arkansas Land Cover Map
- Arkansas County Arkansas Land Cover Map
- Ashley County Arkansas Land Cover Map
Green Map creates custom-edited map images using open geographic data sources such as geoBoundaries, Natural Earth, OpenStreetMap, and government open data.
These maps are edited visual materials, not raw data files, and are provided for education, documents, presentations, and graphic reference.