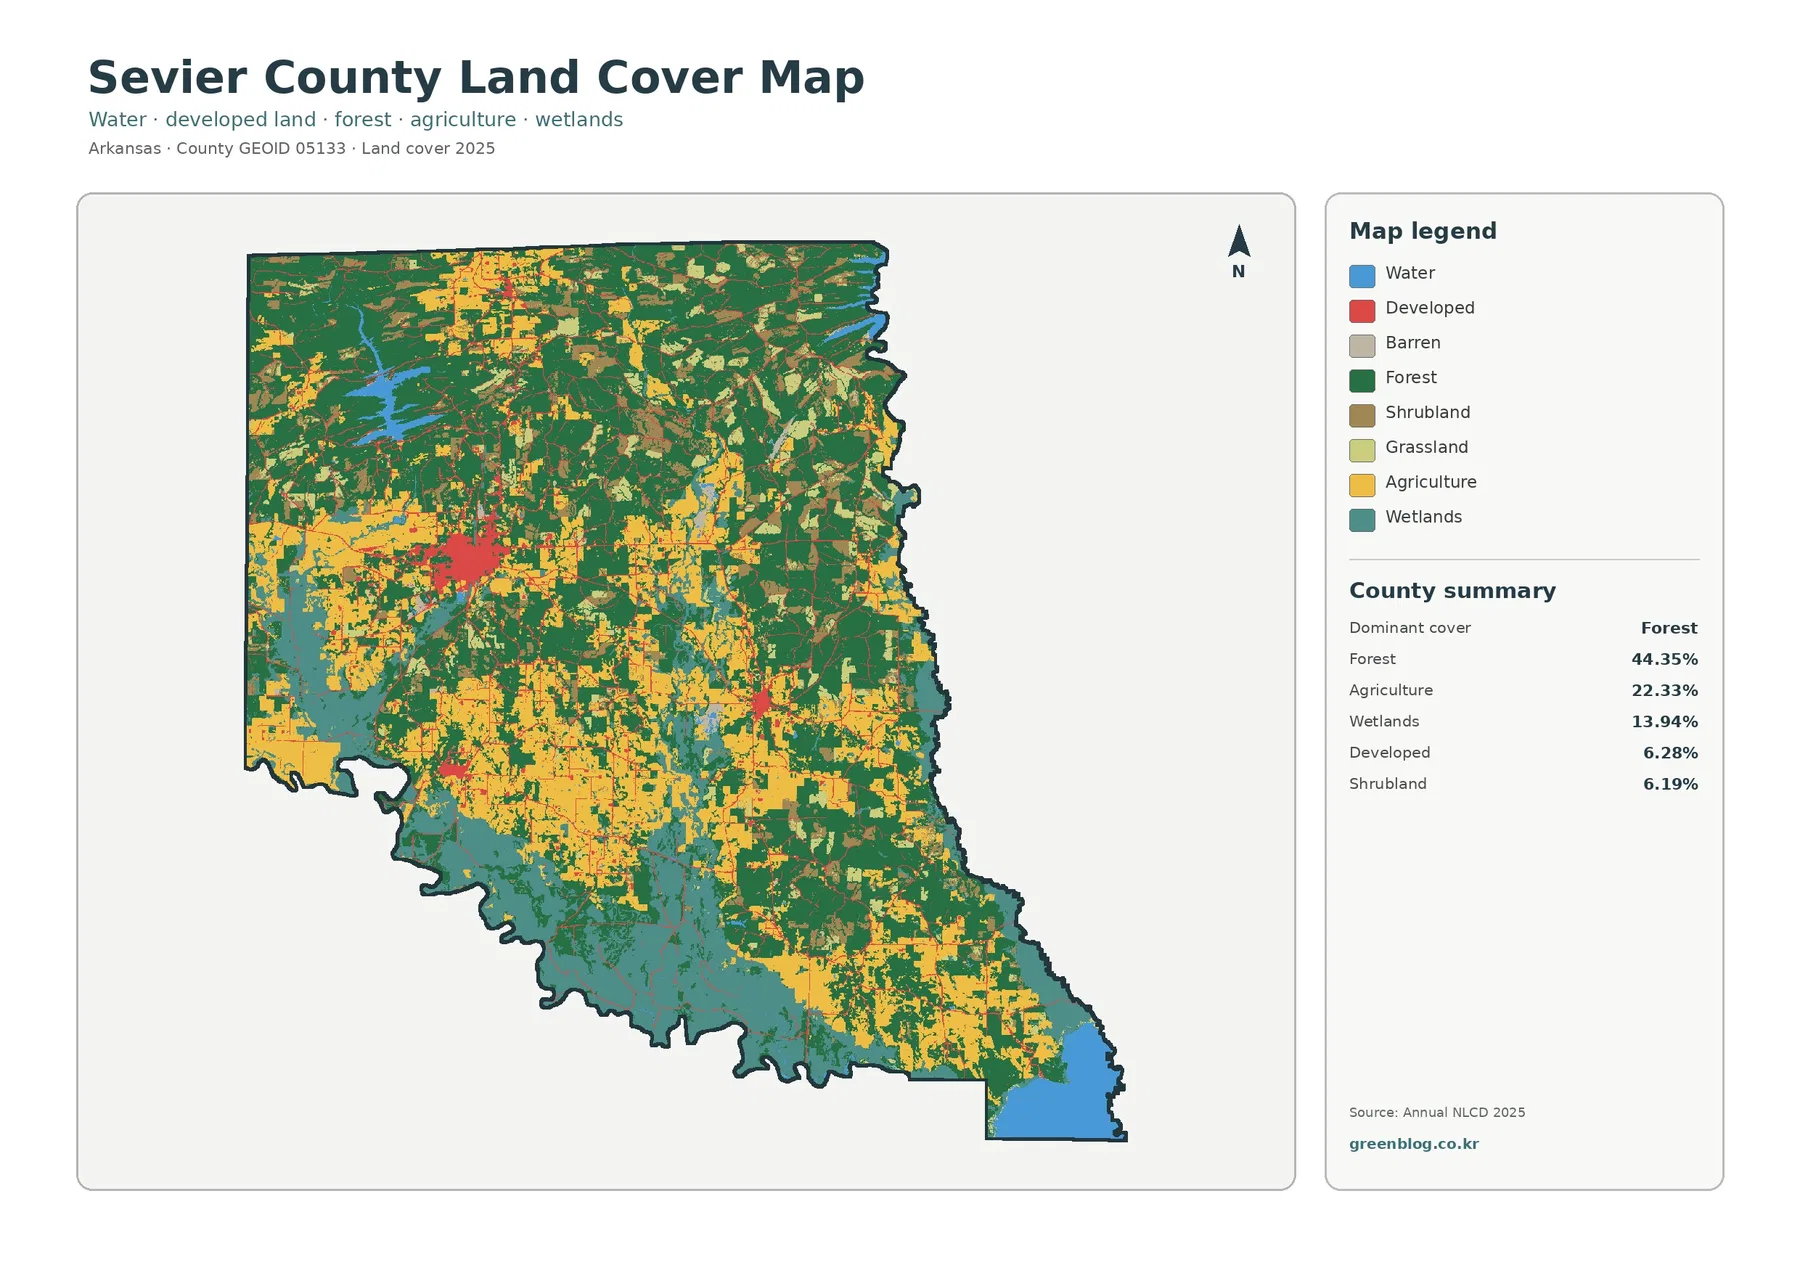
Sevier County stands out because forest, agriculture, wetlands, and developed land all occupy meaningful portions of the 2025 map. Forest leads at 44.35%, agriculture accounts for 22.33%, wetlands 13.94%, developed land 6.28%, and shrubland 6.19%. The county’s visual pattern is split between a strong developed concentration around De Queen, extensive wooded areas farther north and east, and wetland-rich lowlands toward the south.
Four views are provided here: current land cover, forest and farmland, impervious surface/developed land, and a 1985–2025 class comparison. The article uses WebP previews for reading on the page, while the four original JPG maps are available together in one ZIP below. Land cover describes the mapped surface; it does not establish parcel boundaries, ownership, zoning, or legal development rights.
Table of Contents
De Queen is the clearest built-up center, but hard surfaces remain limited countywide
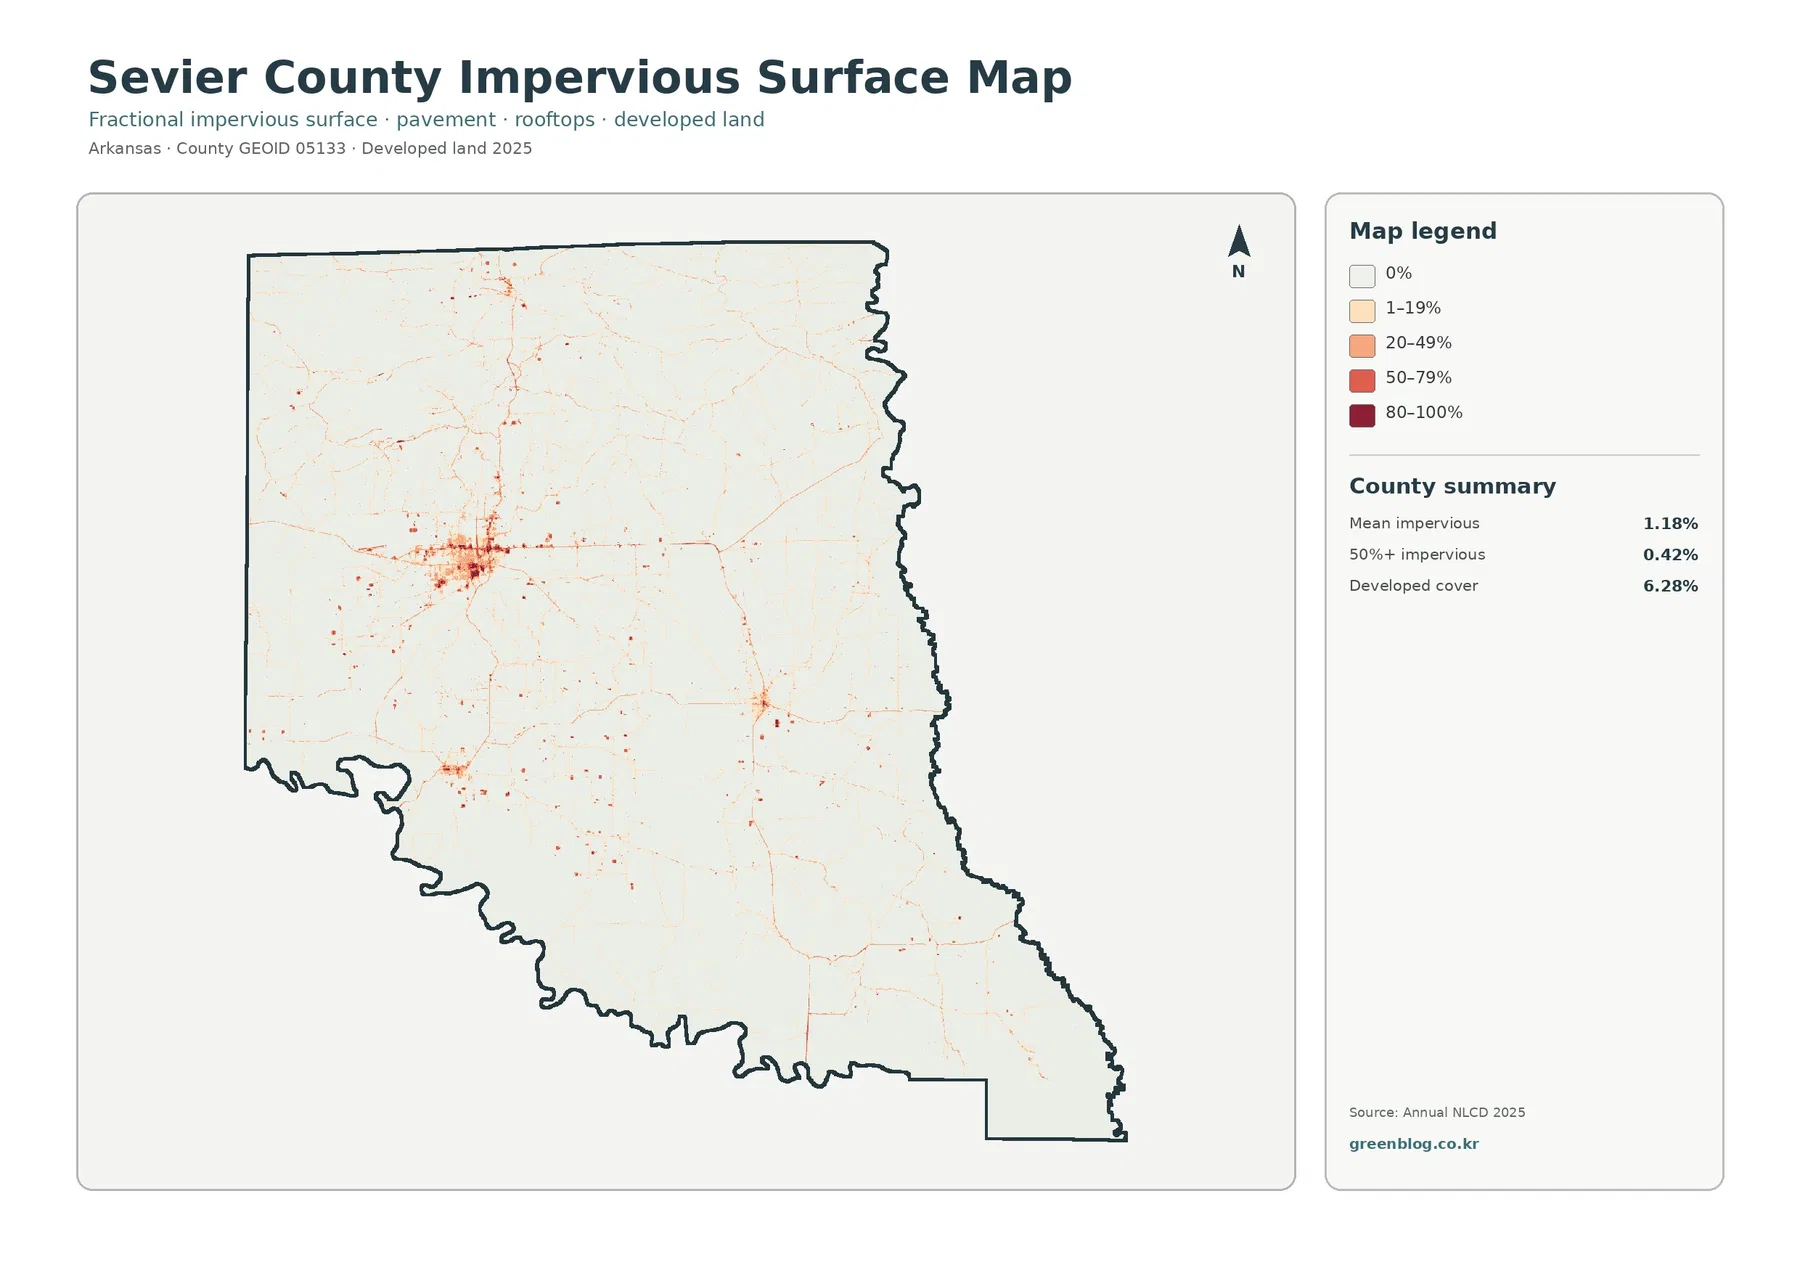
The impervious-surface map makes Sevier County’s settlement pattern easy to recognize. A dense cluster of orange and red cells appears around De Queen in the west-central part of the county. Encyclopedia of Arkansas material identifies De Queen as the county seat and largest community, located where U.S. 70 and U.S. 71 meet. The preview does not label individual roads, so the safest reading is that hard surfaces concentrate in the city and along several transportation corridors radiating from it.
Mean imperviousness is only 1.18%, and just 0.42% of the county is mapped at 50% or greater impervious surface. Those values are lower than the 6.28% developed-land share because a developed class can contain lawns, trees, bare ground, and other permeable surfaces around buildings and streets. Imperviousness is a more direct measure of hard surface, while developed land is a broader land-cover category.
Smaller hard-surface clusters appear east of De Queen and in the southwestern part of the county, with thin lines connecting scattered points elsewhere. Most of Sevier County remains white or pale on this map. The countywide mean therefore should not be applied to the urban core itself. Individual cells in De Queen can have high impervious values even though forest, farmland, wetlands, and water keep the county average low.
Impervious cover is useful for comparing the built footprint, but it is not a flood-risk map. Southern Sevier County has broad wetlands and water even where hard surfaces are minimal. Drainage and flooding depend on terrain, streams, soils, rainfall, and infrastructure in addition to pavement and rooftops.
The general land-cover map shifts from wooded uplands to a wetland-rich southern edge
Forest covers 44.35% of Sevier County and forms large blocks across much of the north, east, and center. Agricultural cover interrupts those blocks in irregular fields and broader open areas, especially through the middle and southern portions. Unlike a county dominated by a single forest mass or a single farm plain, Sevier County has several large classes meeting across short distances.
Wetlands are the map’s most distinctive secondary feature. They account for 13.94% of the 2025 summary and are concentrated heavily in the southern third of the county, with additional wetland corridors along the eastern side. Water covers 2.91%, with a large open-water area at the southeastern tip and another prominent lake farther northwest of the county center.
County-specific references help explain why water and wetlands occupy so much visual space. County hydrography described by the Encyclopedia of Arkansas places the Little River along the southern boundary, the Saline River on the east, and the Cossatot and Rolling Fork rivers on north-to-south courses. The same reference identifies Millwood Lake in the southeast and lists De Queen Lake and Dierks Lake among the area’s reservoirs. These sources do not replace the map, but they give names to the hydrologic setting that matches the broad southern wetland and water pattern.
Developed land is 6.28%, most clearly visible around De Queen. Smaller red patches appear elsewhere, but they are separated by forest, agriculture, shrubland, and wetlands rather than forming one continuous urban corridor. Shrubland adds another 6.19%, so some places that look like transitions between forest and farm are neither of those two main classes.
Forest and agriculture form a patchwork rather than a clean north-south boundary
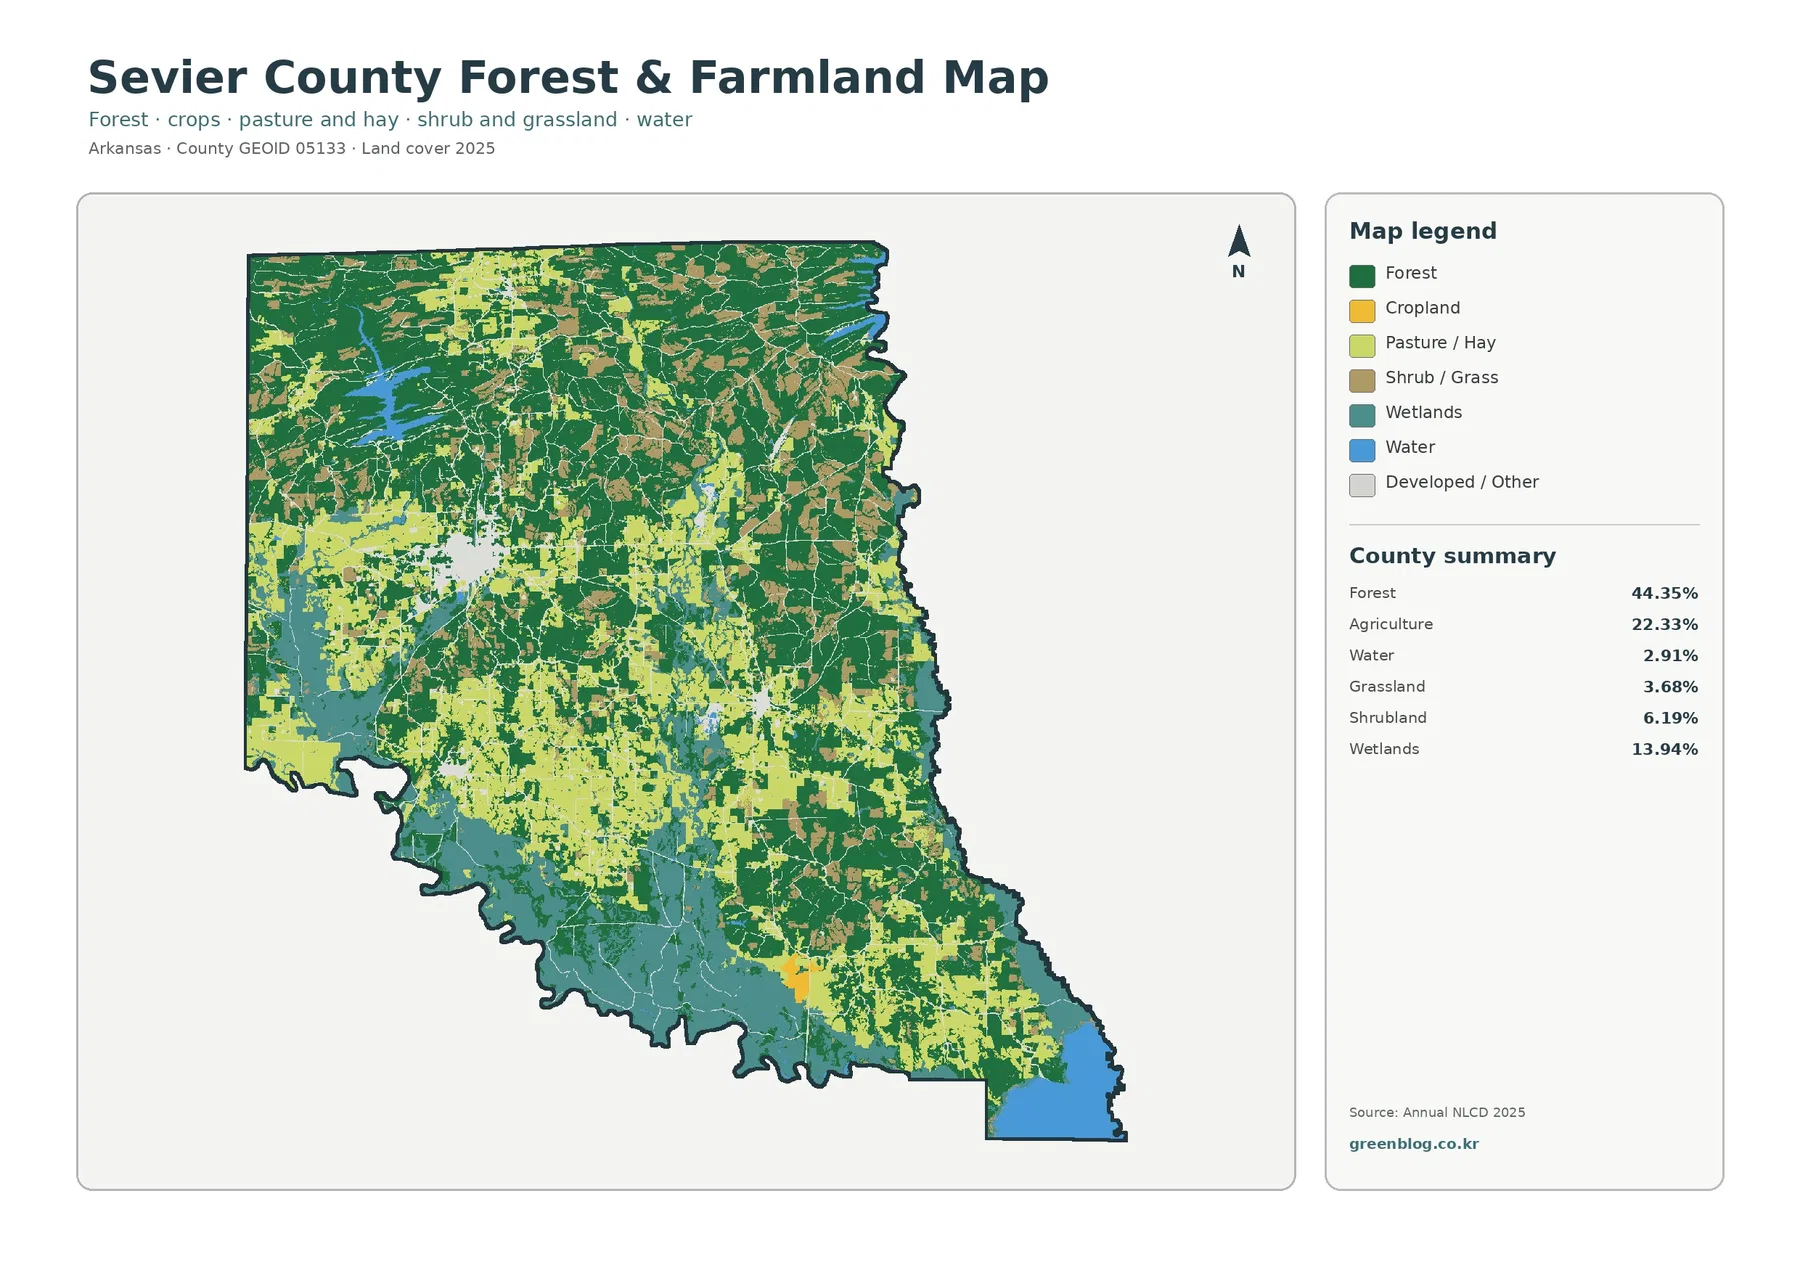
The forest-and-farmland view removes much of the developed-color detail and makes the rural pattern easier to compare. Forest remains strongest in the northern and eastern parts of the county, but agricultural and pasture-like areas are embedded throughout the center and south. The open land is not arranged as one uninterrupted belt. It widens around some areas, narrows between forest blocks, and mixes with shrub or grass cover along many edges.
Agriculture accounts for 22.33% of the county, while grassland is 3.68% and shrubland 6.19%. Those smaller categories matter because they explain why the landscape does not separate neatly into green forest and yellow farm fields. In several central and northern areas, open cover forms a fine-grained mixture around wooded blocks. Farther south, wetlands enter the same mosaic and make the transition even more complex.
A county overview from the Association of Arkansas Counties describes the north as more rugged and the south as rolling terrain, and it lists timber, livestock, and poultry among local economic activities. That land-cover image does not map industries or elevation directly, so those facts should not be used to assign a specific patch to a specific activity. Taken together, those facts support a county context in which forest and working rural land are both prominent.
The 44.35% forest share explains the overall green appearance, but the 22.33% agricultural share is large enough to break forest continuity across much of the county. In the south, the 13.94% wetland share becomes just as important as agriculture for understanding what surrounds the forest. This is why the simplified forest-and-farmland view is most useful when read beside the general map rather than by itself.
A 33.55% class difference from 1985 to 2025 needs careful interpretation
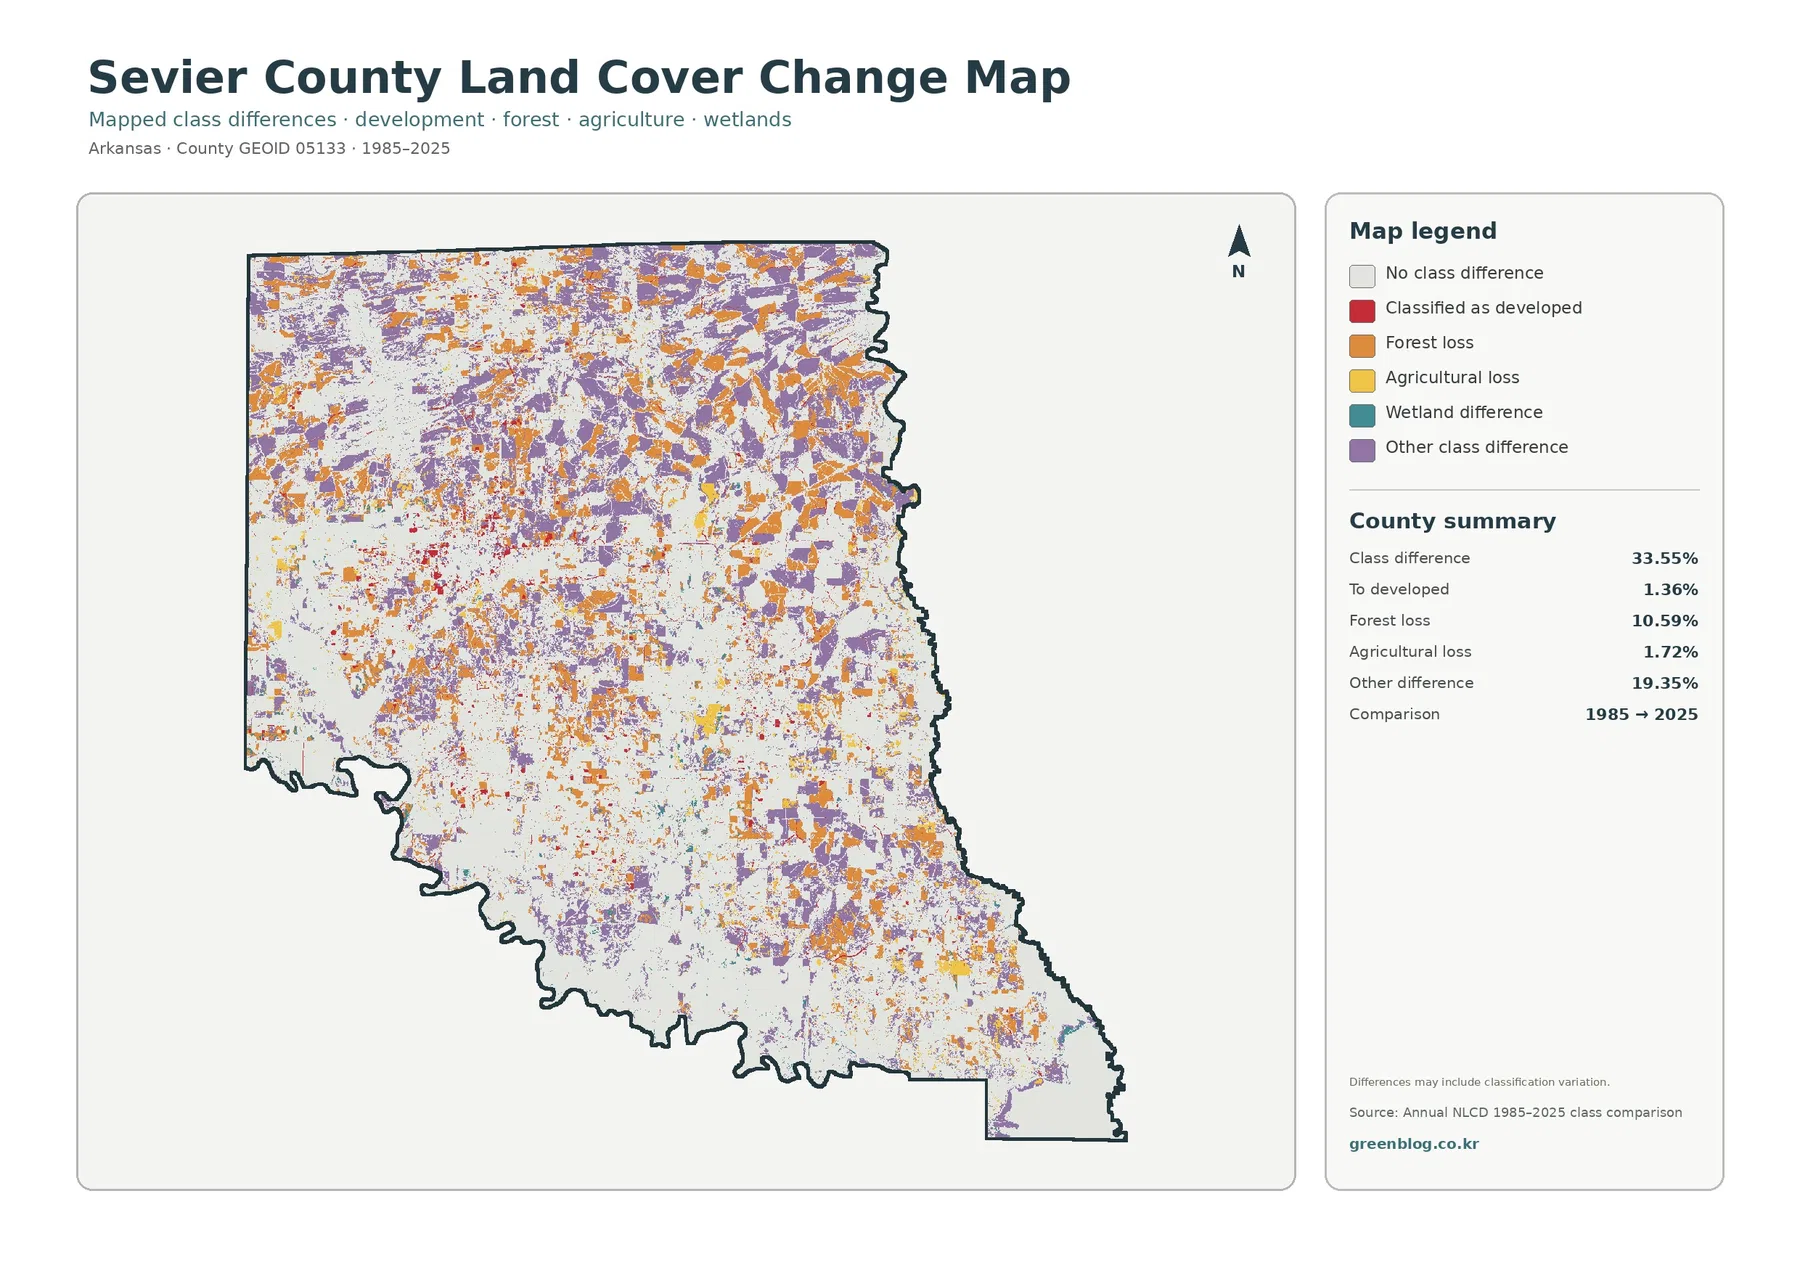
The change map compares broad classes in 1985 and 2025 and reports a class difference across 33.55% of Sevier County. The named categories include 1.36% classified to developed, 10.59% forest loss, 1.72% agricultural loss, and 19.35% other class difference. The large “other” share is important because it prevents a simple interpretation such as “one third of the county was developed” or “one third of the forest disappeared.”
Orange forest-loss cells and purple other-difference cells are widespread across the northern half. Around De Queen, red cells classified to developed are more noticeable, while the central and eastern areas contain mixtures of orange, purple, yellow, and occasional wetland-difference colors. The southern part also contains changed cells, but large no-difference areas remain along parts of the wetland and water landscape.
The map explicitly notes that class differences can include classification variation. A real surface change can alter a cell, but image date, vegetation condition, moisture, mixed pixels, and classification methods can also shift the assigned class. That caution matters in Sevier County because forest, shrubland, agriculture, wetlands, and water frequently meet along complicated boundaries.
The 10.59% forest-loss category should therefore be treated as a screening signal, not a verified timber-harvest total. Some orange patches may represent actual clearing, while others may reflect movement between forest, shrub, grass, or agricultural classes. Dated aerial imagery and additional annual land-cover layers are needed to decide what happened at a specific location.
The southern river-and-lake setting explains why water area and wetland area should be read together
Water makes up 2.91% of the 2025 summary, which may look modest beside forest and agriculture. Yet the general map shows that open water is concentrated in a few large locations and is closely associated with broad wetland zones in the south. Area percentage alone cannot capture the local importance of a lake or river corridor.
That same county reference places Millwood Lake in the southeast corner and the Little River along Sevier County’s southern boundary. County background material also notes De Queen Lake and Dierks Lake in the reservoir system. Association of Arkansas Counties material calls the area the “Land of the Lakes” and describes several rivers and mountain streams touching or crossing the county. Those references make the water-heavy southern pattern less abstract without requiring the land-cover map to label every feature.
Wetland cells should not be treated as legal wetland boundaries. Land-cover classification identifies a surface type at raster scale, while regulatory wetland status may depend on field conditions and agency criteria. The 13.94% figure is still useful for countywide comparison, but parcel-level decisions require more specialized data.
Choose the map according to the question, not simply by the amount of detail
For a countywide overview, the general map is the best starting point because it keeps forest, agriculture, developed land, wetlands, water, shrubland, and grassland in one image. If the goal is to compare wooded and rural open land, the forest-and-farmland map reduces urban color and makes those boundaries easier to follow. The impervious map is the right choice for showing how strongly De Queen differs from the rest of the county in hard-surface intensity.
Review the change map last when possible. A colored change cell is easier to understand after checking the 2025 surface around it. That sequence helps prevent purple “other difference” from being mistaken for development or every orange forest-loss cell from being read as permanent clearing.
Printed comparisons also work well with all four maps. A presentation can use the general map to introduce Sevier County, the impervious map to focus on De Queen, the forest-and-farmland map to discuss the rural landscape, and the change map to identify locations that merit further time-series review. The download below keeps the four original JPGs together so the same set can be used without relying on the smaller page previews.
Thirty-meter raster cells simplify small parcels, narrow streams, and mixed edges
Annual NLCD land-cover products are commonly organized in 30-meter raster cells. A single cell can contain trees, pasture, pavement, water, and a building but still receive one mapped class. In Sevier County, that matters along narrow roads, river margins, wetland edges, and the many boundaries where forest meets agriculture or shrub cover.
The maps are not parcel surveys. These maps do not prove ownership, zoning, building eligibility, farm acreage, or exact wetland jurisdiction. A property-level question requires cadastral, planning, survey, or regulatory information created for that purpose. These land-cover maps are strongest for county-scale patterns and comparisons.
The current views use the supplied 2025 classification, while the change layer compares 1985 with 2025. Clearing, regrowth, farming changes, road work, or construction after 2025 will not appear. For a current site-level decision, check newer Annual NLCD releases when available and compare them with recent aerial imagery or local records.
Frequently Asked Questions
Why are wetlands so prominent in southern Sevier County?
Wetlands account for 13.94% of the supplied 2025 summary and are concentrated across the southern part of the county. Trusted county references also identify the Little River along the southern boundary and major reservoirs including Millwood Lake, giving useful context for the mapped wetland and water pattern.
Where is the strongest impervious-surface concentration in Sevier County?
The strongest cluster is around De Queen. Countywide mean imperviousness is 1.18%, and only 0.42% of the county is mapped at 50% or greater impervious surface, so hard cover is concentrated rather than widespread.
Does the 33.55% 1985–2025 class difference mean one third of the county changed land use?
No. The map includes 10.59% forest loss, 1.36% classified to developed, and 19.35% other class difference, and it warns that classification variation can contribute. Aerial imagery and additional annual data are needed to confirm site-level change. Map File Information The four original Sevier County JPG maps are packaged in one ZIP: general land cover, forest and farmland, impervious surface/developed land, and the 1985–2025 change map. The files are larger than the page previews and are useful for printing, classroom reference, presentations, and county-to-county comparison.
Sources and reference material
- MRLC Annual NLCD Data – annual land-cover data reference
- USGS Annual NLCD Land Cover Classification – class definitions and interpretation guidance
- U.S. Census Bureau TIGER/Line Shapefiles – Sevier County boundary reference
- Association of Arkansas Counties – Sevier County – De Queen, county terrain, lakes, rivers, and local economic context
- Encyclopedia of Arkansas – Sevier County – Little River, Saline River, Cossatot River, Rolling Fork River, and reservoir context
Map File Information
Download the map files associated with this page for reference, printing, and compatible visual projects.
- Included Files: Use only the versions confirmed in the article and supplied images
- File Type: Use the confirmed download contents
- Intended Use: Printing, education, presentations, and map-based projects
Related Maps
- A Craighead County Arkansas Land Cover Map
- Arkansas County Arkansas Land Cover Map
- Ashley County Arkansas Land Cover Map
Green Map creates custom-edited map images using open geographic data sources such as geoBoundaries, Natural Earth, OpenStreetMap, and government open data.
These maps are edited visual materials, not raw data files, and are provided for education, documents, presentations, and graphic reference.