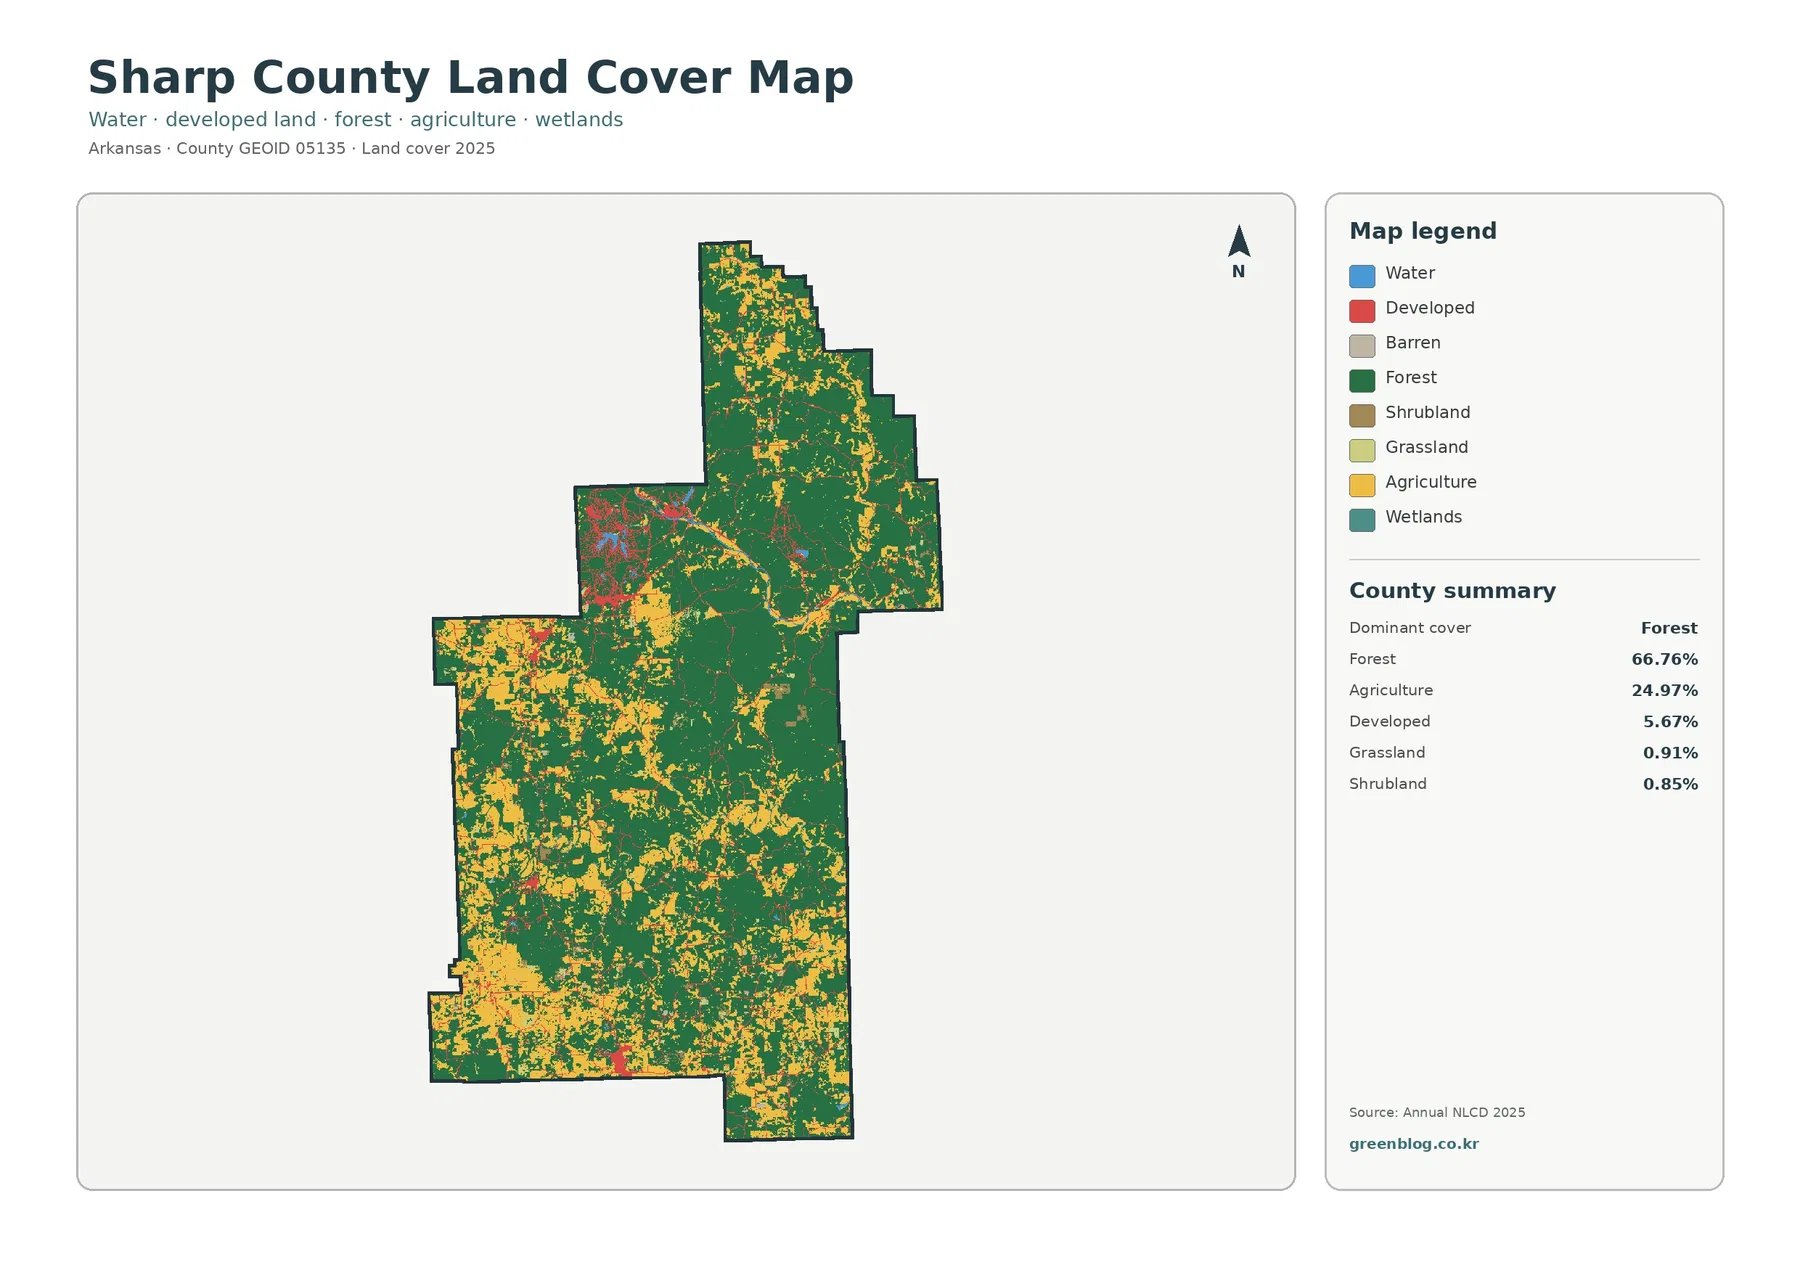
Sharp County’s 2025 map combines a strong forest majority with a substantial open-rural component. Forest covers 66.76%, agriculture 24.97%, and developed land 5.67%. Broad woodland dominates the north and east, while agricultural openings become more frequent toward the southwest and south. The strongest hard-surface cluster lies in the north-central to western community area around Ash Flat and nearby towns.
Four views separate those patterns: current land cover, forest and farmland, impervious surface/developed land, and a 1985–2025 class comparison. The WebP previews are for quick reading, and the four original JPG maps are available together in one ZIP below. Land cover describes mapped surface conditions; it does not establish parcel ownership, zoning, property boundaries, or development rights.
Table of Contents
The Ash Flat–Cherokee Village side of the county forms the clearest hard-surface cluster
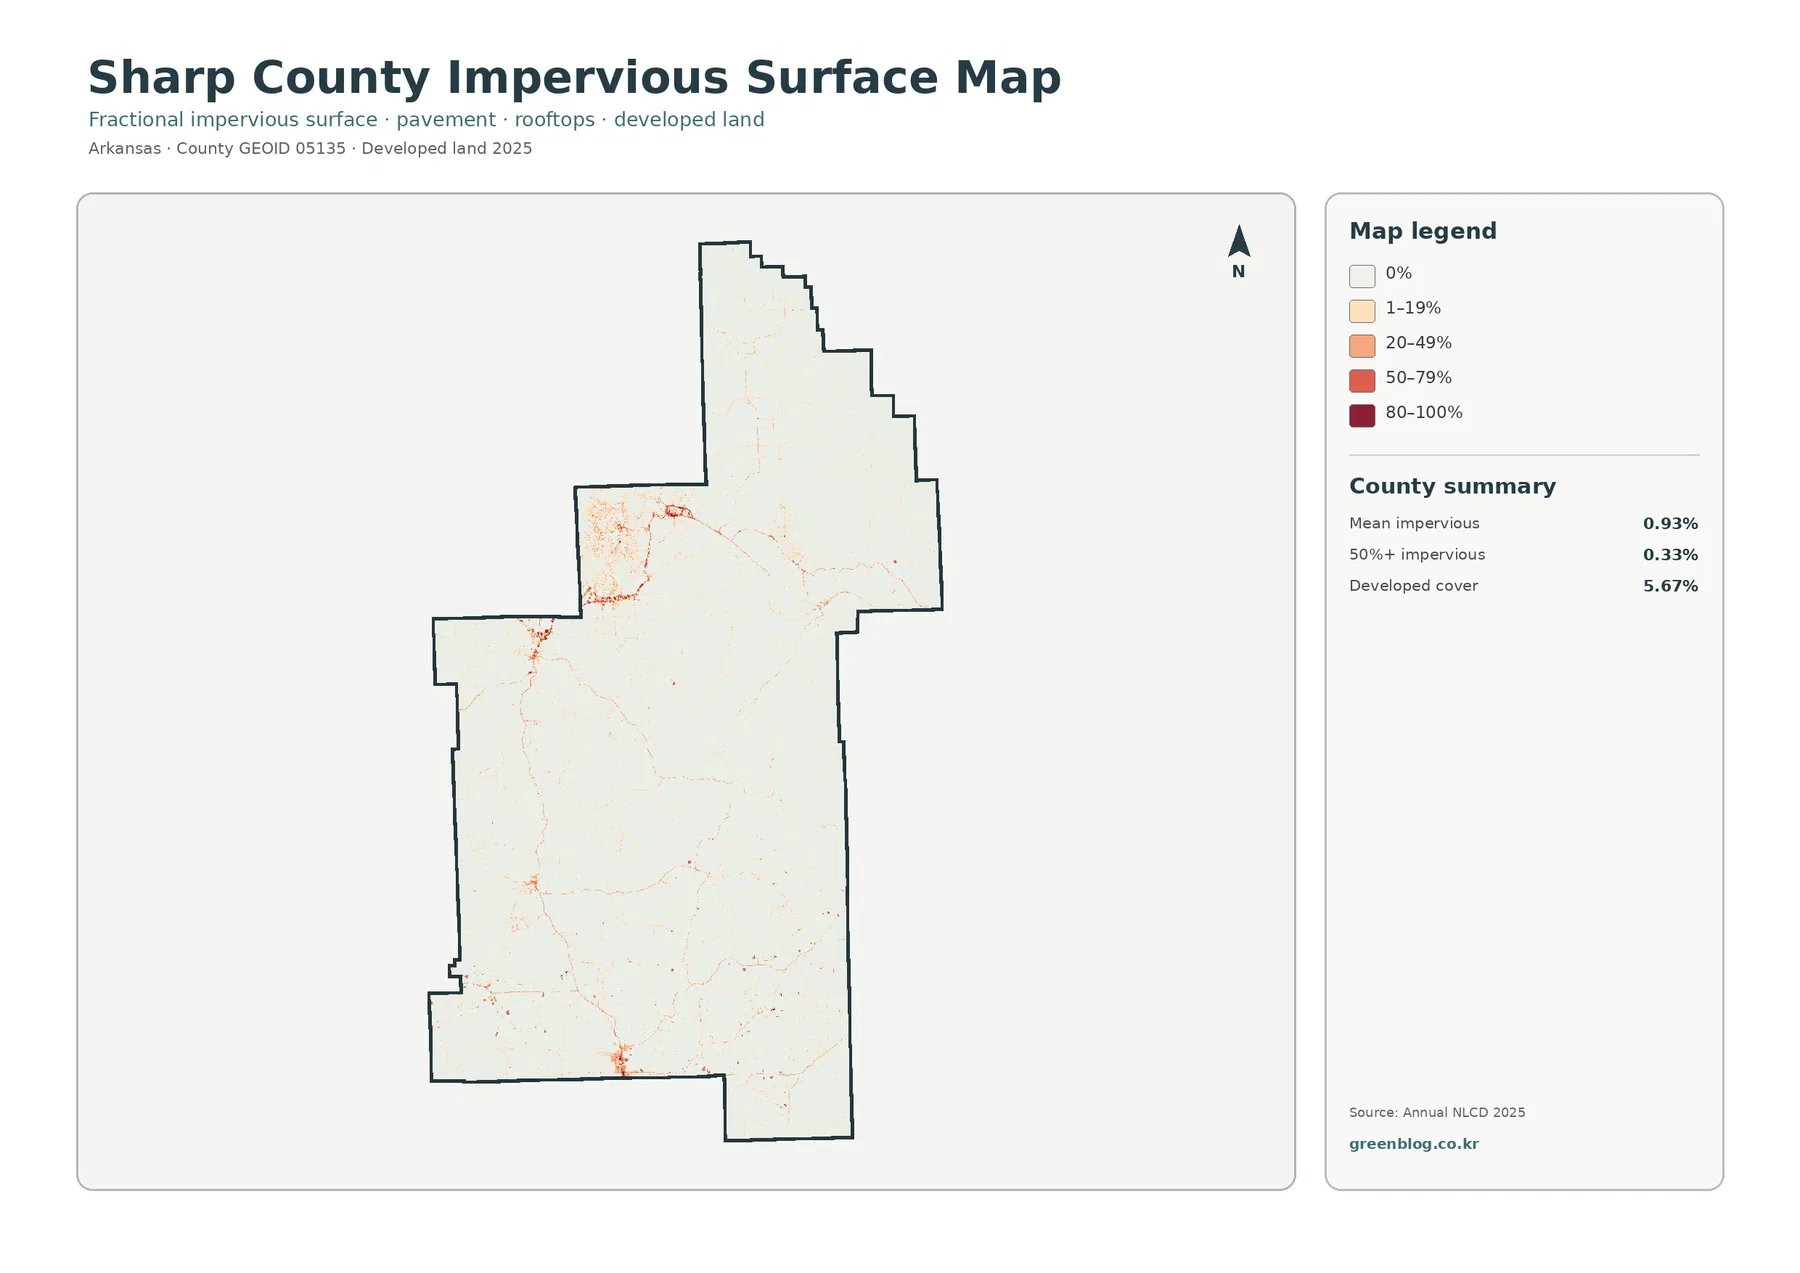
The impervious map makes Sharp County’s settlement pattern easy to recognize. Most of the county is white or very pale, while a much stronger orange and red cluster appears in the north-central to western area. County sources identify Ash Flat as the county seat and list Cherokee Village, Highland, Hardy, and other nearby communities. Because the preview has no city labels, individual colored cells should be checked against a road or city map before assigning them to a specific place.
Mean imperviousness is 0.93%, and 0.33% of the county is mapped at 50% or greater impervious cover. These values are lower than the 5.67% developed-land share because developed classes can contain permeable ground around buildings and roads. Faint linear traces extend from the main cluster, but most forest and agricultural areas remain close to zero. The layer is useful for relative built-surface intensity, not drainage or flood-risk decisions.
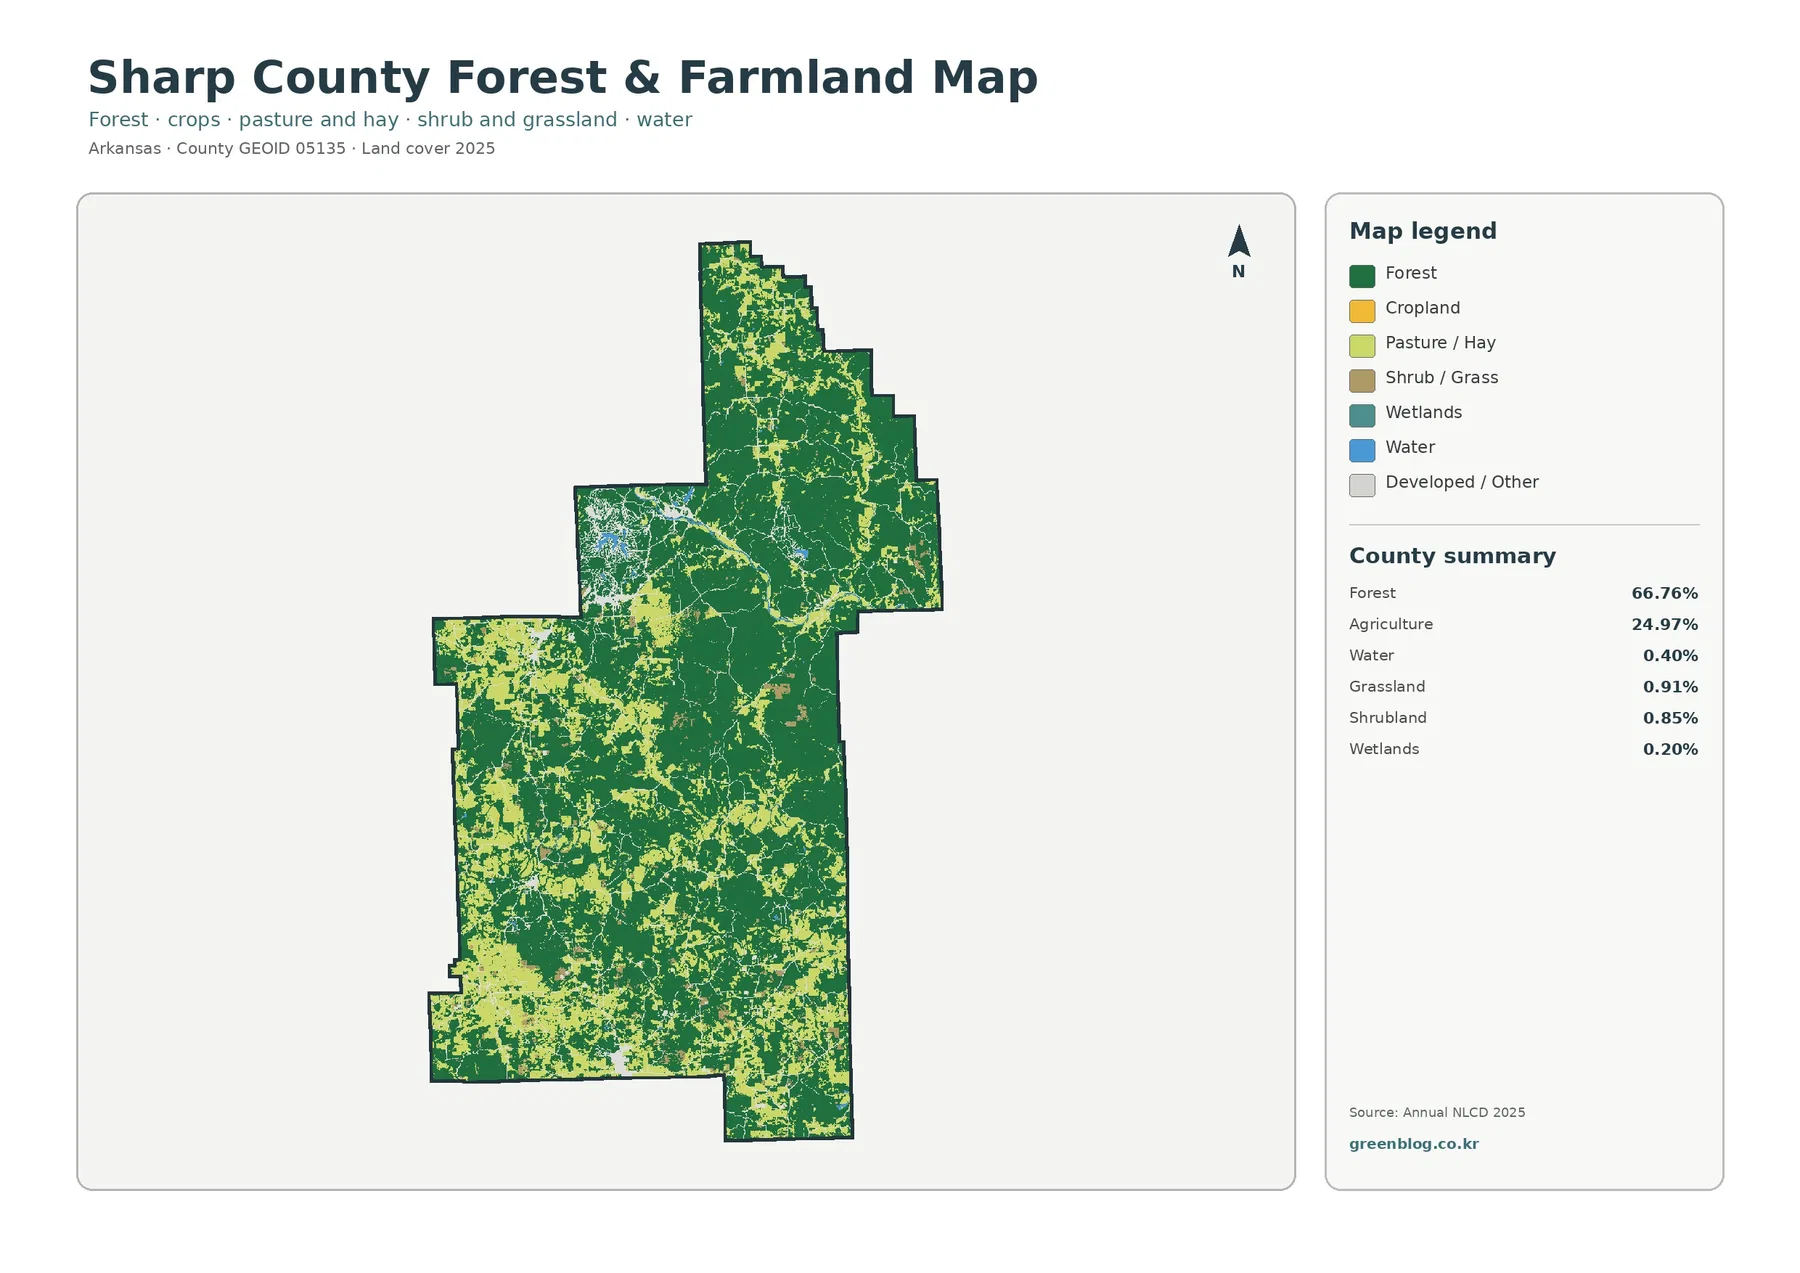
Forest covers two thirds of Sharp County, while agricultural openings widen toward the southwest and south
Dark green forest fills most of the long northern section, much of the east, and large parts of the center. Yellow agricultural cover becomes more frequent toward the southwest and along the southern portion of the county. Forest still remains important there, so the pattern is a mixed rural mosaic rather than a clean boundary. The 66.76% forest share therefore describes the county overall but does not mean every part of Sharp County looks the same.
Agriculture accounts for 24.97%, developed cover 5.67%, grassland 0.91%, and shrubland 0.85%. The Association of Arkansas Counties describes Sharp County as rolling hills in the Ozark foothills and notes local cattle, broilers, hay, and watermelons. The land-cover layer does not identify individual crops or farms, but the county source provides useful context for the open rural areas that interrupt the larger forest blocks.
The forest-and-farmland view also explains why Spring River can matter despite only 0.40% mapped water
With developed classes simplified, the forest-and-farmland map makes the rural pattern easier to follow. Northern and eastern Sharp County remain strongly forested, while the southwest and south contain broader agricultural and pasture-like openings. Central areas show repeated boundaries between the two, making the county look more varied than a single forest percentage suggests.
Water is 0.40% and wetlands 0.20% in the supplied summary. Those small shares do not measure local importance. The Association of Arkansas Counties highlights the Spring River, and the City of Hardy notes that the community developed along its banks. A long, narrow river can occupy little of the county’s total area, and 30-meter classification can simplify small channels and river-edge vegetation. Detailed river work needs hydrography or topographic data.
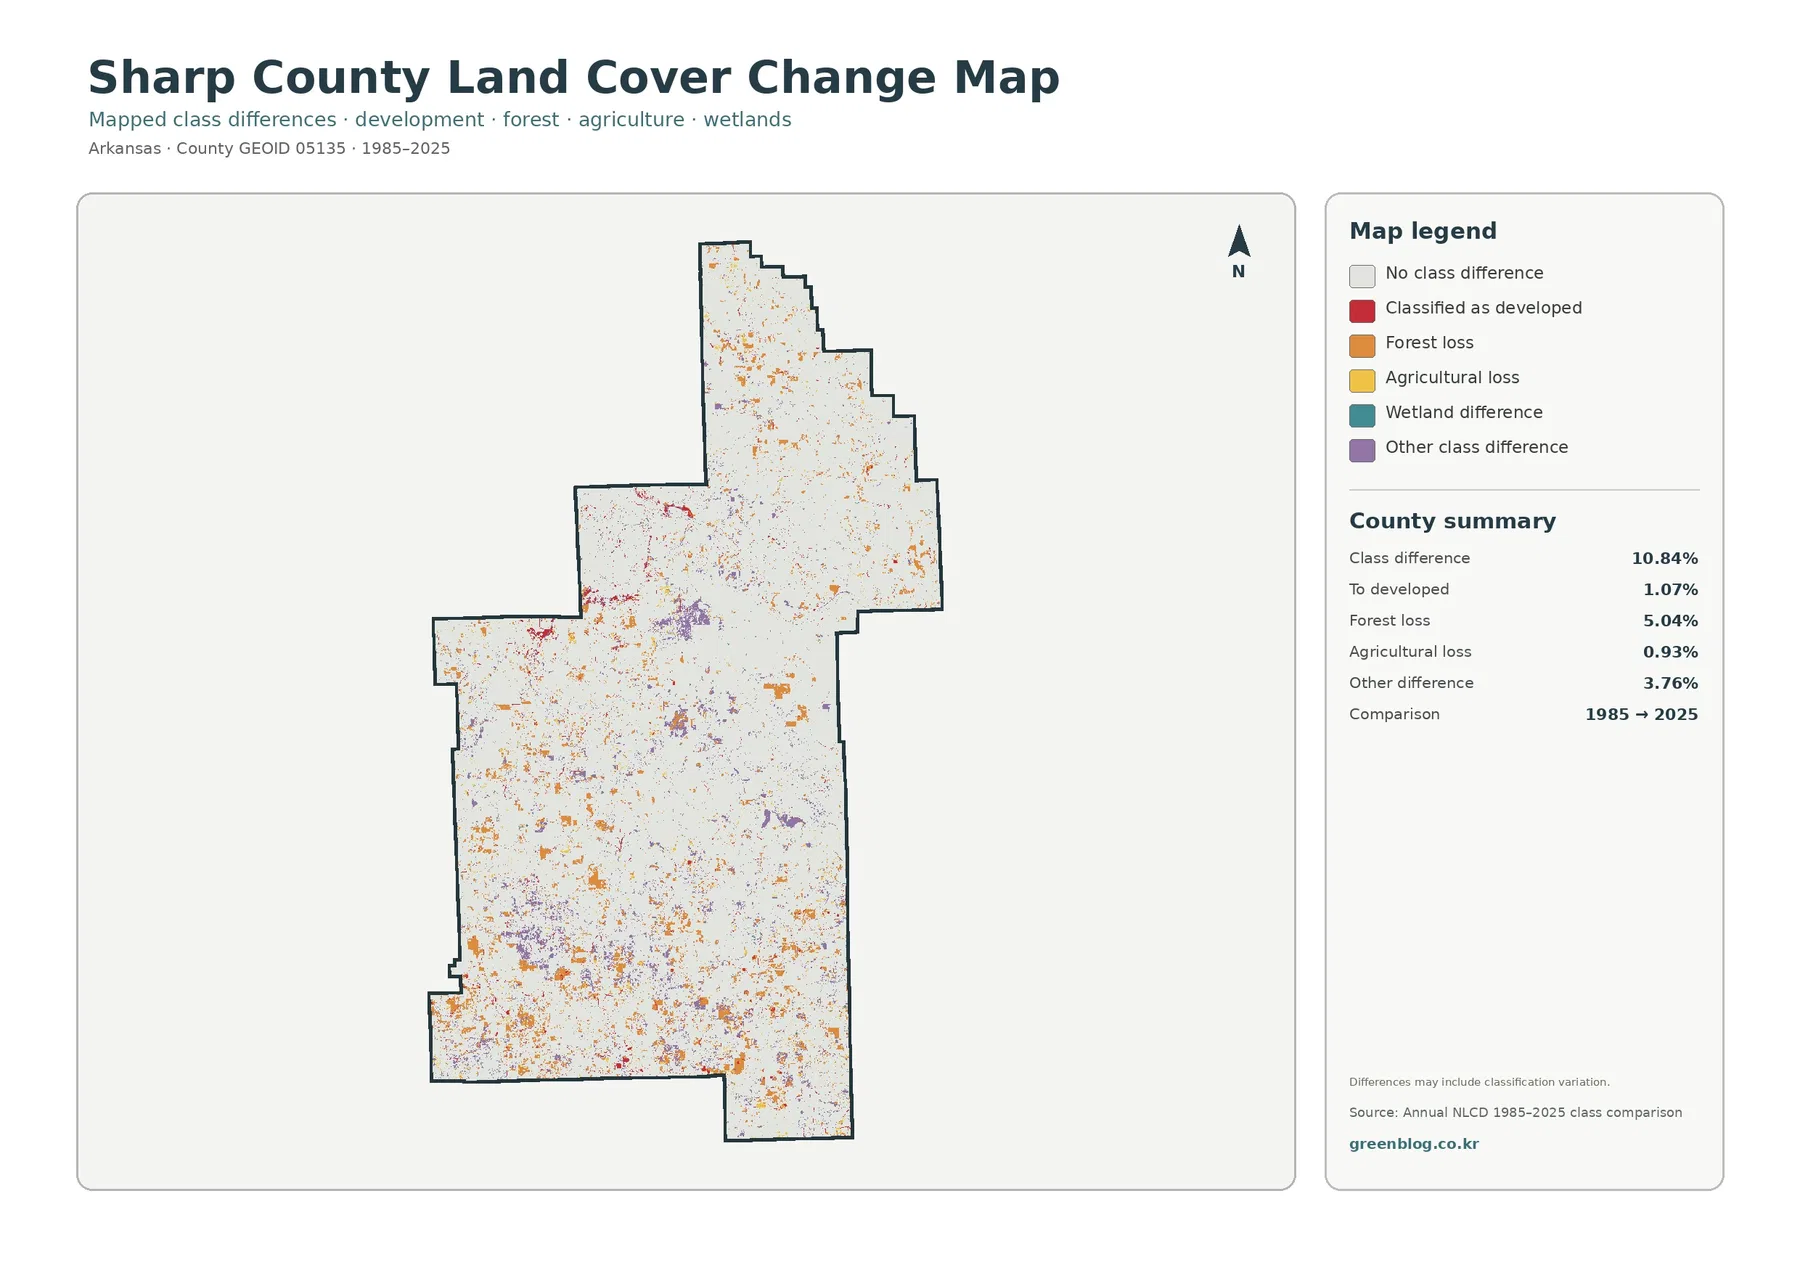
The 1985–2025 comparison marks 10.84% class difference, led by forest-loss cells
The change summary reports differences across 10.84% of Sharp County. Forest loss is the largest named category at 5.04%. Cells classified to developed account for 1.07%, agricultural loss for 0.93%, and other class difference for 3.76%. Orange, red, yellow, and purple cells appear in many small patches from north to south rather than forming one continuous change zone.
Forest-loss cells occur around several wooded areas, while classified-to-developed cells are more noticeable near the main community cluster and selected corridors. Purple other-difference cells also appear in central and southern areas, showing that one process cannot explain all mapped differences. The 2025 map helps identify the present cover surrounding each change patch.
The map warns that class differences may include classification variation. Image timing, vegetation condition, moisture, mixed 30-meter cells, and classification rules can all affect the assigned class. The 10.84% value is therefore a broad comparison statistic, not a verified parcel-level conversion rate. Follow-up with dated aerial imagery is appropriate before treating an orange or red cell as confirmed clearing or development.
Use each map for a different question rather than treating the four views as interchangeable
The general map is the best starting point for the countywide mix of forest, agriculture, and development. The forest-and-farmland map is better for tracing where open rural land widens inside the Ozark foothill forest. The impervious map isolates pavement and rooftops, making the Ash Flat–Cherokee Village side of the county stand out more clearly. The change layer belongs last, after the current cover is understood.
For printing or teaching, pairing the general and forest-and-farmland maps makes Sharp County’s north–south rural contrast easy to explain. A community-focused presentation can add the impervious map, while a historical comparison can use the change map with a note about classification variation. Spring River is a good reminder that a feature’s geographic importance may be much greater than its countywide area percentage.
Thirty-meter classification is useful for county patterns but not for parcel boundaries or small river details
Annual NLCD is commonly organized in 30-meter raster cells. A cell can contain trees, grass, pavement, buildings, and water yet receive one dominant class. In Sharp County, narrow roads, small settlements, field edges, and Spring River segments can therefore look wider, narrower, or less detailed than they do in aerial imagery.
These maps do not establish property ownership, exact parcel boundaries, zoning, building rights, or the acreage of a specific farm. The current views use the supplied 2025 classification, while the change layer compares 1985 with 2025. Logging, regrowth, road work, or new construction after 2025 may require newer land-cover data, aerial photographs, and local records.
Frequently Asked Questions
What is the dominant land cover in Sharp County?
Forest is the dominant 2025 class at 66.76%, followed by agriculture at 24.97%. Large wooded areas are especially visible in the north and east, while broader agricultural and pasture-like openings occur toward the southwest and south.
Which map best shows development around Ash Flat and Cherokee Village?
The impervious-surface map is the clearest view of hard surfaces such as pavement and rooftops. Mean imperviousness is 0.93%, and 0.33% of the county is mapped at 50% or greater impervious cover. The strongest cluster lies in the north-central to western community area, though exact city boundaries require another reference map.
Why is mapped water only 0.40% when Spring River is important locally?
The percentage measures area rather than significance. A river can be long but narrow compared with the entire county, and a 30-meter raster can generalize small channels and river-edge vegetation. Spring River can therefore be a defining local feature while water still represents a small countywide share.
Sources and reference material
- MRLC Annual NLCD Data – 2025 and annual land-cover data reference
- USGS Annual NLCD Land Cover Classification – class definitions and 30-meter land-cover interpretation
- U.S. Census Bureau TIGER/Line Shapefiles – Sharp County boundary reference
- Sharp County, Arkansas Official Government Website – county government and Ash Flat reference
- Association of Arkansas Counties – Sharp County – Ozark foothills, Spring River, Ash Flat, Cherokee Village, Hardy, and local agriculture context
- City of Hardy, Arkansas – Hardy and Spring River community context
Map File Information
The four original Sharp County JPG maps are packaged in one ZIP: general land cover, forest and farmland, impervious surface/developed land, and the 1985–2025 change map. The files are larger than the page previews and are useful for printing, classroom reference, presentations, and county-to-county comparison.
- Included Files: Use only the versions confirmed in the article and supplied images
- File Type: Use the confirmed download contents
- Intended Use: Printing, education, presentations, and map-based projects
Related Maps
- A Craighead County Arkansas Land Cover Map
- Arkansas County Arkansas Land Cover Map
- Ashley County Arkansas Land Cover Map
Green Map creates custom-edited map images using open geographic data sources such as geoBoundaries, Natural Earth, OpenStreetMap, and government open data.
These maps are edited visual materials, not raw data files, and are provided for education, documents, presentations, and graphic reference.