The Greene County Arkansas Land Cover Map gives a clear 2025 picture of a county dominated by agriculture but divided by a wooded central ridge. Agriculture accounts for 68.06% of the mapped cover, while a north–south forest band follows the Crowley’s Ridge area and the largest developed concentration sits around Paragould. That contrast makes Greene County useful for comparing flat farming country, wooded uplands, settlement, wetlands, and water within one county.
Four original JPG views are available in one download: general land cover, forest and farmland, fractional impervious surface, and a 1985–2025 class-difference view. They work well for classroom examples, county comparisons, reports, and reference graphics. The classifications describe what covers the surface; they do not establish zoning, ownership, building rights, or parcel-level legal land use.
Table of Contents
Agriculture Dominates the 2025 Cover
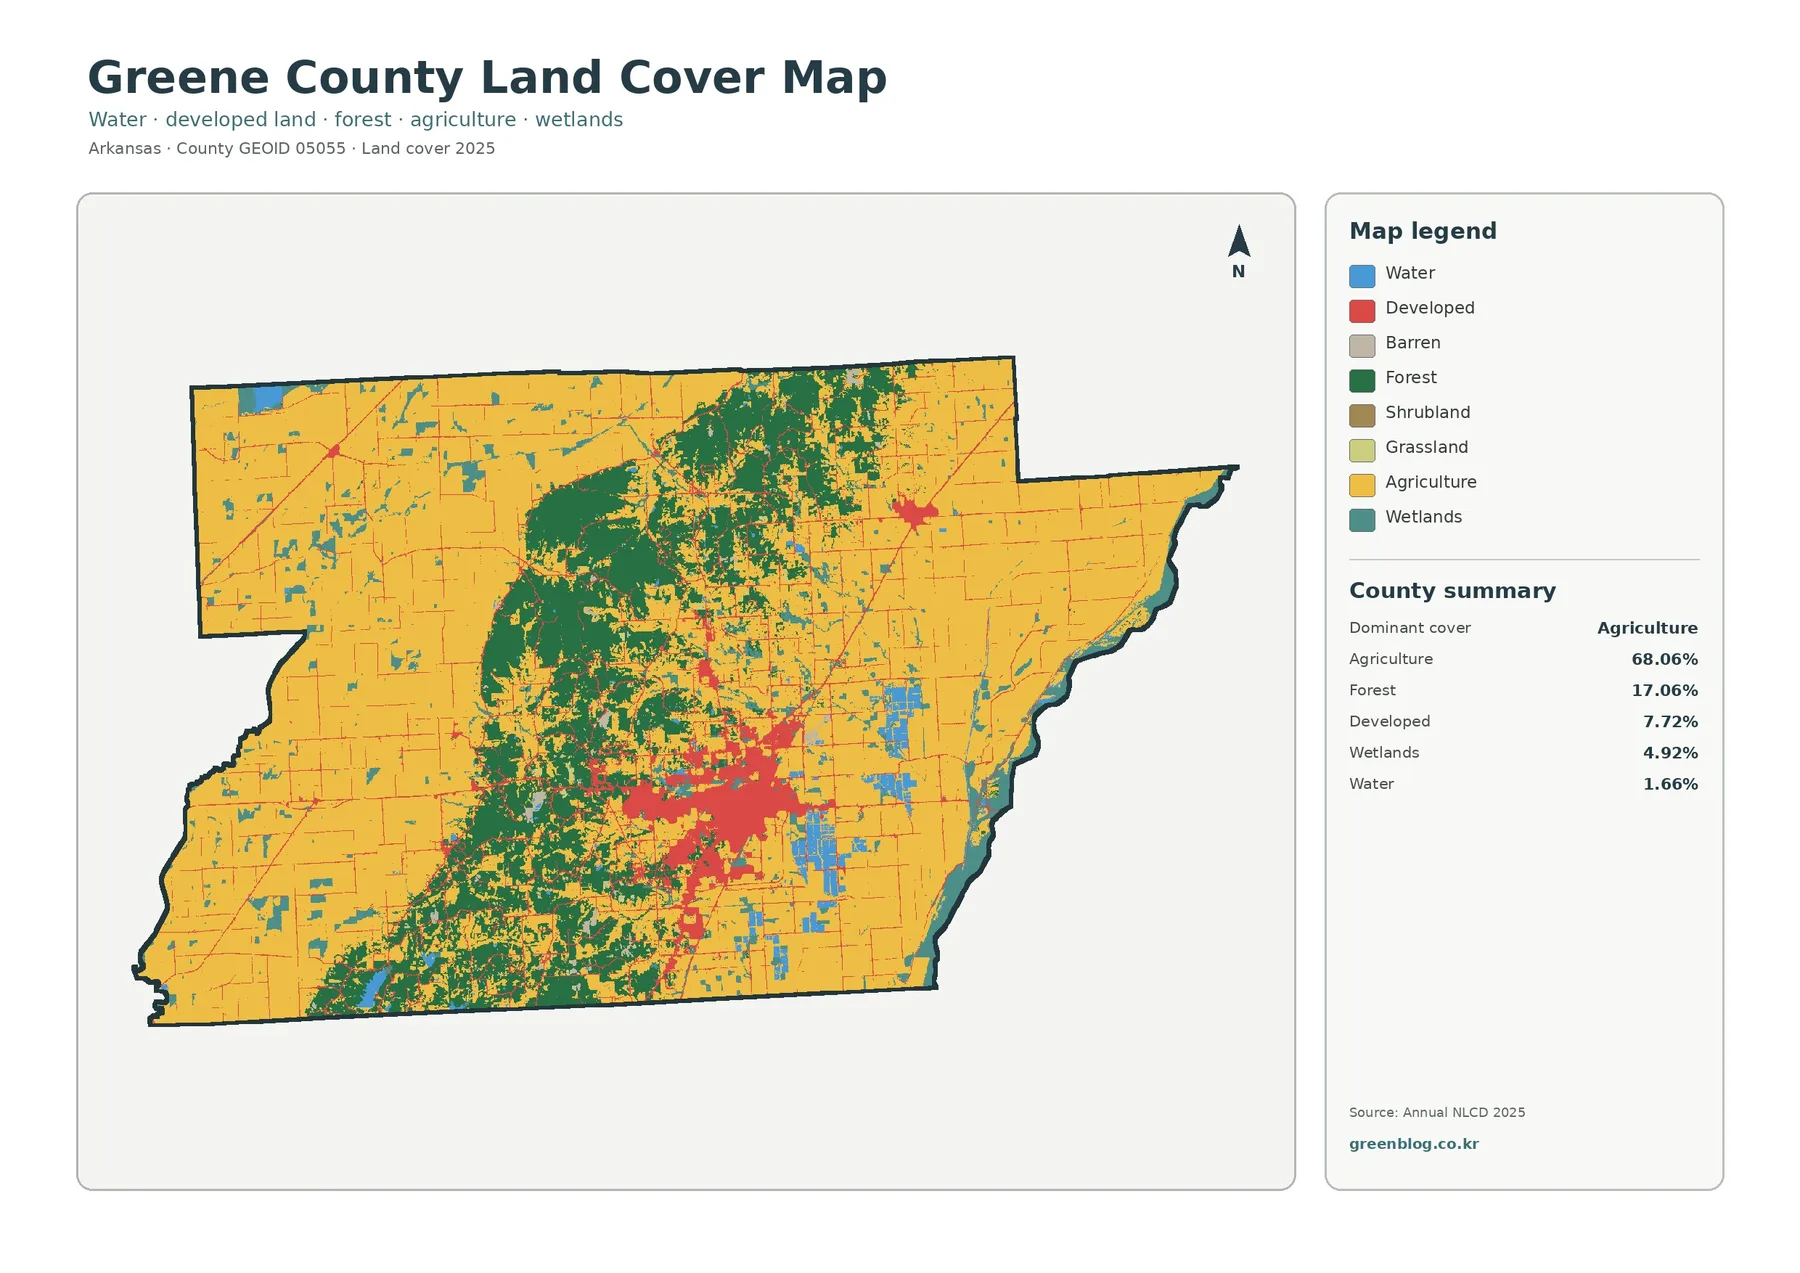
The county summary places agriculture first at 68.06%. Forest follows at 17.06%, then developed cover at 7.72%, wetlands at 4.92%, and water at 1.66%. Those percentages describe countywide totals, but their locations are just as important. Yellow agricultural cover spreads across most of the eastern and western sides, dark green forest forms a long central band, and red developed cover is concentrated rather than evenly scattered.
Greene County’s regional geography helps explain why the pattern is so distinctive without turning the map into a causal model. The Association of Arkansas Counties describes flat Delta farmland on both the east and west sides and rolling central hills that include Crowley’s Ridge. That description matches the visible contrast: farmland is broad and continuous away from the ridge, while the wooded center breaks the farming plains into two large zones.
Wetlands appear as smaller blue-green patches and corridors across the farming country, and water is most noticeable along parts of the county edge and in scattered interior features. The county’s official site identifies the St. Francis River along the eastern Missouri boundary and the Cache River on the western side as important local waterways. The cover layer can help locate wet-looking parts of the landscape, but it should not be used to define a legal stream boundary or regulated wetland.
Developed cover is a much smaller share of the county than agriculture, yet the largest cluster is visually prominent near Paragould. Smaller settlement patches and thin road-like lines extend away from that core. This is a good example of why percentage alone can be misleading: 7.72% is modest at county scale, but development is locally dominant where people, streets, and buildings are concentrated.
Crowley’s Ridge Forms the Main Wooded Band
A long strip of forest running from the southern part of the county toward the north is the strongest nonagricultural feature. Crowley’s Ridge is a narrow upland that rises above the surrounding Delta, and Arkansas State Parks describes it as a distinctive belt of rolling hills. In Greene County, that physical setting provides useful context for the central concentration of tree cover seen in the 2025 classification.
Within that wooded band, forest is not one unbroken block. Agricultural openings, developed patches, grass, and other cover interrupt it, especially near the Paragould area and along its edges. North of the main urban concentration, the forest becomes a complex mosaic with openings and narrow breaks. Reading the ridge as a broad zone rather than a perfectly continuous forest keeps the interpretation closer to what the pixels actually display.
On both sides of the ridge, broad farmland makes the central trees stand out even more. In the west, cropland dominates large rectangular tracts with scattered wet areas. East of the ridge, agriculture again becomes the main cover and continues toward the irregular river boundary. The resulting west–ridge–east sequence is more informative than a simple statement that Greene County is mostly agricultural.
A Cleaner Comparison of Forest and Farmland
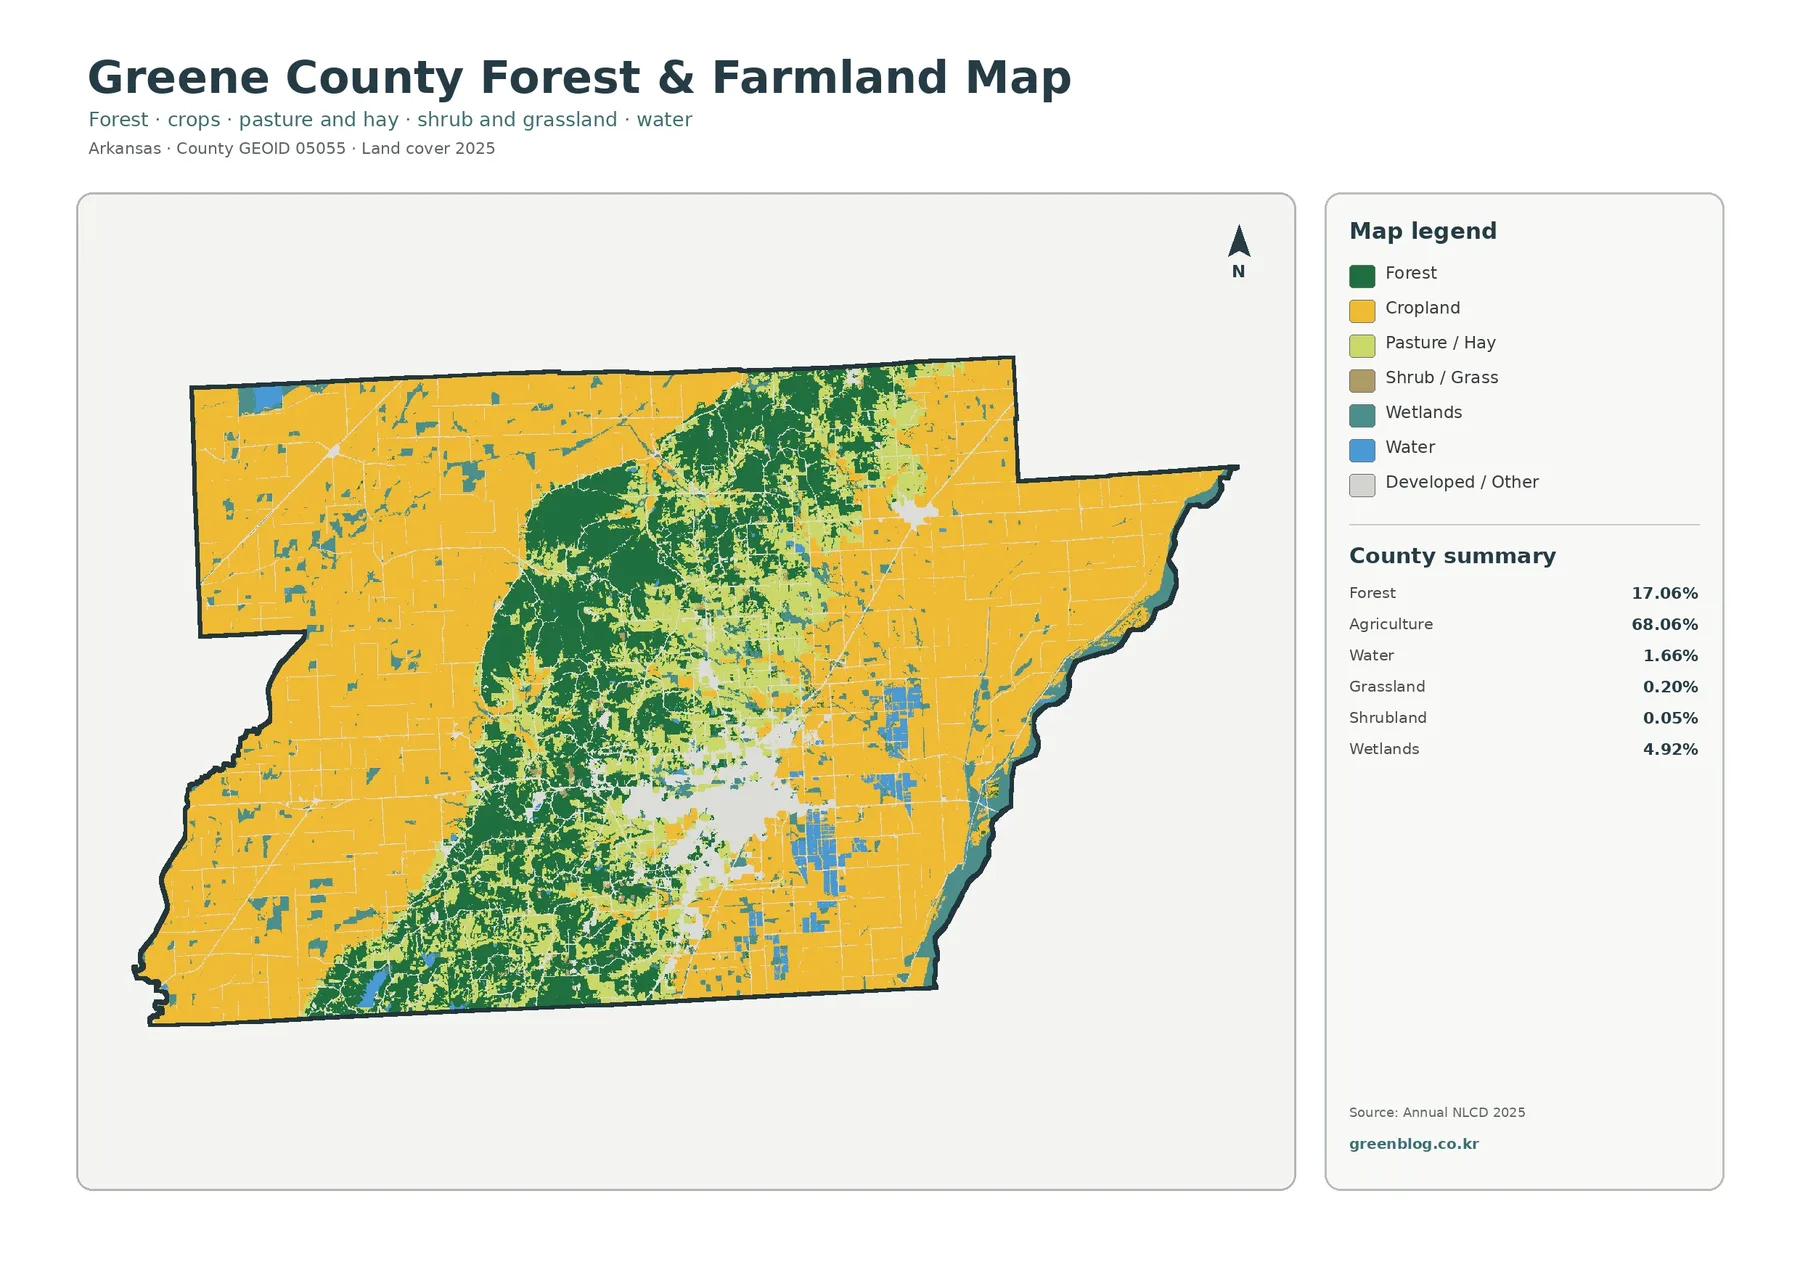
By simplifying the legend, the forest-and-farmland view removes much of the visual competition from the general classification. Forest remains 17.06% and agriculture 68.06%, while wetlands account for 4.92%, water 1.66%, grassland 0.20%, and shrubland 0.05%. Developed and other surfaces are grouped separately, so the agricultural plains and wooded ridge can be read more directly.
This layer is especially helpful for distinguishing a large agricultural total from the shape of agricultural land. Cropland covers broad areas on both sides of Crowley’s Ridge, while tree cover occupies much more of the center. Some fields intrude into the ridge zone and some wooded patches extend outward into the plains, creating irregular edges rather than a clean straight boundary. Those transitions are useful for landscape comparison and habitat-context discussions.
The Association of Arkansas Counties notes rice, soybeans, and small grains among Greene County’s principal crops. That information provides agricultural context, but the supplied classification does not identify crop species field by field. A yellow agricultural pixel should therefore be read as part of the mapped agriculture category, not as proof that a specific crop is growing there. Crop-specific work requires agricultural statistics or field-level sources.
For teaching, this view works well after the general cover layer. Students can first identify the dominant classes, then ask why forest appears in a narrow central zone while agriculture is much broader to the east and west. The exercise demonstrates that countywide percentages and spatial arrangement answer different questions, even when both come from the same annual land-cover source.
Hard Surfaces Cluster Around Paragould
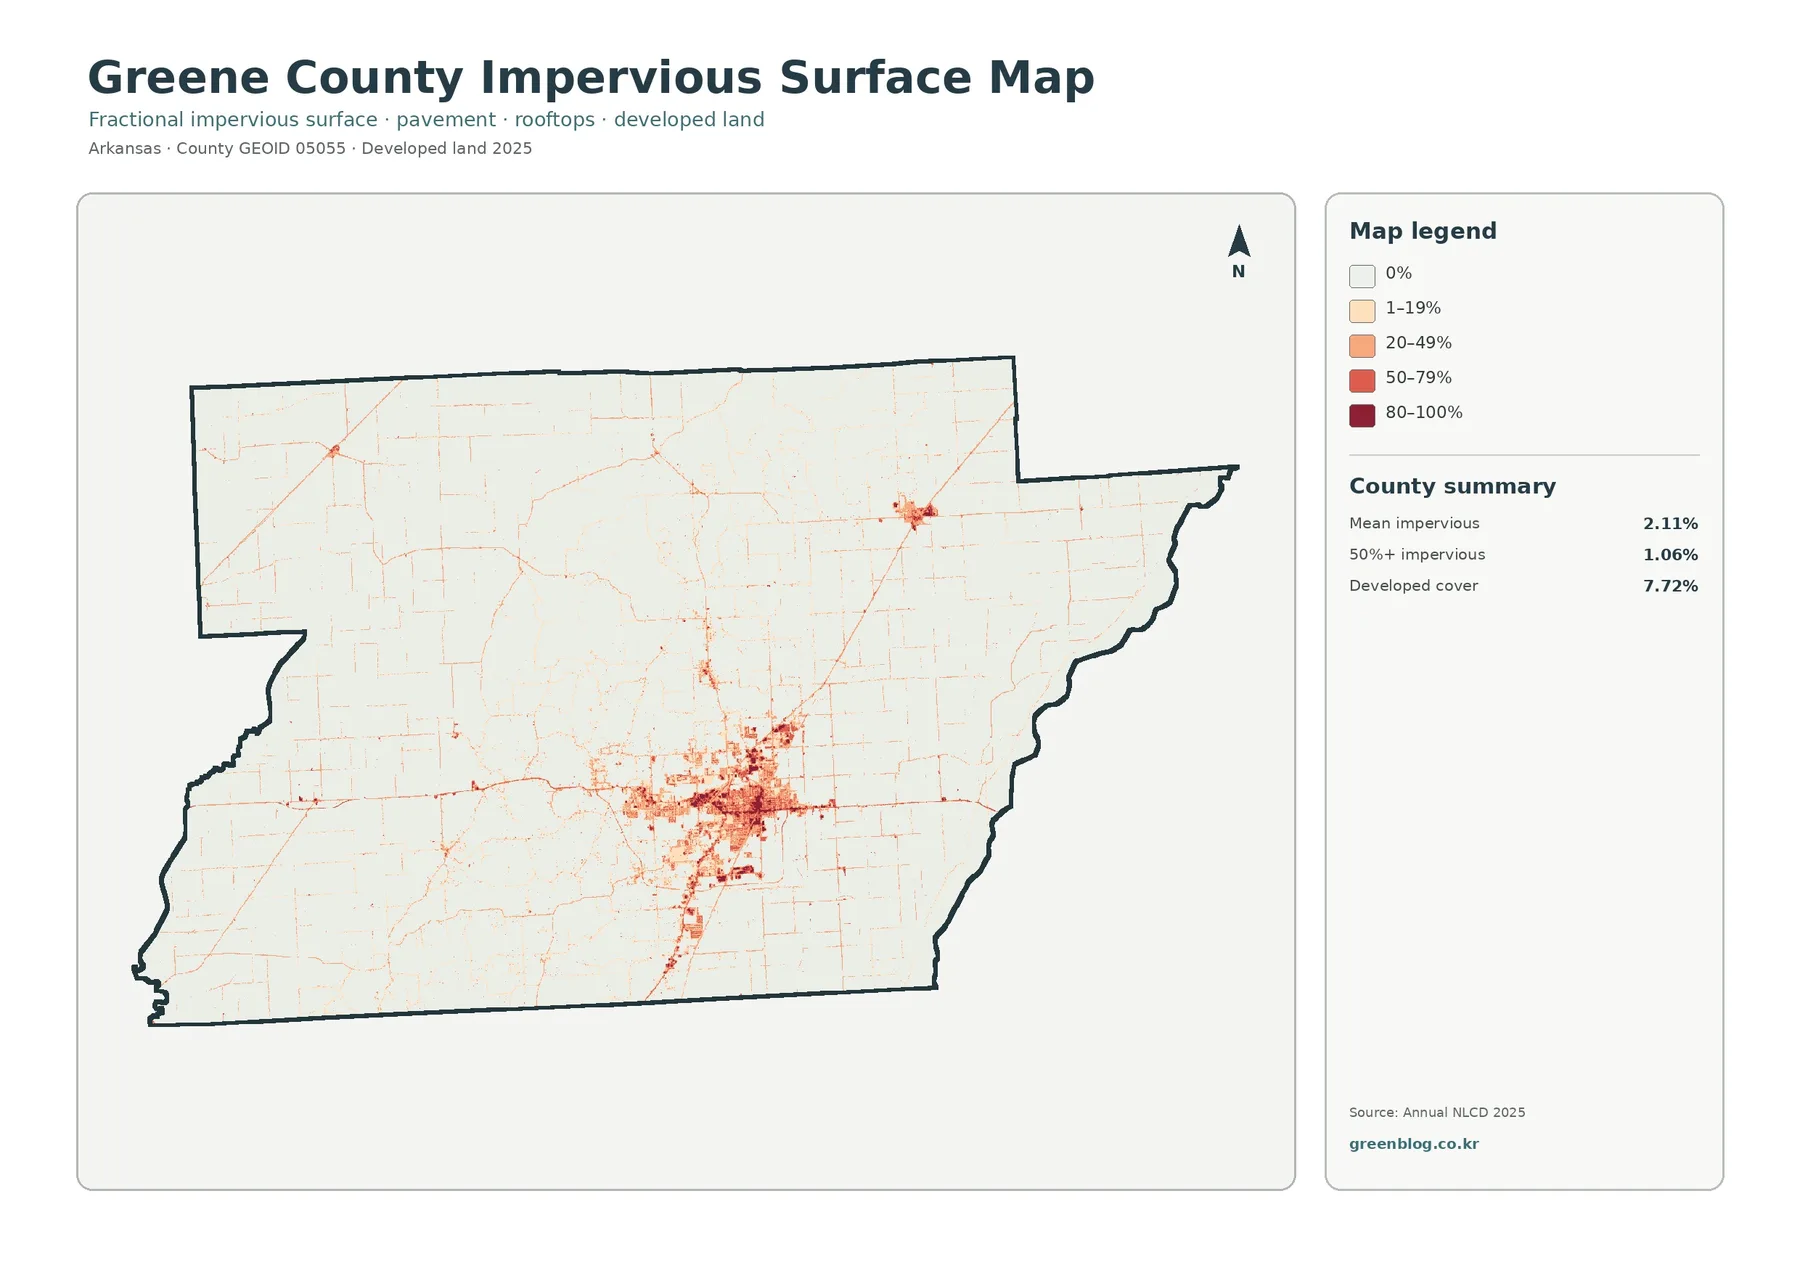
Fractional impervious surface measures the share of a 30-meter cell covered by processed or built materials such as pavement, concrete, and rooftops. Greene County’s mean impervious value is 2.11%, while 1.06% of the county falls in cells with at least 50% impervious cover. The general land-cover map reports 7.72% developed cover, so the two numbers clearly describe different things.
The strongest concentration of dark red and orange pixels lies around Paragould. From that core, finer traces follow road corridors into surrounding rural land. A separate smaller cluster appears farther north and east, but most of the agricultural plains and wooded ridge remain very light. The contrast is useful for locating where hard surfaces are concentrated without implying that every developed pixel is fully paved.
A developed land-cover class can include lawns, trees, open ground, and other pervious surfaces mixed with buildings and streets. The fractional impervious layer focuses more directly on hard cover within each cell. Comparing the two helps explain why a town can occupy a recognizable developed area while the countywide mean impervious percentage stays low.
This layer can support discussions of runoff, settlement patterns, and rural–urban contrast, but it is not a flood-risk or drainage-capacity model. It does not report storm-sewer condition, rainfall intensity, soil infiltration, or elevation. A project about actual runoff should pair impervious cover with hydrology, terrain, soils, and local infrastructure data rather than treating the percentage as a complete answer.
1985–2025 Differences Are Not a Single Growth Rate
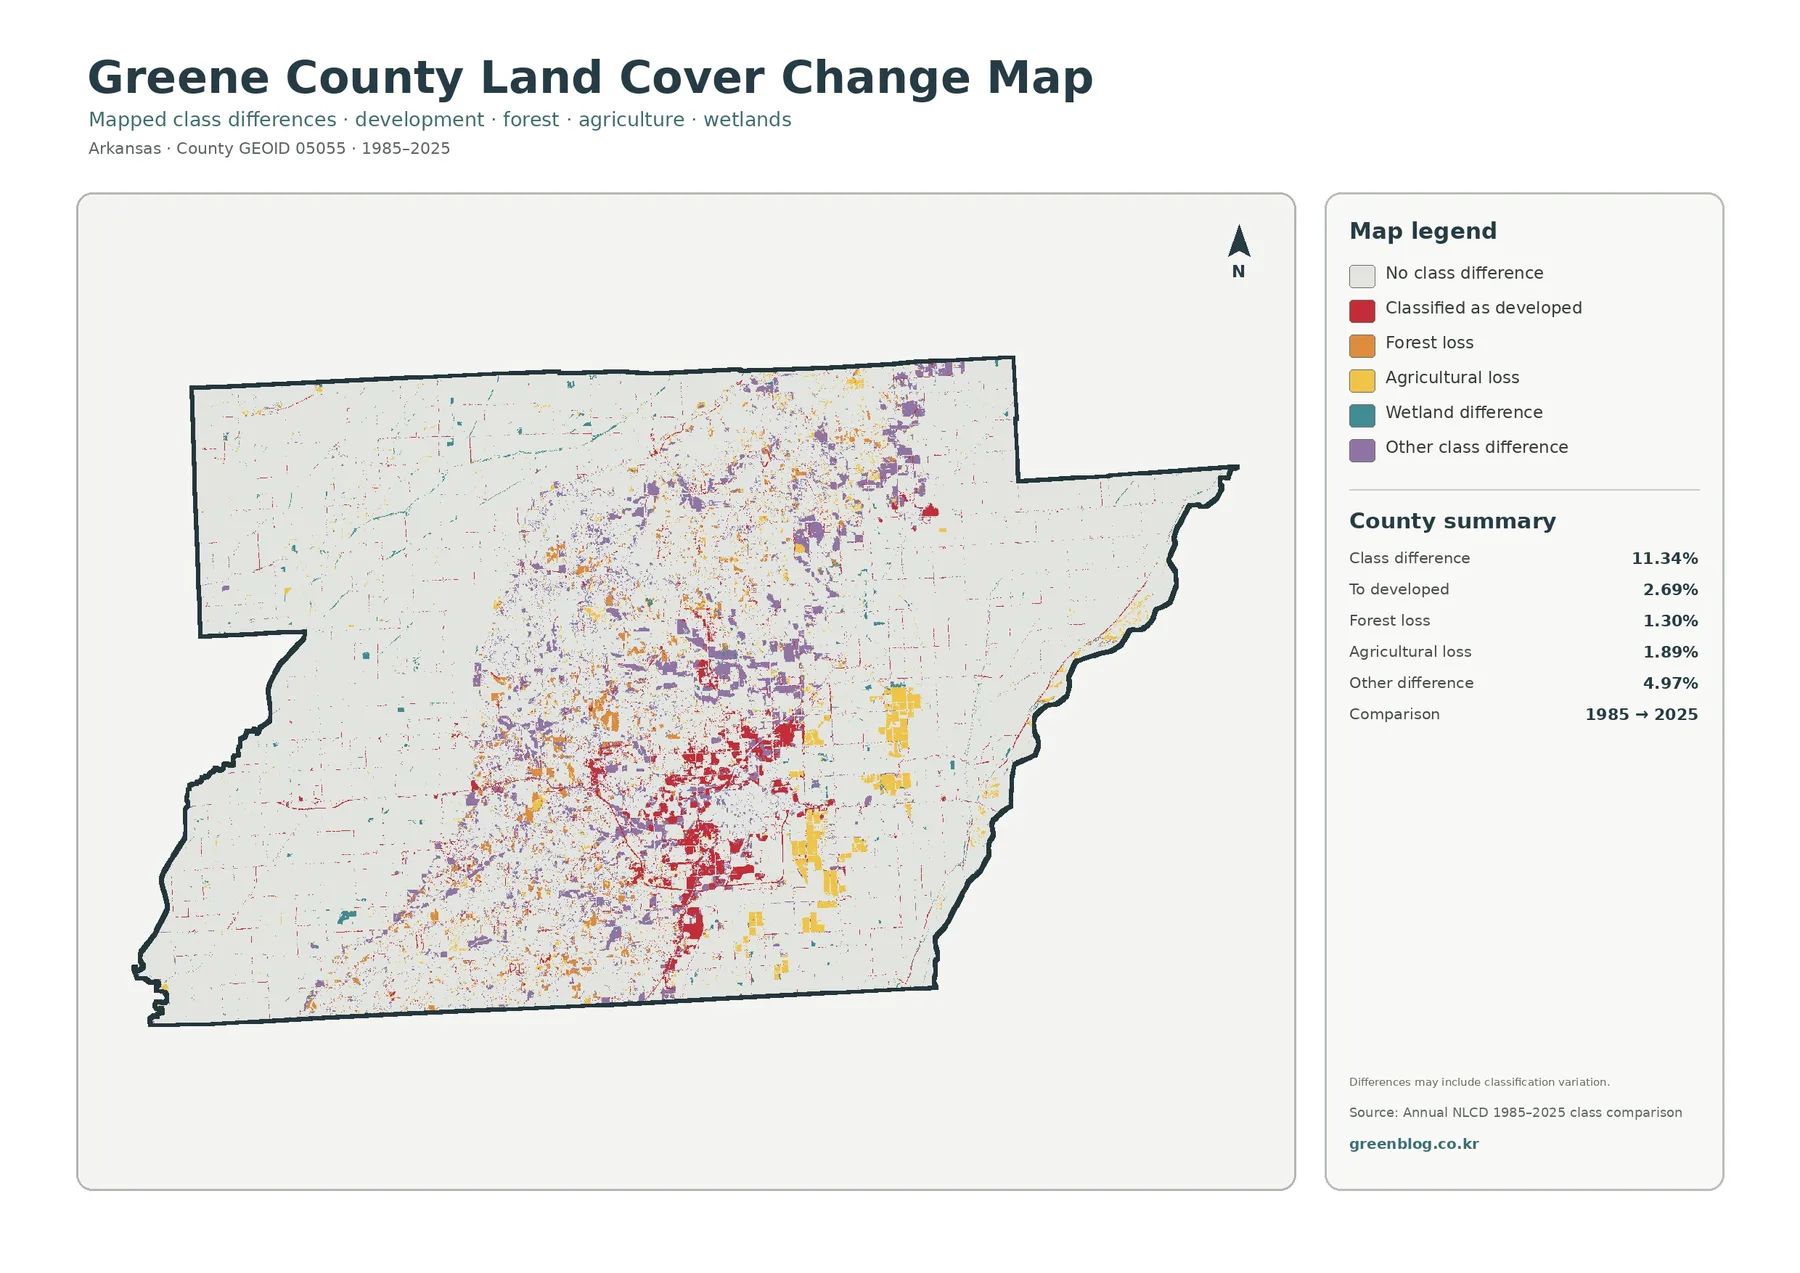
The 1985–2025 comparison reports an overall class difference of 11.34%. Its summary separates 2.69% classified as developed, 1.30% forest loss, 1.89% agricultural loss, and 4.97% other class difference. Wetland differences are also mapped. Because several categories contribute to the total, 11.34% must not be presented as the share of Greene County that urbanized.
Change-to-developed pixels are most concentrated around the Paragould area and extend through nearby corridors. Orange forest-loss cells are more scattered through the ridge, while yellow agricultural-loss patches appear in parts of the farming country. Purple other-class differences occur widely along the central transition zone. The map therefore points to several different kinds of change rather than a single countywide process.
A colored change cell identifies a classification difference, not a proven cause. Forest loss could reflect harvest, conversion, disturbance, regrowth cycles, or classification effects; agricultural differences can also result from rotations, transitions, water conditions, or other changes. The map itself warns that differences may include classification variation, so important locations should be checked against aerial imagery, field records, or other dated evidence.
Annual NLCD Collection 1.2 extends the annual series through 2025 at 30-meter resolution. That consistent time series makes it valuable for screening long-term patterns across multiple counties. For Greene County, the best use of the change layer is to identify places that deserve closer inspection after the 2025 cover pattern is already understood.
Local Geography Adds Meaning to the Pixel Pattern
Paragould is the county seat, and the official Greene County site also lists Delaplaine, Lafe, Marmaduke, and Oak Grove Heights among its cities. The supplied maps do not label city boundaries, yet the settlement information helps readers understand why several developed clusters appear at different locations. The largest hard-surface concentration is consistent with Paragould’s role as the primary county center, while smaller clusters reflect a more dispersed rural settlement pattern.
Crowley’s Ridge State Park and Lake Frierson are two county recreation areas highlighted by local government sources. The state park is described as a hardwood-and-pine setting on the western slope of Crowley’s Ridge. Those facts provide geographic context for the wooded central band, but the land-cover product does not draw park boundaries or distinguish public forest from private forest. A dark-green cell identifies forest cover, not ownership or protected status.
Greene County’s Extension office provides research-based education in agriculture, soil testing, animals and forages, gardening, and related subjects. That local program context is useful in a county where agriculture occupies more than two thirds of the mapped surface. The land-cover layers can establish where agriculture, forest, wetlands, and development occur broadly; management recommendations still require crop, soil, property, and field information that these images do not contain.
Choose the Layer That Fits the Question
Start with the general 2025 cover when the goal is to describe the whole county. It keeps agriculture, forest, development, wetlands, water, and minor classes together, so the broad Delta–ridge contrast can be seen at once. Move to the forest-and-farmland view when the question is specifically about cropland versus trees and other open rural cover. The simplified legend makes the ridge boundary easier to follow.
Use fractional impervious cover when a project is about built surfaces rather than the broader developed class. The Paragould concentration becomes much clearer there, and thin transportation corridors are easier to see. For a time comparison, pair the 2025 land-cover view with the 1985–2025 difference layer so current cover and changed classification are not confused.
The four views can also be mixed selectively in presentations. A farming-focused report might use the general and forest/farmland images; a settlement discussion might pair general cover with impervious surface; a long-term environmental lesson might use current cover beside the change layer. Choosing only the relevant images often produces a clearer explanation than placing every legend on one page.
County comparisons should keep year and classification system consistent. Comparing Greene County’s 2025 Annual NLCD results with another Arkansas county from the same source makes differences in agriculture, forest, development, and wetlands easier to interpret. Mixing years or unrelated datasets can make methodology look like geography, so source and date should be checked before drawing regional conclusions.
Resolution and Classification Limits
Annual NLCD Collection 1.2 uses 30-meter raster cells. A raster divides the landscape into a regular grid and assigns a representative class to each cell. Real ground conditions can be more complicated: a single cell may contain trees, grass, a road, a ditch, and a building at the same time. The mapped class is therefore a generalized description rather than a survey of every feature inside the cell.
Mixed pixels matter most around edges. Along Crowley’s Ridge, narrow forest openings and small roads may blend with surrounding tree cover. On the agricultural plains, small drainage features can be narrower than a cell. Around Paragould, a developed cell may combine rooftops, pavement, yards, and trees. These scale effects do not make the dataset unusable; they simply define the level at which it should be interpreted.
Land cover is also different from land use and legal status. Agriculture cover does not prove agricultural zoning, developed cover does not grant a building right, and a wetland class is not a jurisdictional wetland determination. Property ownership, zoning, permits, parcel boundaries, and regulatory decisions must come from the appropriate county, state, or federal source.
The 2025 layer is a snapshot of one mapping year. Cropping cycles, construction, forest management, water levels, and natural change can alter the ground after the observation period. For current decisions, use these maps as broad context and check newer imagery or local records. For parcel-scale work, use property and survey information designed for that purpose.
Download the Four Original JPG Files
Inside the download are four original Greene County JPG files: 2025 general land cover, forest and farmland, impervious surface and developed land, and the 1985–2025 land-cover class-difference view. Each supplied original is 2480 × 1754 pixels. The files are kept at that native size rather than enlarged or re-encoded to claim a higher print specification, so they are best treated as the original reference images provided with this set.
Frequently Asked Questions
Does 68.06% agriculture mean the entire county is one continuous farming area?
No. The percentage is a countywide total. Agriculture covers broad eastern and western plains, but the central Crowley’s Ridge area has much more forest, Paragould has concentrated development and hard surfaces, and wetlands and water interrupt the farming pattern in several places.
Why are 7.72% developed cover and 2.11% mean impervious cover different?
Developed land cover can include lawns, trees, and other pervious surfaces mixed with buildings and streets. Fractional impervious cover measures the share of each 30-meter cell occupied by hard materials such as pavement and rooftops, so it answers a narrower question.
Does 11.34% class difference mean 11.34% of Greene County was developed?
No. The total includes several kinds of classification difference between 1985 and 2025. The summary separately reports 2.69% changed to developed, 1.30% forest loss, 1.89% agricultural loss, 4.97% other class difference, plus mapped wetland differences.
What files are included in the download?
The download contains four Greene County JPGs: general land cover, forest and farmland, impervious surface and developed land, and land-cover change. Each original file is 2480 × 1754 pixels.
Map File Information
The ZIP contains the four original Greene County JPG maps used for the 2025 land-cover and 1985–2025 class-difference comparison.
- Included Files: Use only the versions confirmed in the article and supplied images
- File Type: Use the confirmed download contents
- Intended Use: Printing, education, presentations, and map-based projects
Related Maps
- A Craighead County Arkansas Land Cover Map
- Arkansas County Arkansas Land Cover Map
- Ashley County Arkansas Land Cover Map
Sources and Reference Links
- MRLC Annual NLCD Data — annual land-cover products and data access
- USGS Annual NLCD Collection 1.2 Land Cover — 1985–2025 coverage and 30-meter raster product information
- U.S. Census Bureau TIGER/Line Shapefiles — county boundary reference
- Greene County, Arkansas official website — Paragould, Crowley’s Ridge State Park, waterways, and county context
- Association of Arkansas Counties — Greene County — Delta farmland, Crowley’s Ridge, and agricultural background
- University of Arkansas System Cooperative Extension Service — Greene County — local agriculture and natural-resources education
Green Map creates custom-edited map images using open geographic data sources such as geoBoundaries, Natural Earth, OpenStreetMap, and government open data.
These maps are edited visual materials, not raw data files, and are provided for education, documents, presentations, and graphic reference.