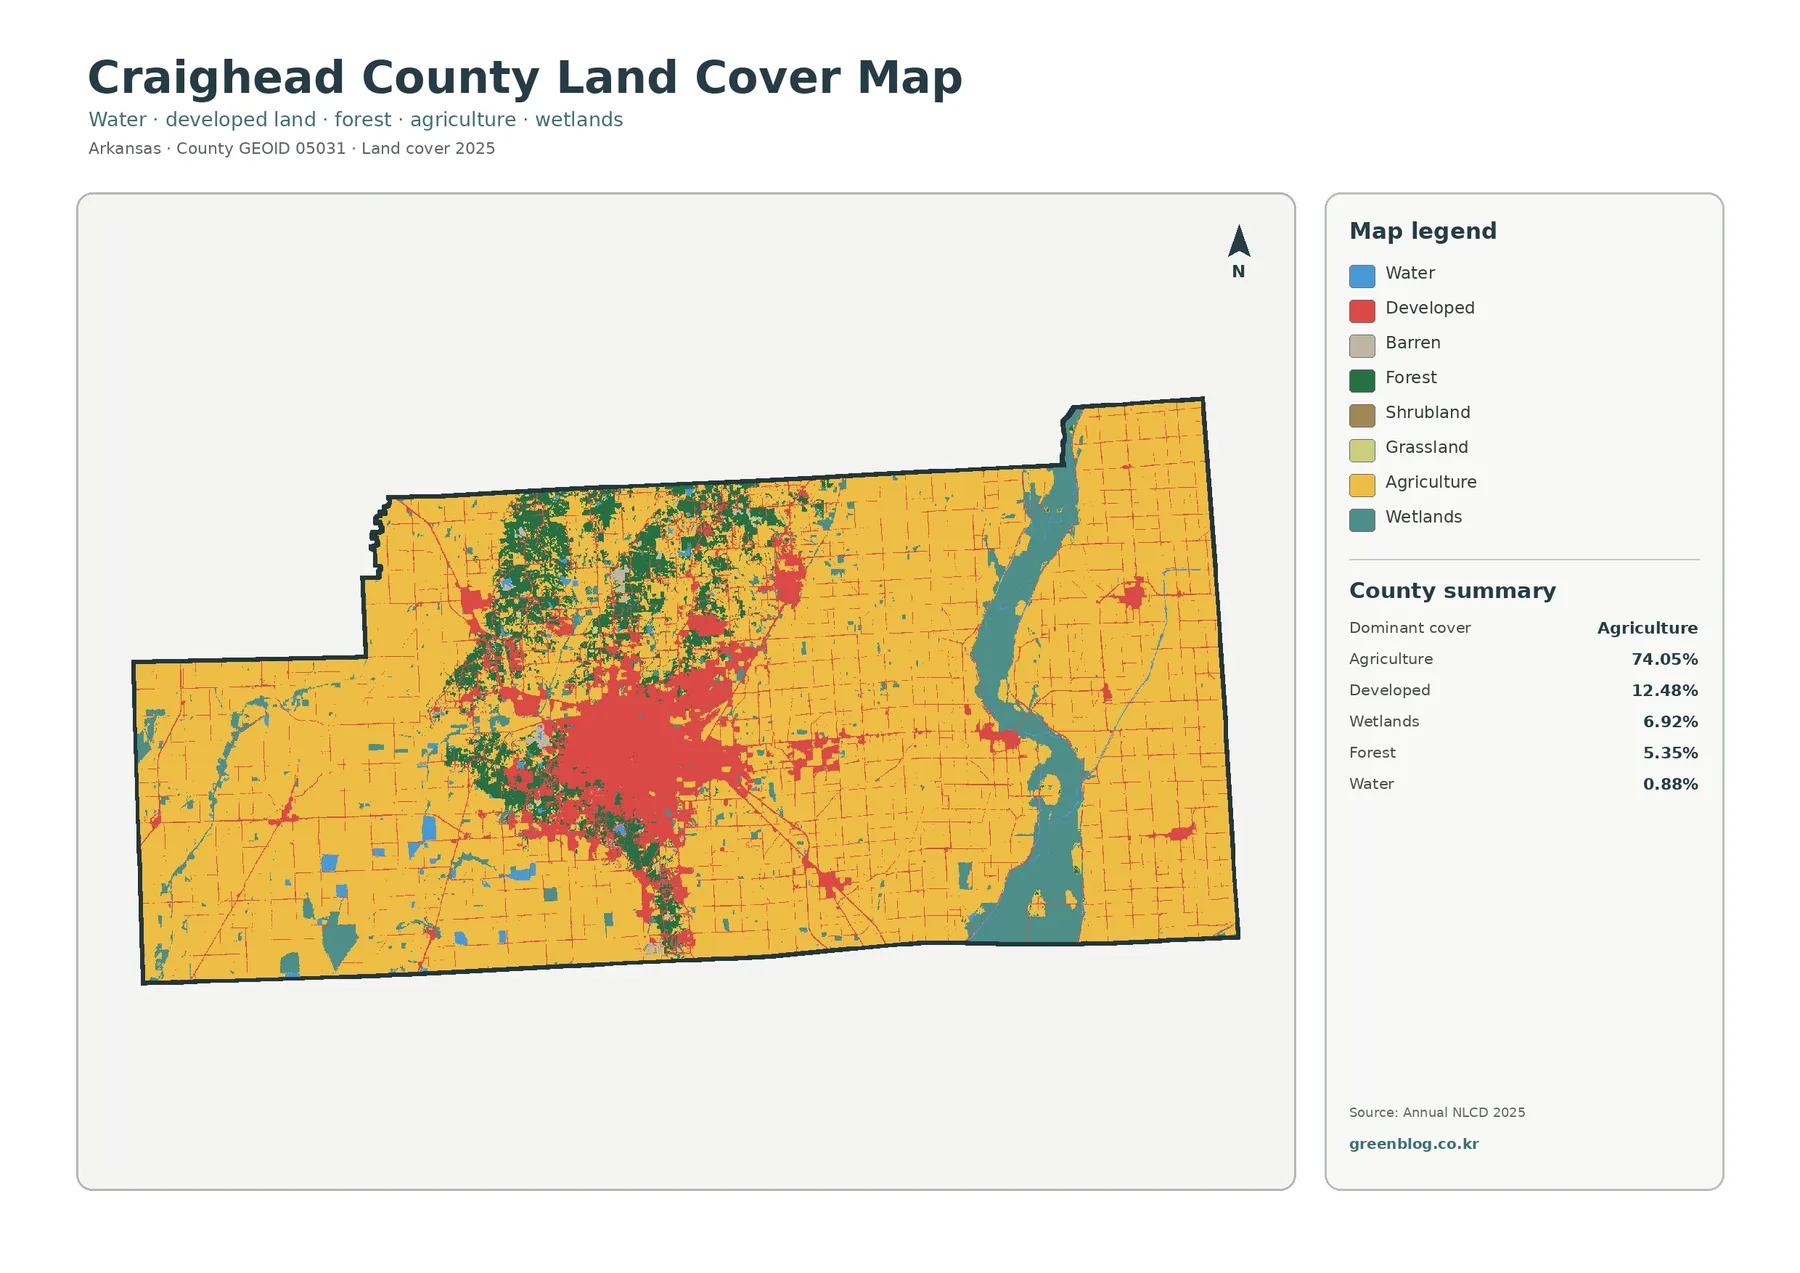
Craighead County Arkansas Land Cover Map views show a county where agriculture dominates the 2025 classification but does not erase strong local contrasts. Cropland occupies most of the east and west, Jonesboro forms a large developed center, wooded patches are more noticeable around the central ridge, and wetlands create a distinct corridor in the eastern part of the county.
The page includes four separate ways to examine that pattern: current land cover, forest and farmland, impervious surface, and a 1985–2025 class comparison. The four original JPG files are available together in the download section, so the same set can be used for classroom work, county reference, environmental discussion, or presentation graphics.
Table of Contents
Begin with the contrast between Jonesboro and the surrounding fields
Start in the center-west, where Jonesboro forms the county’s largest continuous developed area. Smaller built patches and narrow road-like lines extend beyond the urban core, but agricultural cover soon becomes dominant in every direction. The contrast explains why the county can be 74.05% agricultural while still containing a city that is visually prominent on the map: development is concentrated, whereas cropland spreads across broad sections of the county.
County totals for 2025 are 74.05% agriculture, 12.48% developed cover, 6.92% wetlands, 5.35% forest, and 0.88% water; grassland is 0.06% and shrubland 0.01%. Percentages establish the overall balance, while the mapped distribution shows where those classes matter most—around the Jonesboro urban core, through the wooded central and northern zone, and along the wetter eastern side.
Concentration matters as much as countywide share when reading Craighead County. Developed cover occupies far less area than agriculture, yet Jonesboro stands out because much of the built land is connected. Forest is smaller still, but its green patches gather around parts of the central and northern county instead of being spread evenly. Comparing those locations with the percentages helps distinguish a locally conspicuous class from one that dominates the county as a whole.
Why the eastern side deserves separate attention
Eastern Craighead County breaks the otherwise broad agricultural pattern. A long wetland feature threads through the fields, with water appearing within and beside that wetter corridor. Lake City sits in this eastern part of the county near the St. Francis River, which provides geographic context without requiring every colored cell to be tied to a named channel. Because the land-cover image does not label each river or ditch, the reliable observation is the concentration of wetland and water classes themselves.
Wetlands make up 6.92% of the 2025 total, exceeding forest at 5.35%, even though the surrounding agricultural cover can make them seem less extensive at first glance. Their elongated and irregular shapes differ from Jonesboro’s compact developed footprint, so area is harder to estimate visually. Water is only 0.88%, yet the blue features are easier to interpret when read together with the neighboring wetland corridor.
Land-cover classes describe what is detected at the surface, not legal or regulatory status. An Annual NLCD cell labeled wetland is not automatically a legally delineated wetland, and this county image does not substitute for a flood-hazard map. Parcel-level permitting or environmental decisions require the relevant wetland, flood, drainage, property, and field records in addition to this broader county view.
Forest and farmland reveal the county’s central ridge more clearly
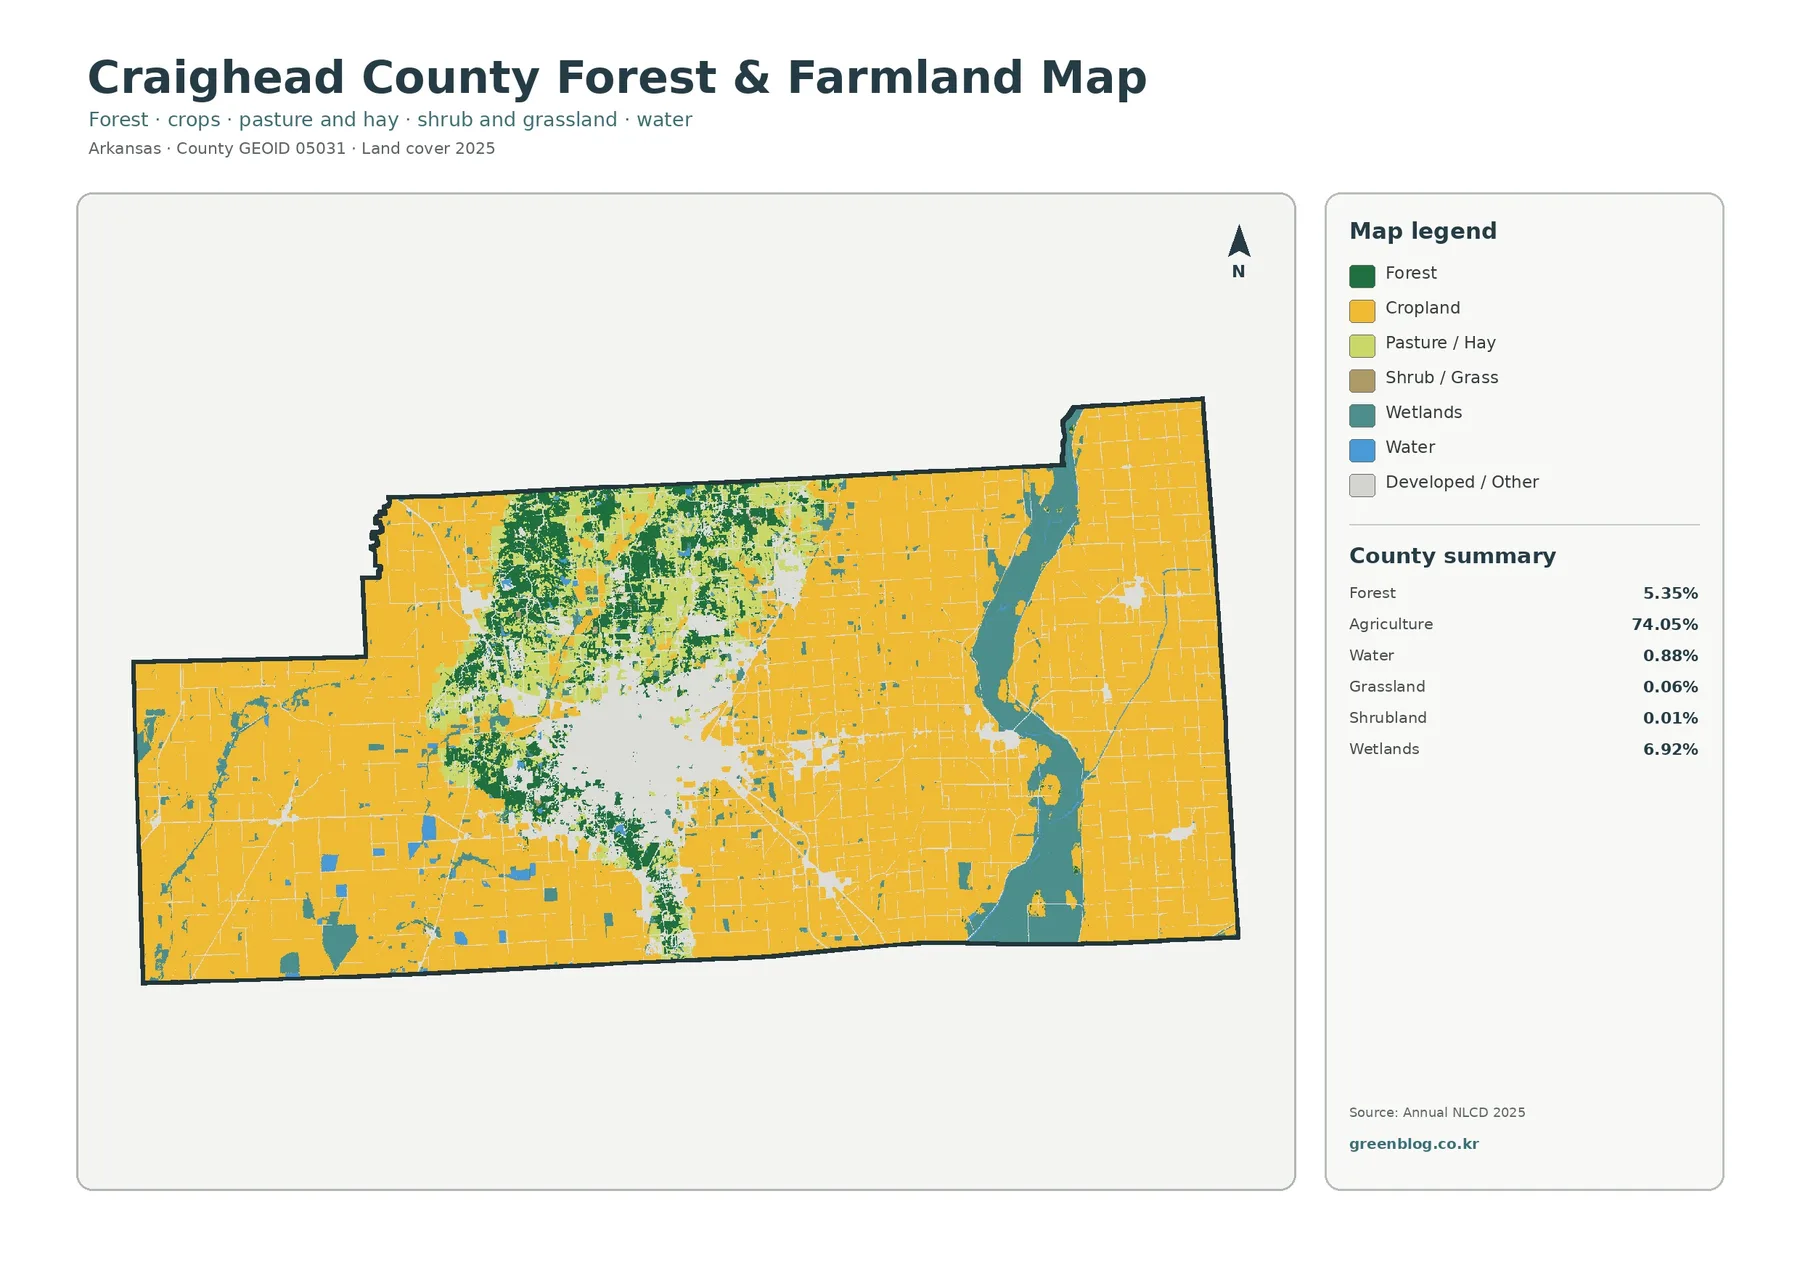
With most other classes muted, the forest-and-farmland view makes Craighead County’s rural contrast easier to follow. Cropland fills the broad plains on both sides, while forest patches become more noticeable north and northwest of Jonesboro and through parts of the central corridor. That concentration fits the broader county context of Crowley’s Ridge passing through the middle, although the land-cover layer should not be treated as a precise topographic outline of the ridge.
Agriculture is not one uninterrupted surface. Jonesboro creates a large break in the fields, wooded areas divide the agricultural pattern near the ridge, and eastern wetlands interrupt cropland in a different way. Farther into the open western and eastern plains, fields form much broader and more regular blocks. These differences show how an overwhelmingly agricultural county can still contain a substantial urban center and clearly defined natural areas.
Other legend classes include pasture or hay, shrub or grass, wetlands, water, and developed or other cover. County totals place grassland and shrubland at very small shares, so neither should be presented as a major landscape theme. Crop type, farm ownership, zoning, and field boundaries are outside the scope of this layer; the classification describes surface cover rather than agricultural parcels.
Impervious cover shows the built footprint more precisely than the red developed class
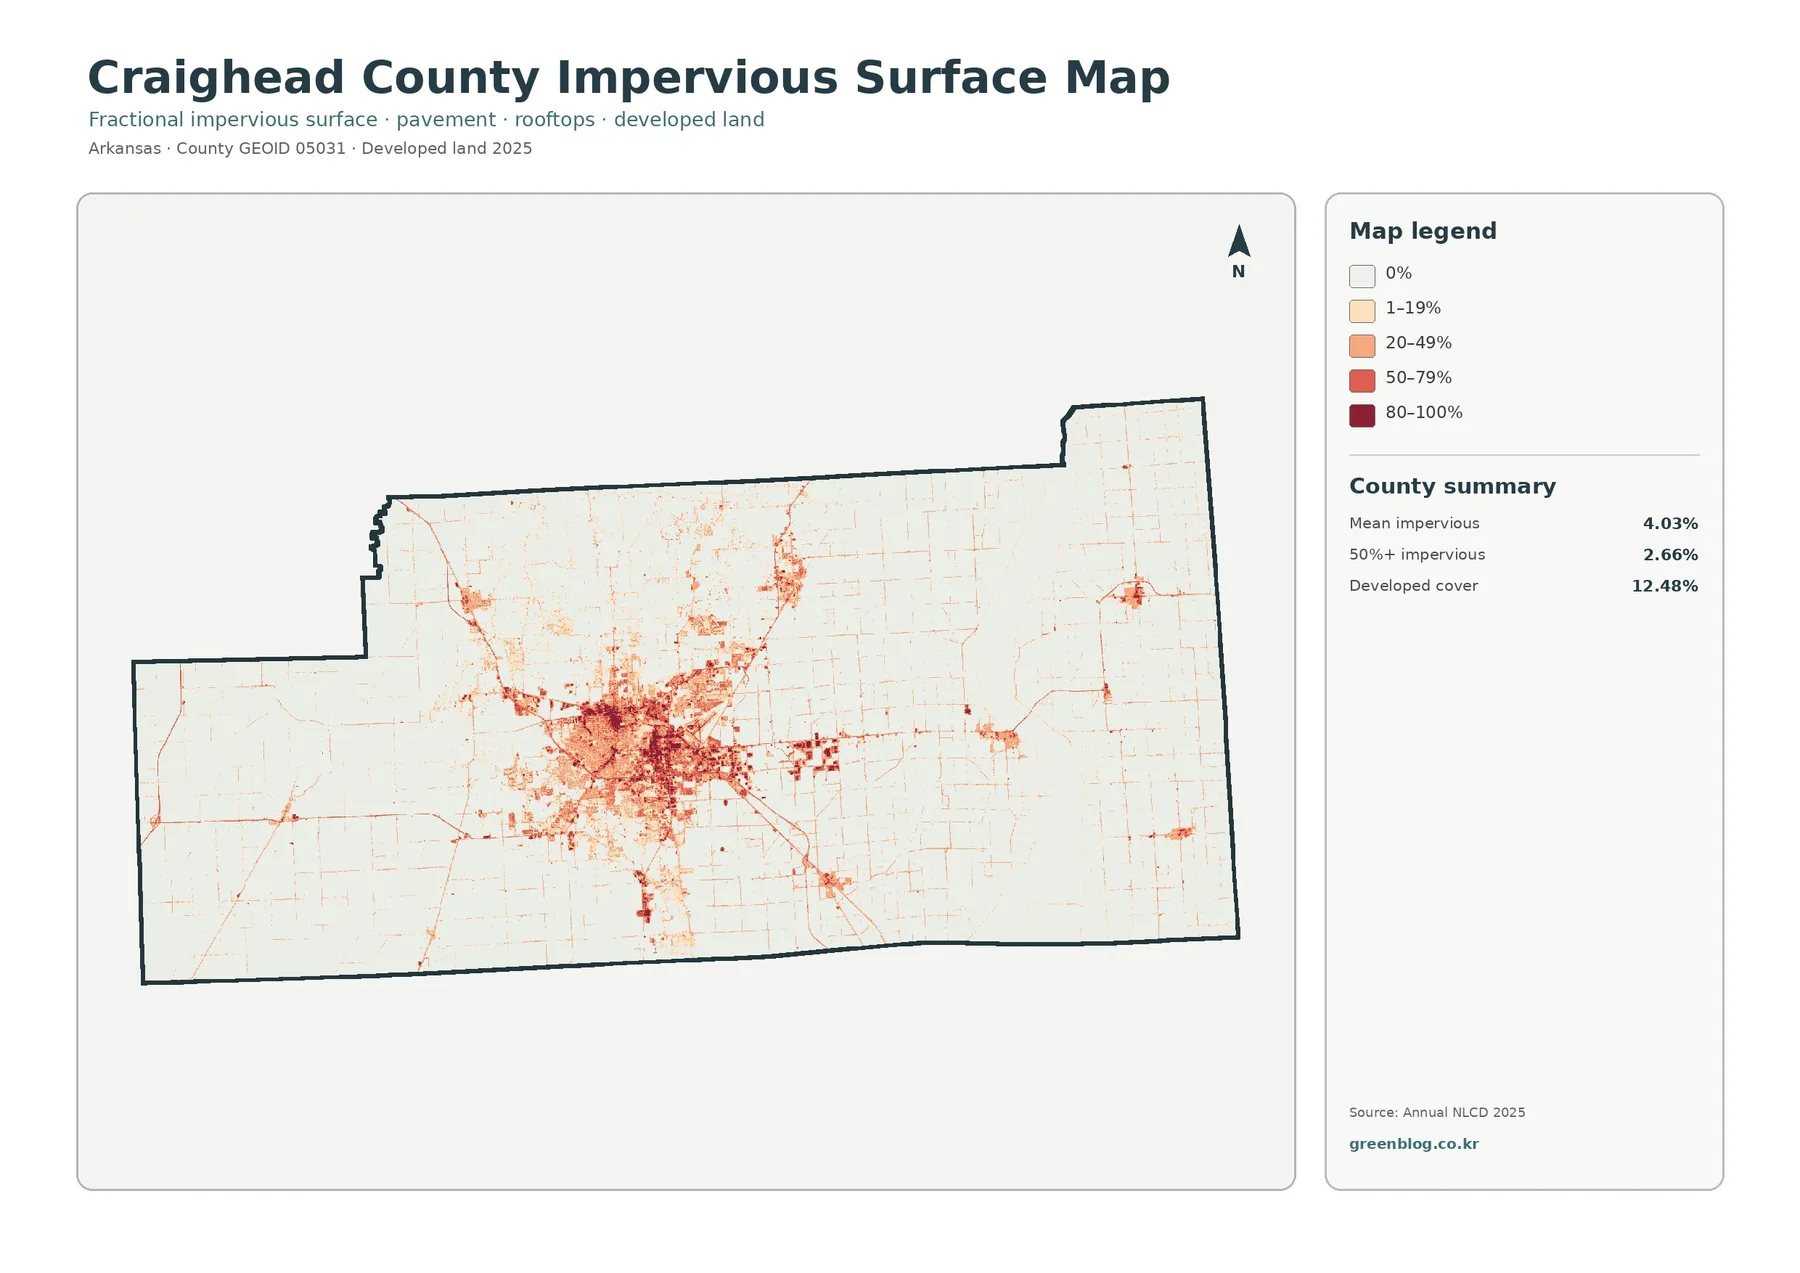
Impervious surface refers to pavement, rooftops, parking areas, and similar surfaces that do not readily absorb water. Across Craighead County, the 2025 mean impervious value is 4.03%, and 2.66% of the county is mapped at 50% or more impervious. Developed land reaches 12.48% because developed classes can also contain lawns, trees, bare soil, and other surfaces that still allow some infiltration.
Jonesboro stands out most clearly on the impervious view. Darker tones fill the urban core, lighter built patterns extend outward, and narrow lines trace portions of the road network. Smaller concentrations occur at settlements to the north and east, while most agricultural areas remain pale except for roads and scattered structures. The result separates broad rural fields from compact paved centers more sharply than the general land-cover view does.
For development studies, the impervious layer helps locate where paved and roofed surfaces are concentrated, especially around Jonesboro. It cannot predict runoff or flooding on its own: drainage systems, rainfall, soils, slope, and nearby channels can make places with similar impervious percentages behave differently. Treat the layer as one piece of a broader water or planning analysis rather than a direct forecast of drainage problems.
The 1985–2025 comparison is not a simple urban-growth percentage
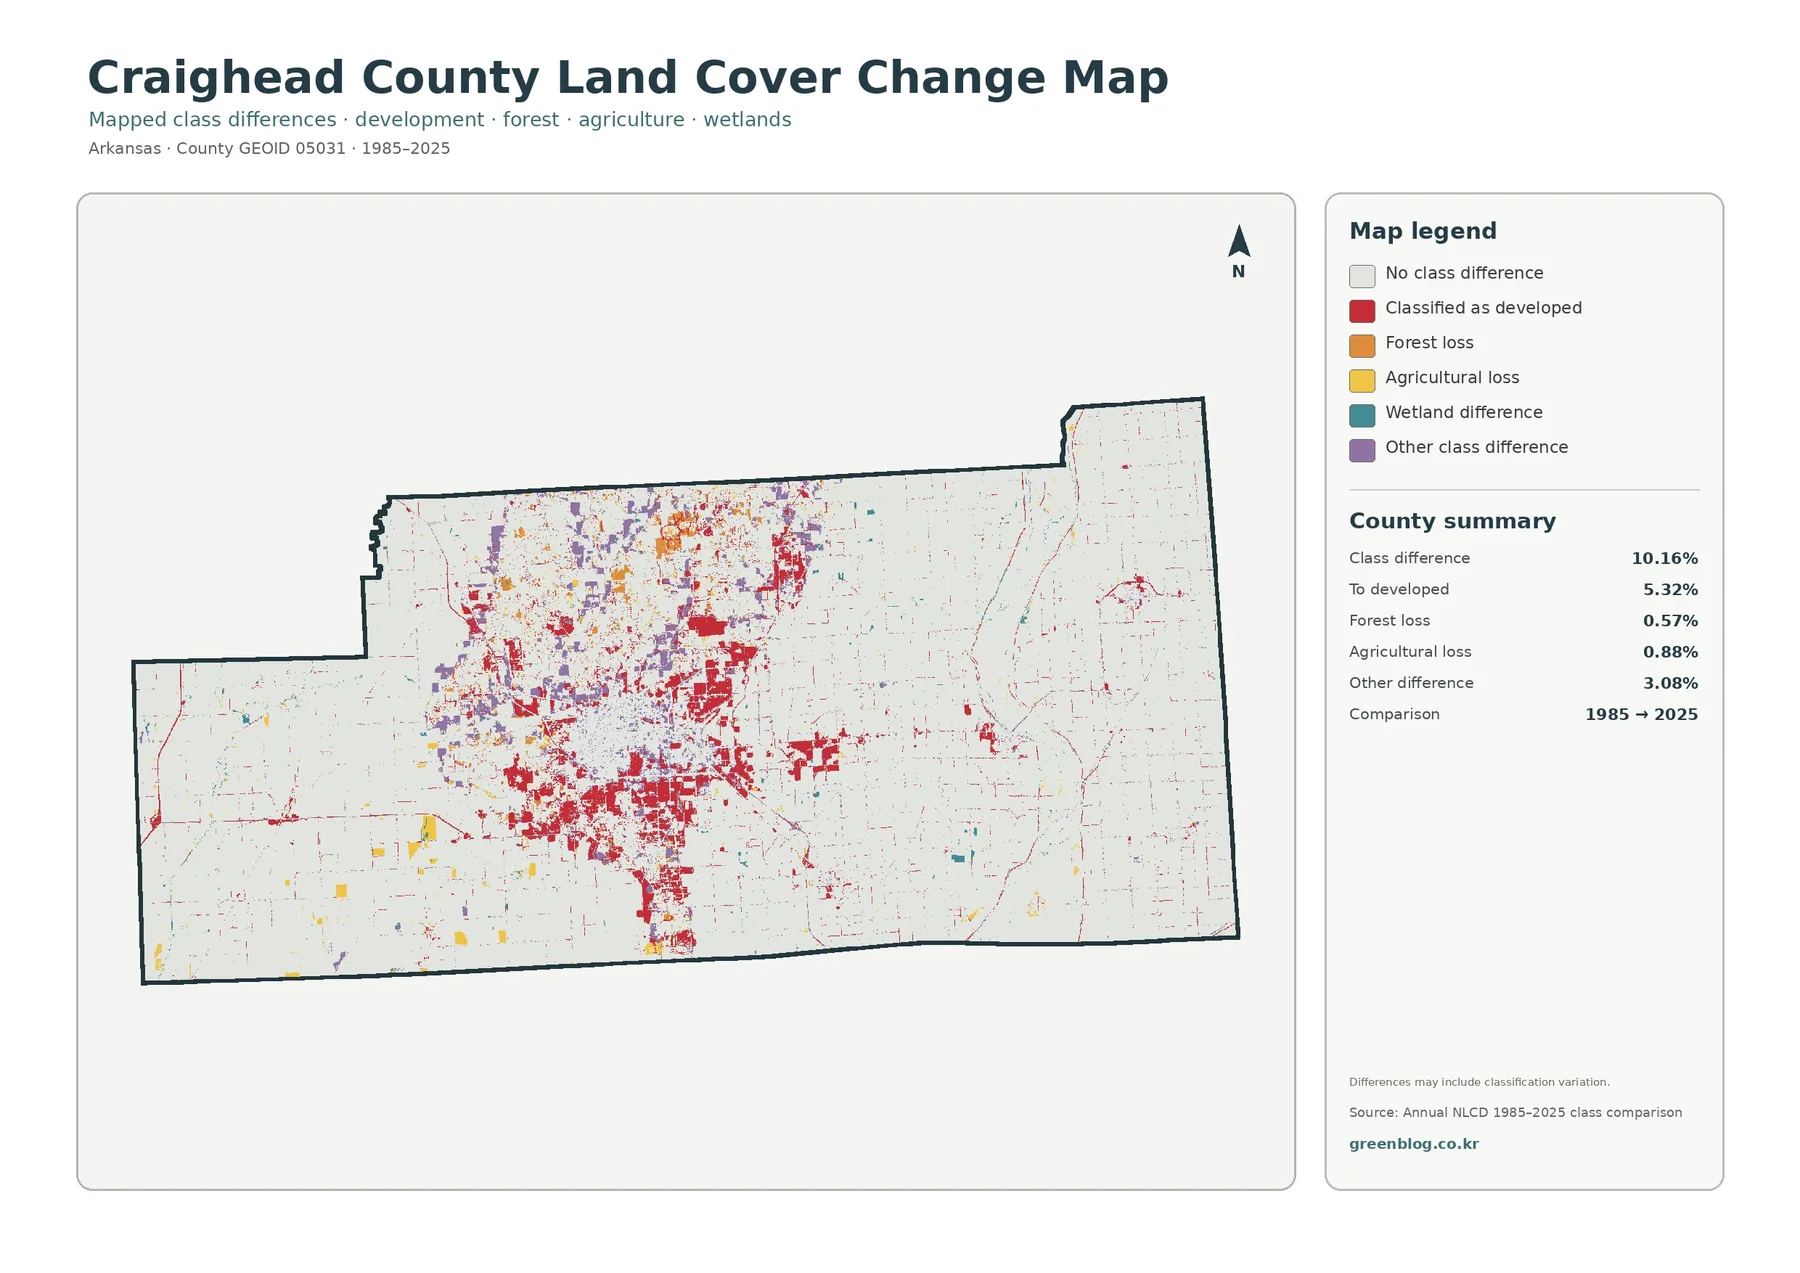
The 1985–2025 comparison marks cells whose land-cover class differs between the two endpoints. Overall class difference is 10.16%, including 5.32% categorized as change to developed land, 0.57% as forest loss, 0.88% as agricultural loss, and 3.08% as other class difference. Wetland difference appears in the legend, but no separate percentage is printed for it in the county summary, so assigning one would go beyond the supplied data.
Around Jonesboro, red change-to-developed cells form the most obvious cluster. Smaller red patches appear near other settlements and along road-like corridors, while purple other-difference cells are more scattered north and northwest of the urban core. Forest-loss and agricultural-loss colors occur in smaller patches. Their separate locations make clear that the 10.16% total combines several types of classification difference rather than a single process.
Change to developed land, at 5.32%, is a classification result rather than a measure of population growth, building permits, or annexation. A forest-loss cell likewise does not identify why tree cover changed. The comparison can point to locations worth investigating, but causes require additional imagery, local records, or field evidence; the change-map note also warns that some differences may reflect classification variation.
Download the four original JPG files
The download package contains four original JPG files: the 2025 land-cover view, forest-and-farmland view, impervious and developed-land view, and the 1985–2025 class-difference view. Each image is 2480 × 1754 pixels. Because the files are separate, one can serve as the main figure while the others provide focused comparisons in a report, slide deck, lesson, or local reference project.
Keep the legend and year visible when placing any of the JPG files in a document. Cropping those elements can make similar colors difficult to distinguish, especially where wetlands, water, forest, and developed classes meet. The original package size is 2480 × 1754 pixels per image, and enlarging beyond that size cannot add classification detail that is not present in the source raster.
Frequently Asked Questions
What is the dominant 2025 land-cover class in Craighead County?
Agriculture is the dominant class at 74.05%. Developed cover is 12.48%, wetlands 6.92%, forest 5.35%, and water 0.88%. The percentages describe countywide area, while the maps show that development is concentrated around Jonesboro and wetlands are much more noticeable in the east.
Why is developed cover 12.48% when mean impervious surface is only 4.03%?
Developed classes can include lawns, trees, soil, and other surfaces that still absorb water, whereas the impervious measure focuses on pavement, rooftops, and similarly sealed surfaces. They describe related but different characteristics, so the percentages are not expected to match.
Does the 10.16% class difference mean that 10.16% of the county became urban?
No. The 10.16% figure covers all mapped class differences between 1985 and 2025. Change to developed land is a separate 5.32% category. Forest loss, agricultural loss, wetland difference, other class differences, and possible classification variation are also part of the comparison.
Map File Information
The ZIP contains the four original Craighead County land-cover JPG maps discussed on this page.
- File Type: Four JPG images in one ZIP archive
Related Maps
- Arkansas County Arkansas Land Cover Map
- Ashley County Arkansas Land Cover Map
- Baxter County Arkansas Land Cover Map
Sources and data notes
- MRLC Annual NLCD Data – official access point for the annual land-cover datasets used for year-based comparison.
- USGS Annual NLCD Land Cover Classification – definitions for forest, agriculture, developed, wetland, water, and other mapped classes.
- U.S. Census Bureau TIGER/Line Shapefiles – official county boundary and geographic reference resources.
- University of Arkansas Cooperative Extension – Craighead County – local research-based agriculture and community information from the Jonesboro office.
- City of Jonesboro GIS – local access information for city limits, aerial photography, streets, parcels, and other spatial layers.
- Encyclopedia of Arkansas – Craighead County – trusted county context for Crowley’s Ridge, Jonesboro, Lake City, and northeastern Arkansas geography.
Green Map creates custom-edited map images using open geographic data sources such as geoBoundaries, Natural Earth, OpenStreetMap, and government open data.
These maps are edited visual materials, not raw data files, and are provided for education, documents, presentations, and graphic reference.