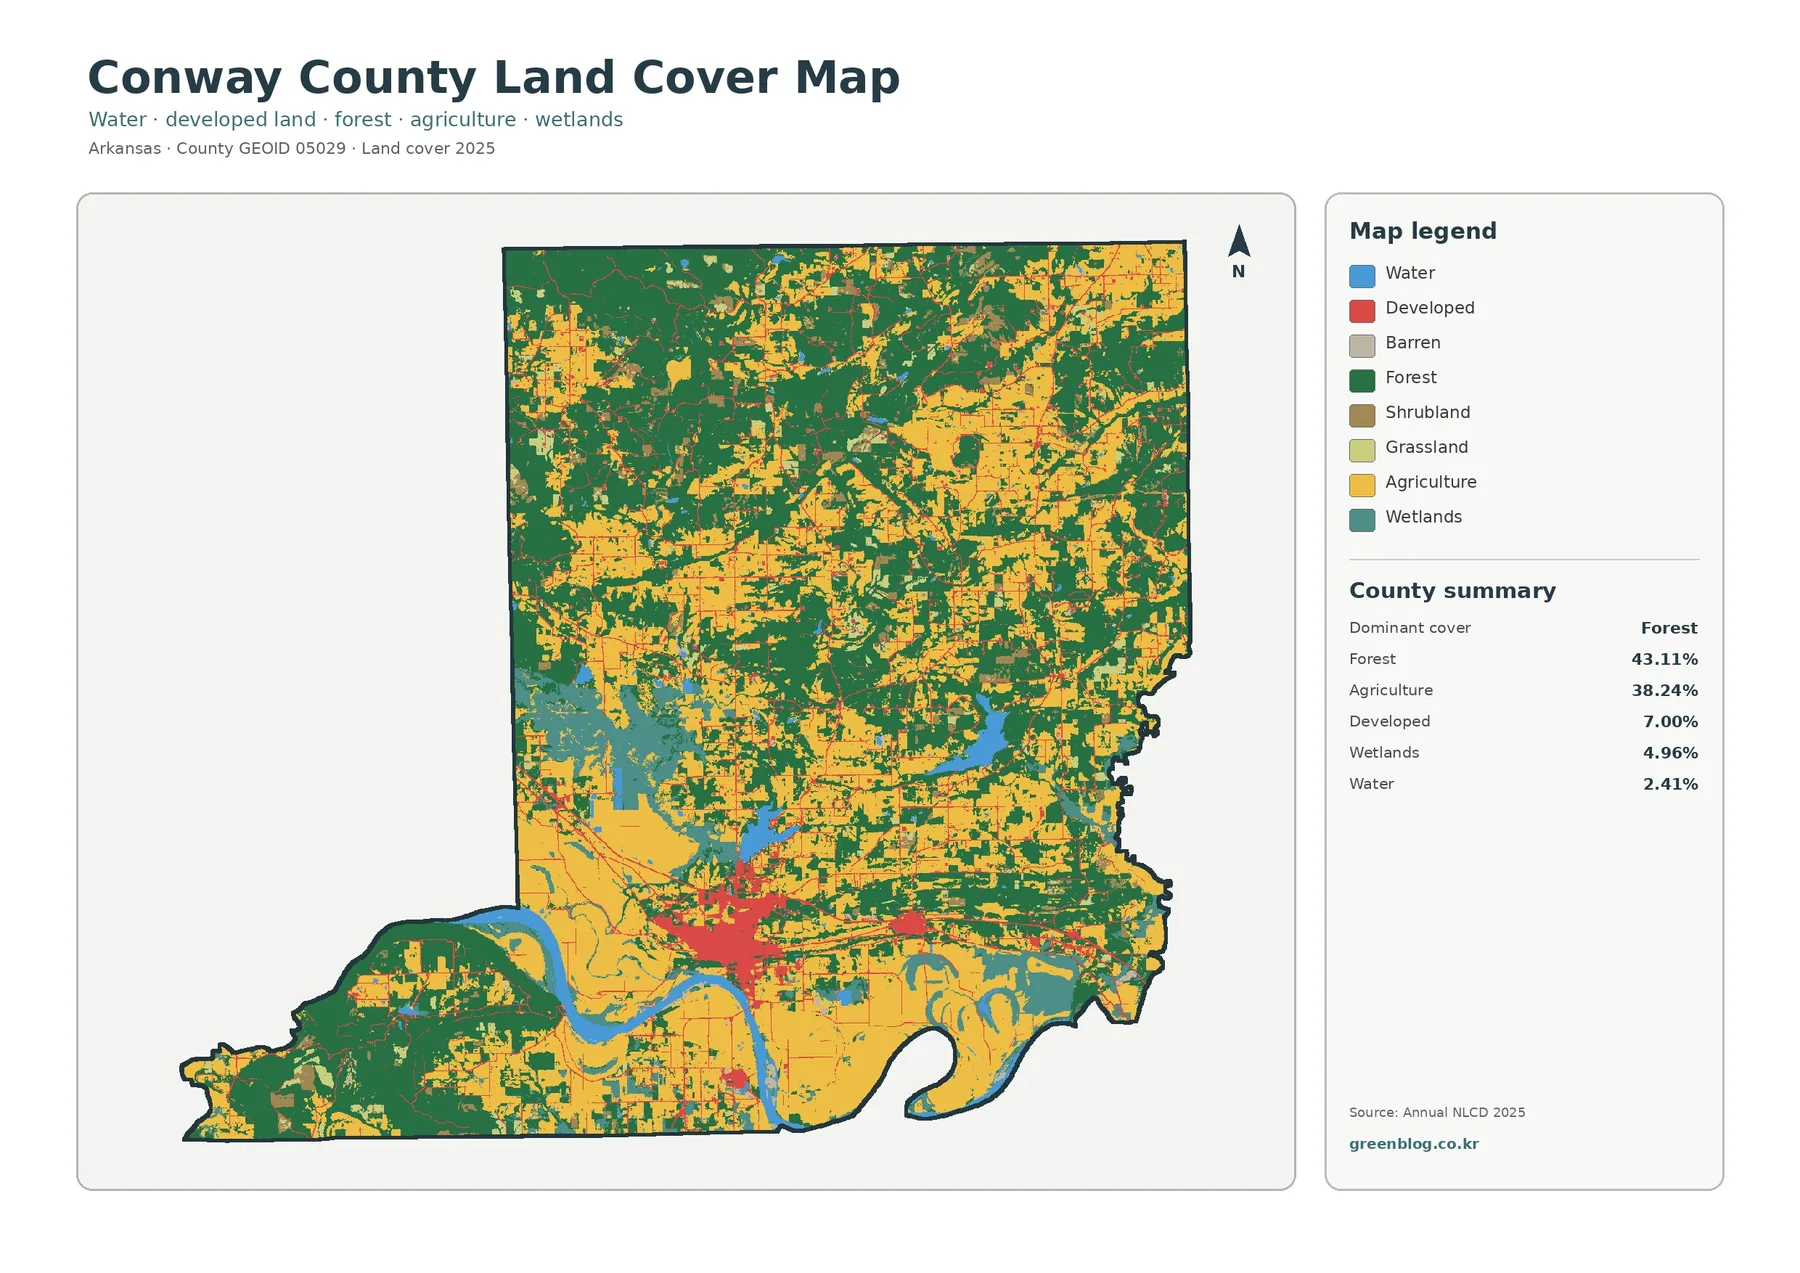
The Conway County Arkansas Land Cover Map shows a county split largely between forest and agriculture, with a much denser built footprint near Morrilton and water-and-wetland features along the southern river corridor. The 2025 summary lists 43.11% forest and 38.24% agriculture, so neither category alone tells the story of the county.
Four views on this page let you compare current land cover, forest and farmland, impervious surfaces, and mapped class differences from 1985 to 2025. The four original JPG maps are also available together in one download for lessons, reports, local reference work, and presentation graphics.
Table of Contents
A county where forest and agriculture both shape the map
The broadest 2025 pattern is the near balance between forest and agricultural cover. Forest accounts for 43.11% of Conway County, while agriculture accounts for 38.24%. Dark green is especially extensive across the northern half and in the southwestern extension of the county. Yellow agricultural areas become more prominent through the center and south, but they are broken by forest patches, wet areas, water, and developed land rather than forming one uninterrupted block.
Developed cover is 7.00%. That share is much smaller than either forest or agriculture, yet its position makes it visually important. The strongest red concentration sits in the south-central part of the county around Morrilton. Narrower developed lines extend away from that cluster, while most northern areas contain only small scattered developed patches. The map therefore separates a compact built center from a much larger rural landscape without suggesting that every developed cell is heavily paved.
Wetlands make up 4.96% and water 2.41%. These categories become more noticeable toward the Arkansas River corridor and in several broader wet areas west and southwest of Morrilton. Shrubland is 2.31% and grassland 1.67%, appearing as smaller pieces among forest and agricultural cover. Reading the percentages beside the colors is useful because some narrow classes are visually prominent even when they occupy a modest share of the county.
Why the forest-and-farmland view is useful
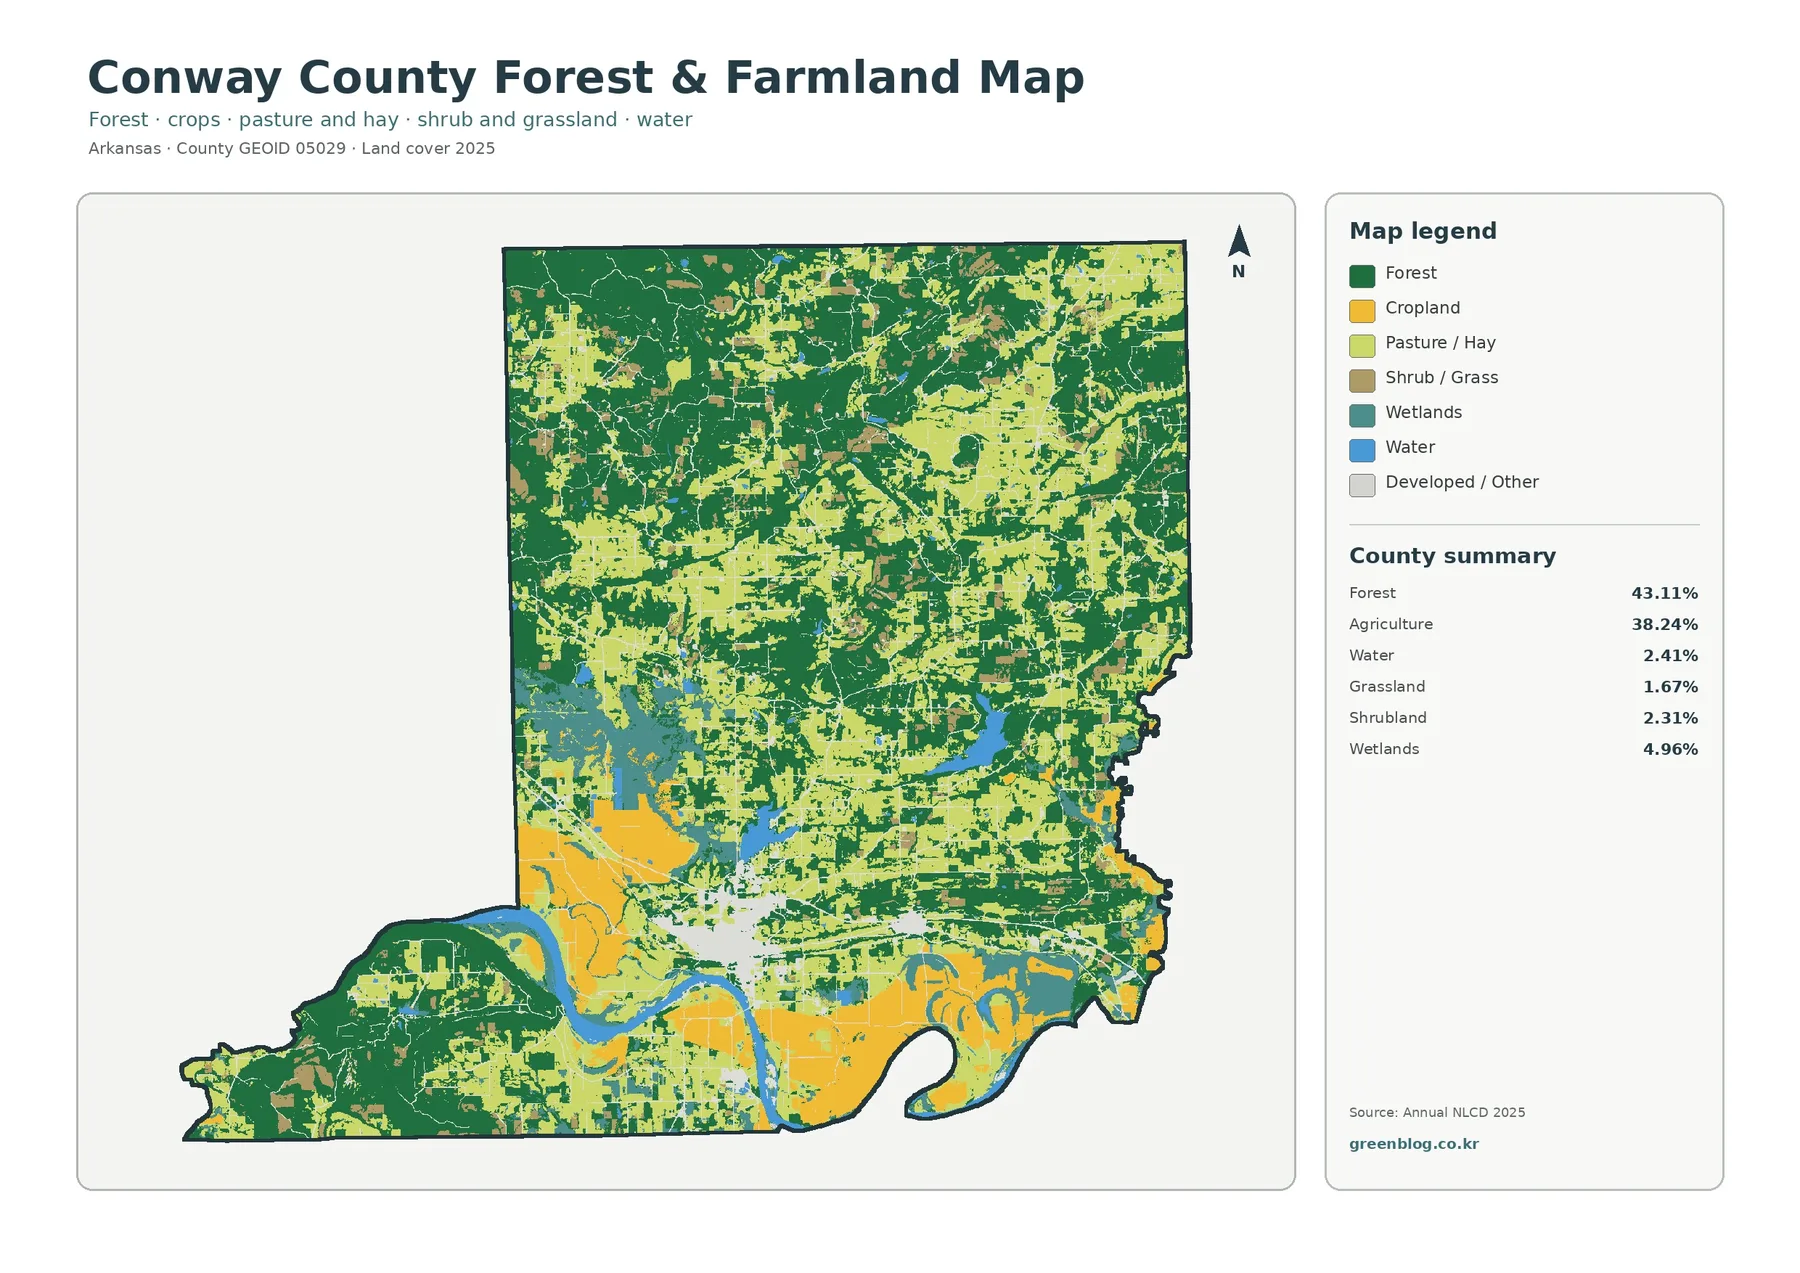
The forest-and-farmland map removes some of the complexity of the full classification and makes the rural pattern easier to follow. Large green forest blocks occupy much of the north, while cropland and pasture or hay are more common across central and southern areas. Forest still appears throughout the south, however, and agriculture also reaches into the north. The result is a mosaic rather than a clean dividing line.
The southern portion near the Arkansas River contains broad agricultural areas separated by water, wetland, and wooded strips. Farther southwest, the county’s protruding section becomes much more heavily forested. Petit Jean State Park lies in this part of Conway County, providing a useful geographic reference for the wooded southwestern landscape. The park reference helps orient the map, but the 43.11% forest figure comes from the supplied 2025 land-cover summary rather than the park website.
Cropland and pasture or hay are shown separately. That distinction matters because an open agricultural-looking area is not necessarily row-crop land. Pasture and hay can form large light-green patches beside yellow cropland. Shrub and grass categories add other open surfaces that should not automatically be counted as agriculture. The map classifies what covers the ground; it does not identify property ownership, zoning, farm boundaries, or whether a parcel is legally designated for agricultural use.
Morrilton stands out on the impervious-surface map
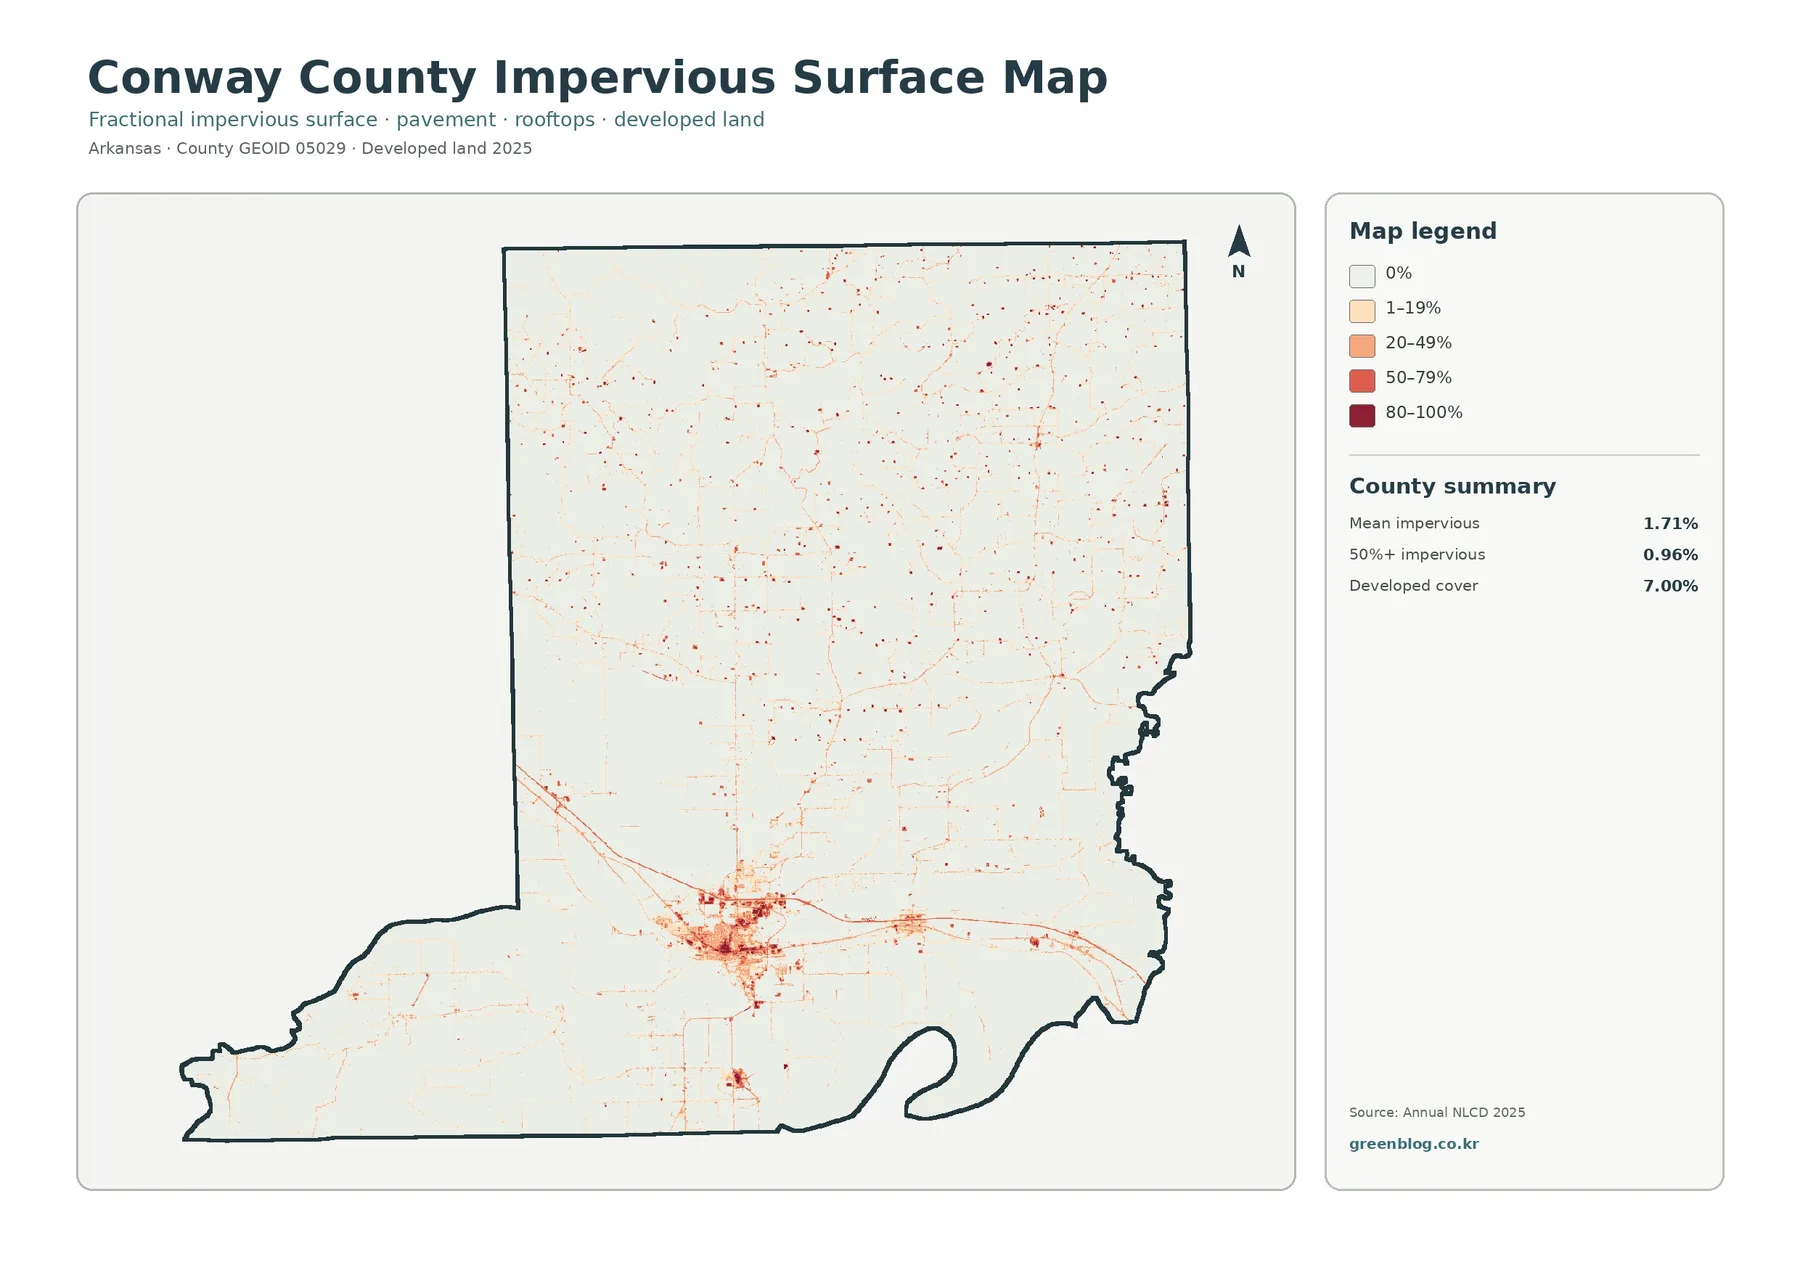
Impervious surface refers to pavement, rooftops, parking areas, and similar surfaces that allow little water to soak directly into the soil. Conway County’s mean impervious value is 1.71%, and 0.96% of the county is mapped at 50% impervious or higher. Developed cover is 7.00%, which is a different measure. A developed area can still contain lawns, trees, bare soil, and other surfaces that absorb water.
The most concentrated impervious footprint is centered on Morrilton. Orange and red cells form a clear south-central cluster, with thin linear features extending east and west and along smaller routes. A separate small concentration appears farther south. Outside these places, most of the county remains pale, punctuated by narrow roads and isolated developed points. This is one of the clearest contrasts among the four maps because the rural majority becomes almost visually empty once forest and farmland colors are removed.
Comparing this view with the general land-cover map prevents a common misunderstanding. The general map answers where land is classified as developed, while the impervious view asks how much of the surface is sealed within each mapped area. A low-density neighborhood can belong to a developed class but still have relatively little pavement. Conversely, a compact commercial or road surface can create a high impervious value in a small footprint.
The Arkansas River corridor adds water and wetland contrast
The southern edge of Conway County is visually different from much of the northern interior. Blue water follows the Arkansas River corridor, and teal wetland areas occur around parts of the river and nearby low-lying surfaces. Agricultural cover often reaches close to those wet areas, creating short transitions among fields, wetlands, wooded strips, and open water. That mix is easy to miss if the county is described only with its two dominant percentages.
A broad wetland-and-water concentration is also visible west of the main developed core. The map can show where these classes lie beside agricultural or forest cover, but it cannot by itself determine flood risk, soil saturation, drainage performance, or water quality. Those questions require elevation, soils, stream networks, rainfall, and watershed information. The land-cover map is best used to identify places for closer investigation rather than as a substitute for those datasets.
What changed between 1985 and 2025
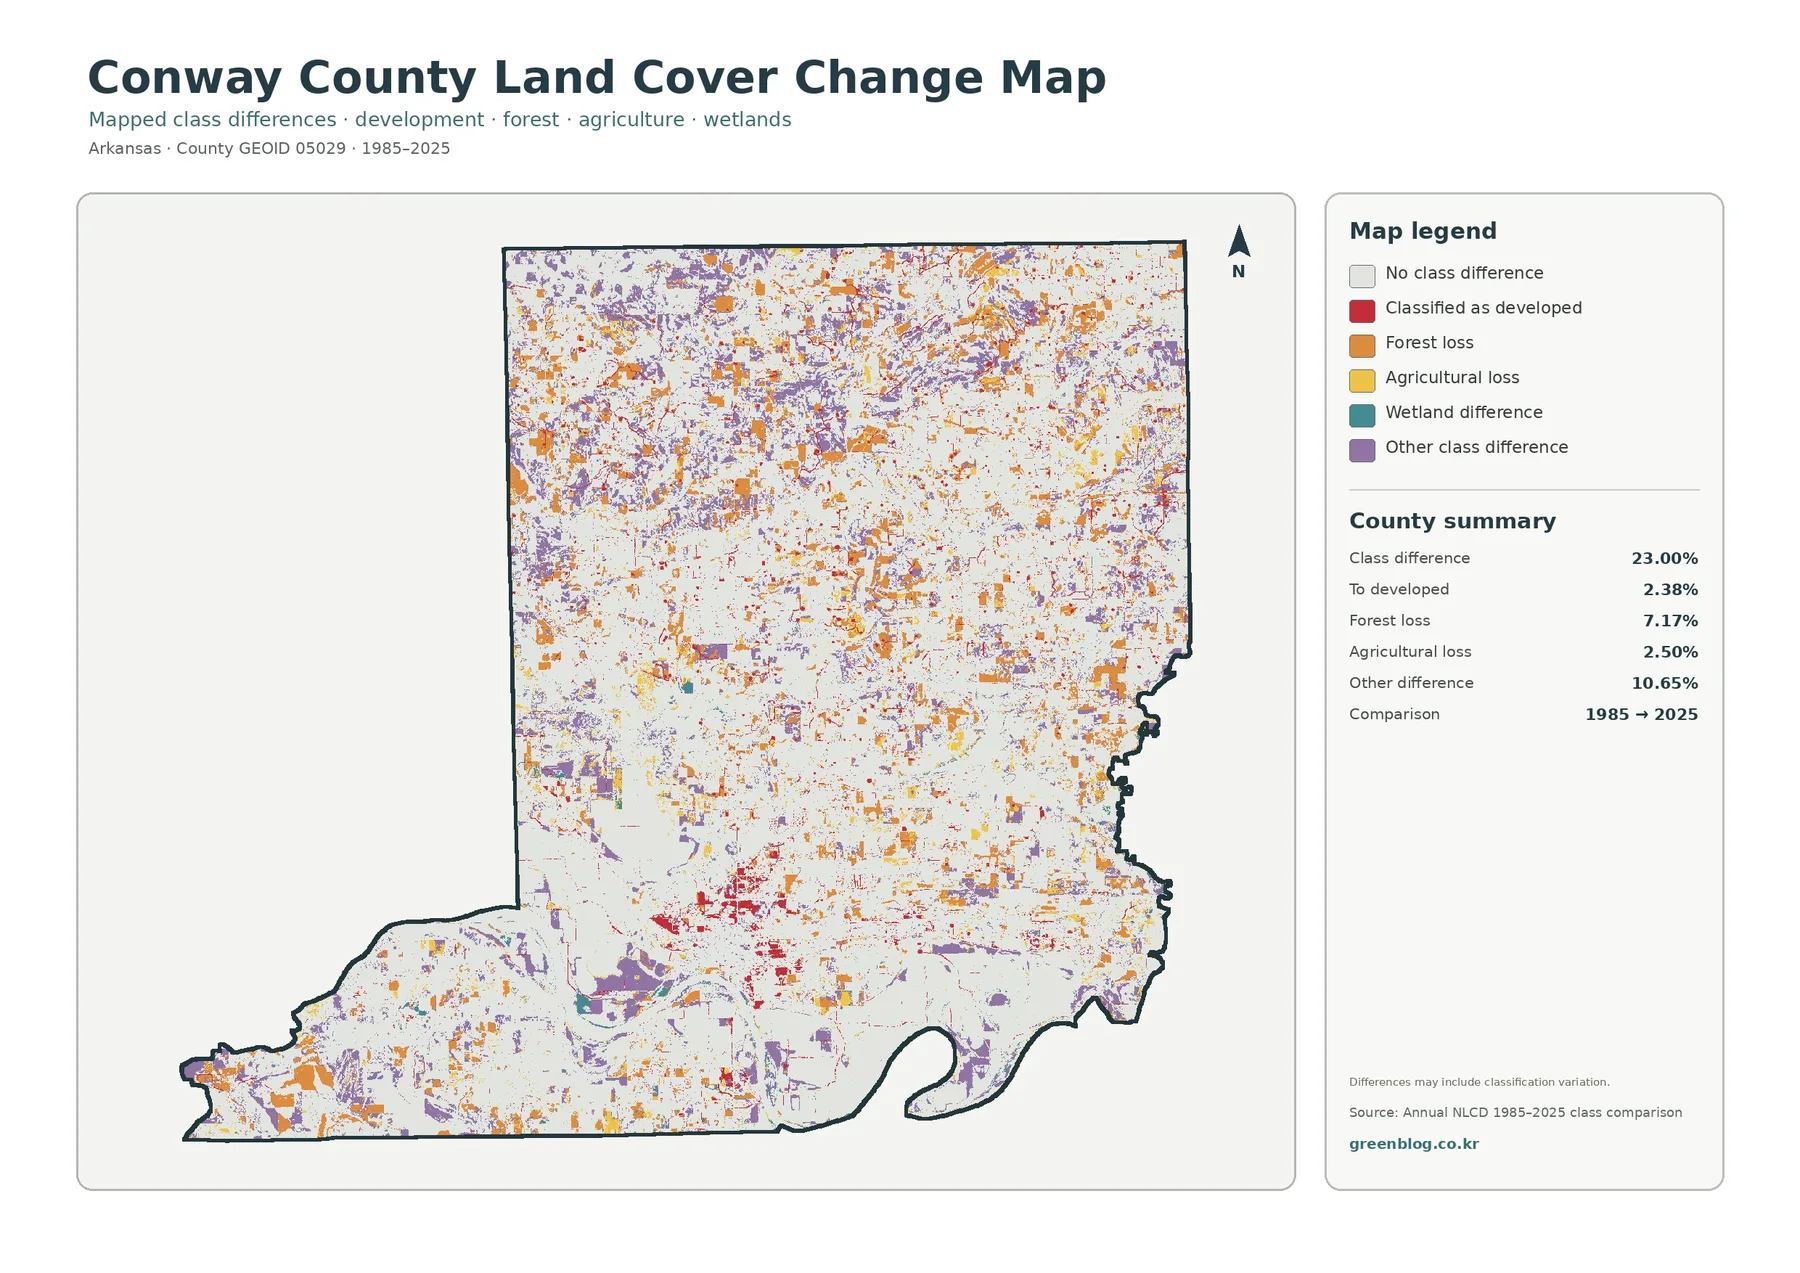
The change map compares the 1985 and 2025 classifications cell by cell. Its summary reports a total class difference of 23.00%. Within that total, 2.38% is categorized as change to developed land, 7.17% as forest loss, 2.50% as agricultural loss, and 10.65% as other class difference. Wetland differences are also mapped. Light cells indicate no class difference between the two comparison years.
Red change-to-developed cells are most noticeable around Morrilton and at smaller built locations. Orange forest-loss cells are much more widely scattered through the northern and central parts of the county. Purple other-difference patches occur throughout the map as well. The distribution is important because it shows that the 23.00% total is not an urban-growth percentage. The specific change-to-developed category is 2.38%, while the rest reflects several other classification changes.
The 7.17% forest-loss category should not be treated as a net forest decline figure either. It marks cells that were forest in one comparison and something else in the other according to the classification. A complete long-term forest balance would also need to consider places classified as newly forested and possible classification variation. The map itself warns that differences may include classification variation, so colored cells are useful evidence of a mapped difference, not proof of a single cause such as clearing or construction.
A better order for reading current cover and change
Start with the 2025 map before interpreting the change view. The current map establishes where forest, agriculture, development, wetlands, and water are located today. Once a place is identified, the change map can be checked for class differences at that same location. This sequence is particularly helpful around Morrilton because the present developed core is easy to identify first, and the red change-to-developed cells can then be examined in relation to it.
The same approach works in the forested north. A broad green area on the current map does not mean every cell remained forest throughout the comparison period. Orange forest-loss cells are scattered through areas that are still strongly forested in 2025. Current condition and historical class difference answer different questions, so keeping them separate produces a more accurate explanation than treating the change map as a second version of the current map.
Local context: Morrilton, the River Valley, and Petit Jean
Conway County’s official website describes the county as sitting in Arkansas’s River Valley and highlights Petit Jean State Park as a major local destination. That geographic context matches the broad map pattern: a river-influenced southern landscape, a concentrated built center around Morrilton, extensive agricultural ground, and a wooded southwestern area associated with Petit Jean. These references help a reader orient the abstract land-cover colors to familiar places.
The University of Arkansas Cooperative Extension maintains its Conway County office in Morrilton and notes that it serves Morrilton, Plumerville, Center Ridge, Menifee, and other communities. This is useful for confirming important settlement names when reading the developed pattern. The land-cover images themselves do not contain municipal boundaries, however, so a specific colored cell should not be assigned to a city or town without a separate boundary layer.
Practical uses for the four-map set
For an introductory geography or environmental lesson, the general map provides the clearest starting point. Students can compare 43.11% forest with 38.24% agriculture and then locate the smaller 7.00% developed, 4.96% wetland, and 2.41% water shares. Asking where each class appears is more informative than reading the percentages alone because the county contains strong north-south and river-corridor contrasts.
The forest-and-farmland view is better when the topic is rural land cover. It separates cropland from pasture or hay and keeps forest prominent, allowing readers to see how open agricultural areas are broken by wooded land and wet features. This can support discussions of habitat context, agricultural landscapes, or how rural cover changes across a county without implying anything about property ownership or farm management.
Use the impervious map when the question concerns built surfaces. Its pale background makes the Morrilton cluster, road-like lines, and smaller developed points much easier to see than on the general map. For a historical comparison, use the change map only after the present-day pattern is established. A report or presentation rarely needs all four maps at the same size; choosing the map that answers the main question usually produces a clearer graphic.
Percentages and colors answer different parts of the question
County percentages are useful for ranking the broad classes. They quickly show that forest and agriculture dominate Conway County, while developed land, wetlands, water, shrubland, and grassland occupy smaller shares. They do not reveal whether a class is concentrated in one place or scattered widely. A class that covers only a few percent can still be important if it follows a river, road network, or compact settlement.
Color patterns have the opposite limitation. Thin roads and small bright patches can attract the eye even though they cover little area. Wetland colors can also appear visually extensive when many small patches are distributed across the county. The summary values provide scale, while the map provides location. Using both together is the most reliable way to describe the county without overestimating either a prominent line or a large but visually broken category.
What the raster classification cannot show at parcel scale
Annual NLCD is designed for consistent land-cover comparison across large areas. It uses raster cells, meaning the landscape is divided into a regular grid and each cell receives a representative classification. A single cell can contain trees, lawn, pavement, and a building at the same time. The assigned category is useful for regional analysis, but it cannot reproduce every fine boundary visible on the ground.
Mixed pixels are especially relevant along narrow streams, forest edges, roads, and low-density developed areas. A small feature may be blended with the surrounding cover, while a complex boundary may appear smoother than it is in a high-resolution aerial image. The maps should therefore be used for county-scale patterns and comparison, not as a parcel survey or a legal boundary reference.
The year also matters. The current maps summarize the supplied 2025 classification, so construction, clearing, farming changes, or restoration after that observation period are not represented. The 1985–2025 view compares two endpoints and does not tell the exact year when a change occurred. A site-specific decision should use newer imagery, field observations, property information, and the appropriate local planning or regulatory records.
Download the four Conway County JPG maps
The download package contains the original JPG versions of the general land-cover map, forest and farmland map, impervious and developed-land map, and 1985–2025 land-cover change map. Each image is 2480 × 1754 pixels at the supplied original size. Keeping the four maps as separate files makes it easy to choose a current-cover, rural-cover, built-surface, or historical-comparison view for a report or presentation.
Frequently Asked Questions
What are the largest 2025 land-cover classes in Conway County?
Forest is the largest at 43.11%, followed closely by agriculture at 38.24%. Developed cover is 7.00%, wetlands 4.96%, and water 2.41%. Because forest and agriculture are both large, the county is better described as a mixed forest-and-agriculture landscape than as a county dominated by only one of those classes.
Why is developed cover 7.00% while mean impervious surface is 1.71%?
Developed land includes areas where buildings and roads are mixed with lawns, trees, soil, and other surfaces that still absorb water. Impervious surface focuses on pavement, rooftops, and similar sealed surfaces. The two measures are related, but they describe different aspects of the built landscape.
Does the 23.00% class difference mean 23% of Conway County became developed?
No. The 23.00% figure is the total share of cells with a different mapped class between 1985 and 2025. Change to developed land is a separate 2.38% category. Forest loss, agricultural loss, wetland differences, other class differences, and possible classification variation are also part of the overall comparison.
Map File Information
The ZIP contains the four original Conway County land-cover JPG maps discussed on this page.
- File Type: Four JPG images in one ZIP archive
Related Maps
- Arkansas County Arkansas Land Cover Map
- Ashley County Arkansas Land Cover Map
- Baxter County Arkansas Land Cover Map
Sources and data notes
- MRLC Annual NLCD Data – access point for the Annual NLCD datasets used for year-based land-cover analysis.
- USGS Annual NLCD Land Cover Classification – definitions for forest, agriculture, developed, wetland, water, and other classes.
- U.S. Census Bureau TIGER/Line Shapefiles – official geographic boundary resources for county identification.
- University of Arkansas Cooperative Extension – Conway County – county-specific agriculture, natural-resources, and community information based in Morrilton.
- Arkansas State Parks – Petit Jean State Park – official reference for the wooded Petit Jean area in southwestern Conway County.
Green Map creates custom-edited map images using open geographic data sources such as geoBoundaries, Natural Earth, OpenStreetMap, and government open data.
These maps are edited visual materials, not raw data files, and are provided for education, documents, presentations, and graphic reference.