Marengo County makes more sense on a map once you separate its two main centers. Linden is the county seat near the middle of the county, while Demopolis is the larger river city in the northwest where U.S. 80, U.S. 43, the Black Warrior River, and the Tombigbee River come together. This page connects those two anchors with the smaller communities, waterways, and changes in elevation that shape the rest of the county. The map set is also available to download as a ZIP containing four high-resolution A3 JPG files.
The county is large and lightly populated, so the empty-looking spaces between towns matter. Sweet Water and Nanafalia help orient the southwest; Thomaston and Providence mark the eastern side; Faunsdale sits along the U.S. 80 approach from the east. Looking at those places together with the river system and terrain gives a more useful picture than treating Marengo County as a single town surrounded by blank rural land.
Each map on this page has a different job. The county map combines roads, place labels, and boundaries; the city map isolates six major communities; the water map shows named streams, lakes, and the Tombigbee River; and the elevation map compares low river country with higher interior ridges. The water and elevation views are general reference maps, not flood, navigation, parcel, or survey products.
Table of Contents
Begin with Demopolis and Linden
| State | Alabama |
|---|---|
| County seat | Linden |
| Largest city | Demopolis |
| July 1, 2025 population estimate | 18,311 |
| 2020 census population | 19,323 |
| Land area | 976.90 sq mi |
| Main routes | U.S. 43, U.S. 80, AL 28, AL 69 |
| Major waters | Tombigbee River, Black Warrior River, Demopolis Lake |
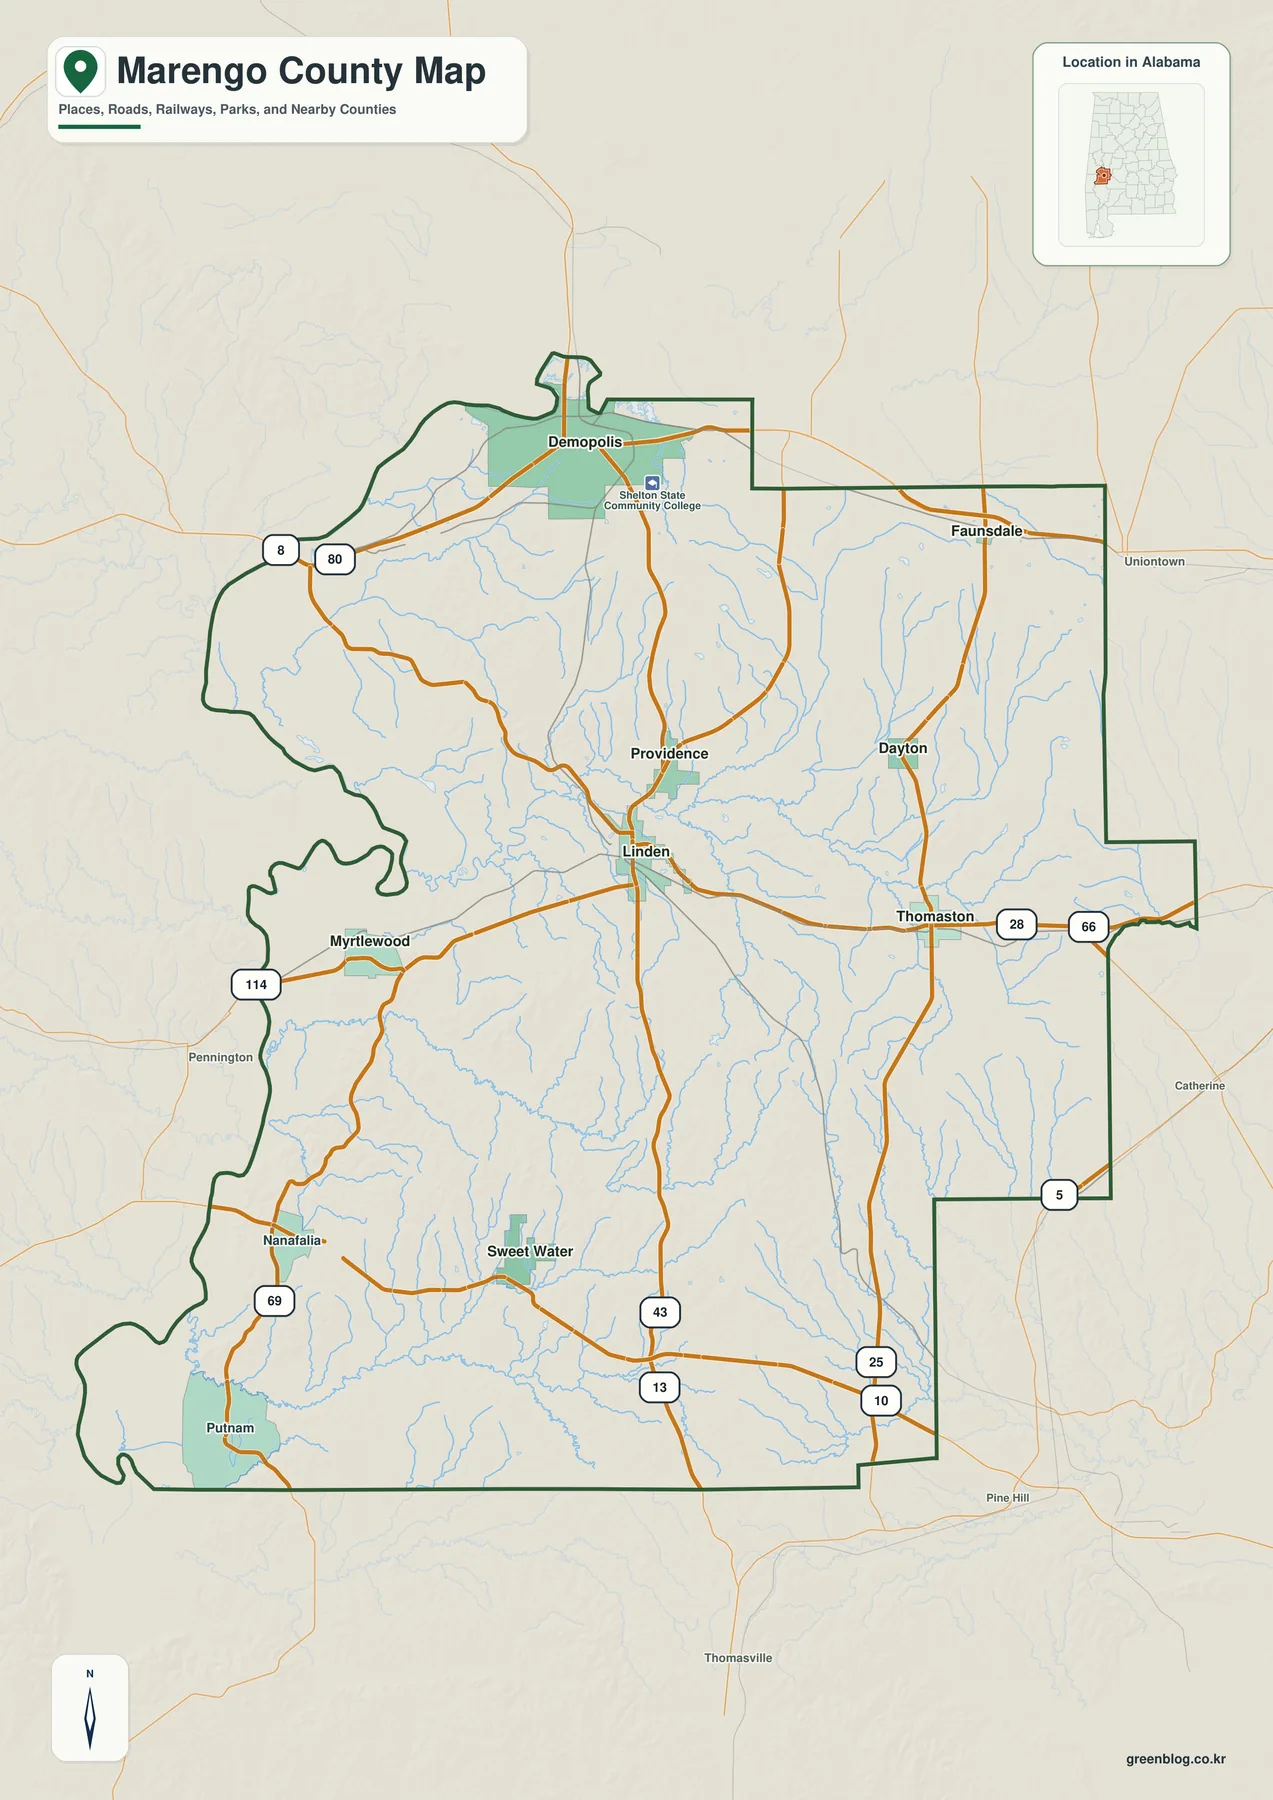
On the county map, Demopolis lies close to the northwestern edge while Linden sits farther southeast in the broad interior. U.S. 43 is the clearest north-south connection between them and continues toward the southern part of the county. U.S. 80 crosses Demopolis from west to east, then passes Faunsdale on the way toward Selma. That road pattern helps explain why Demopolis serves a wider regional market even though the county government is based in Linden.
Several smaller places fill in the areas between those two centers. Providence is north of Linden, Dayton is to the northeast, and Thomaston is farther east near Alabama 28 and 66 on the map. Myrtlewood lies west of Linden, while Nanafalia, Sweet Water, and Putnam spread across the southwest. Their importance on a reference map is not population size; they give names to long stretches of rural territory that would otherwise be difficult to describe.
The Census Bureau lists 976.90 square miles of land for Marengo County and a 2020 population density of only 19.8 people per square mile. Its July 1, 2025 population estimate is 18,311, compared with 19,323 counted in the 2020 census. Those numbers fit what the map suggests visually: most residents are not packed into a continuous urban corridor, and road choice, river crossings, and distance to the nearest service center can matter more than the number of nearby named places.
Six communities show how spread out the county is
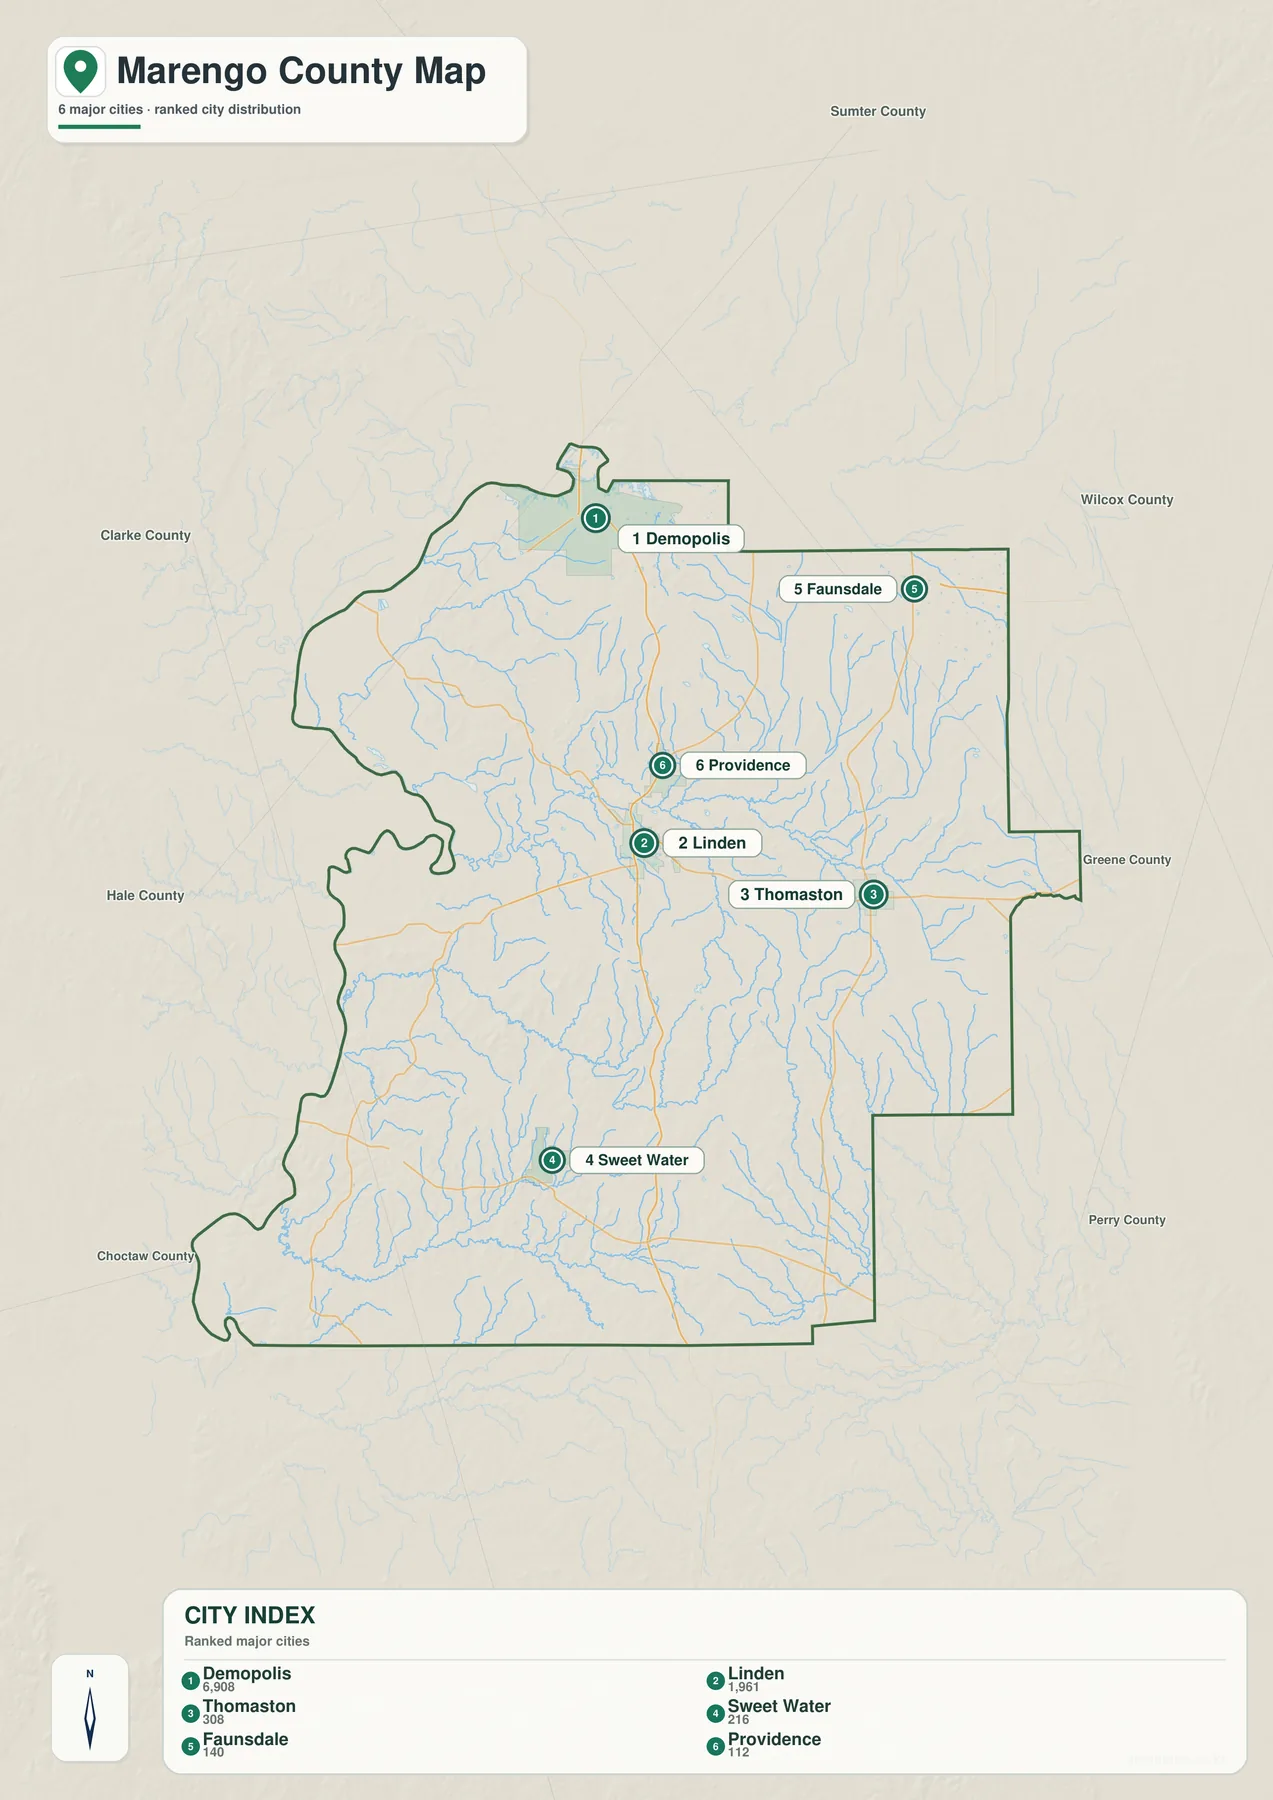
The city map highlights Demopolis, Linden, Thomaston, Sweet Water, Faunsdale, and Providence. Demopolis ranks first in the supplied city index at 6,908 residents, followed by Linden at 1,961. The remaining communities are much smaller: Thomaston 308, Sweet Water 216, Faunsdale 140, and Providence 112. The ranking is useful for scale, but the more important feature is where the places sit relative to one another. The numbered markers do not represent road mileage or travel time.
Demopolis and Linden form the strongest pair of reference points. Demopolis combines the largest population, the two major U.S. highways, and the river confluence. Linden has the courthouse and county-government role and sits near the middle of the road network. A resident can therefore travel toward one city for government functions and toward the other for a broader range of shopping, health care, employment, or river-related activity.
The other communities explain why Marengo County cannot be reduced to that two-city relationship. Sweet Water is far to the southwest, closer in orientation to Nanafalia and the Clarke–Choctaw side of the county. Thomaston provides an eastern reference point, and Providence fills part of the interior north of Linden. Faunsdale marks the U.S. 80 corridor northeast of Demopolis. Taken together, the six markers turn the county from a large outline into several recognizable local areas.
Water defines the northwest and threads through the interior
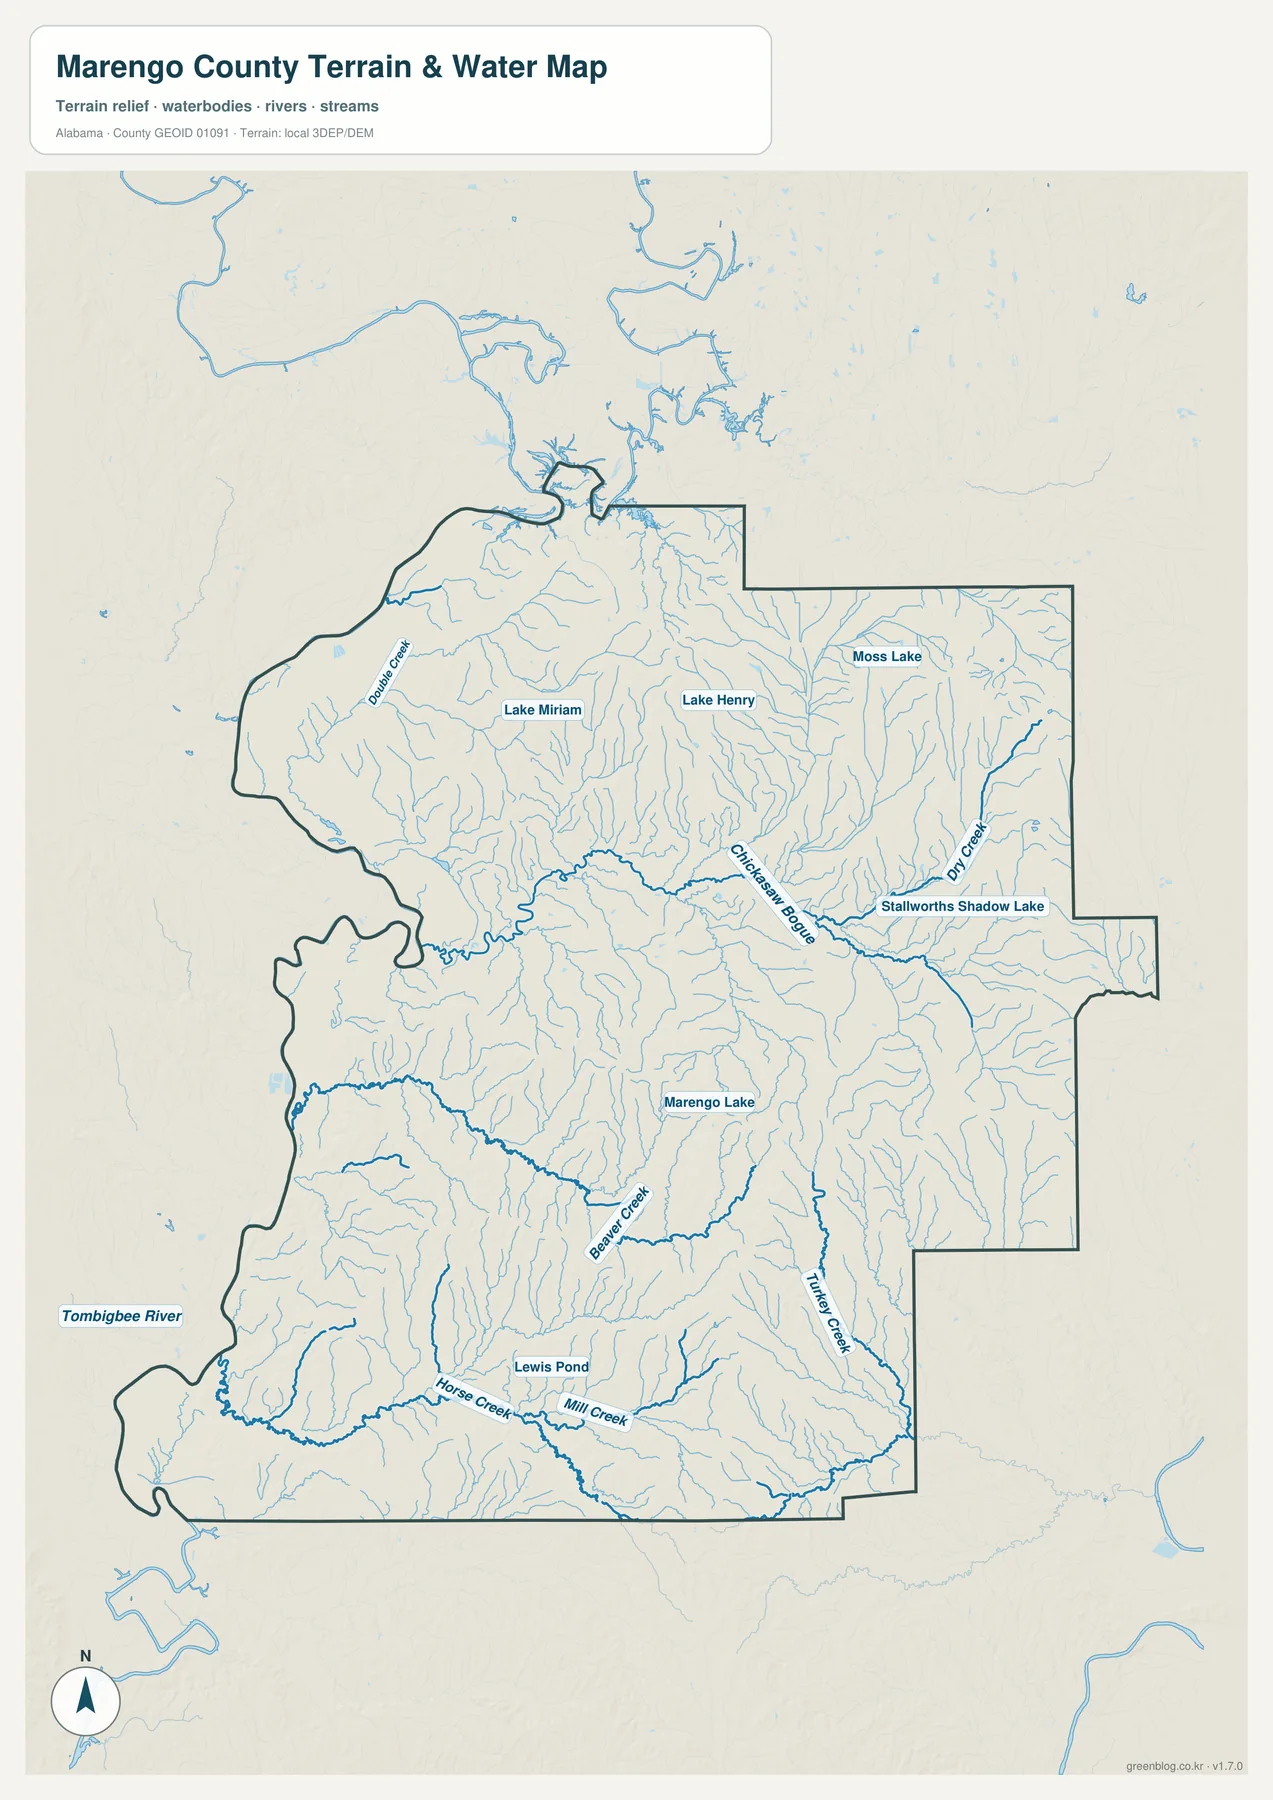
The Tombigbee River is the strongest water feature on the map, especially along the western and northwestern side. Near Demopolis, the Black Warrior River joins the Tombigbee, creating one of the county’s most distinctive geographic settings. The U.S. Army Corps of Engineers describes Demopolis Lake as the largest lake in the Black Warrior–Tombigbee system, with roughly 10,000 acres of water extending many miles upstream on both rivers.
Away from the main river, the map becomes a web of smaller channels. Double Creek appears in the northwest. Chickasaw Bogue cuts across the central part of the county, while Beaver Creek and Turkey Creek are prominent farther south. Horse Creek and Mill Creek appear near the southern edge. Named water bodies include Lake Miriam, Lake Henry, Moss Lake, Marengo Lake, Lewis Pond, and Stallworths Shadow Lake. These features show why a simple county-boundary map cannot fully describe the landscape.
The river system also helps explain the difference between Demopolis and the inland towns. Navigation structures, waterfront industry, recreation, and bridge crossings are concentrated around the northwestern river zone. Linden, Thomaston, and Sweet Water sit in a landscape of smaller streams and rural roads instead. A trip across the county therefore moves not only between towns but also between very different water settings.
Use this map for orientation, not regulation or hazard decisions. It does not show parcel boundaries, legal access, flood zones, guaranteed boat routes, or current recreation rules. Those questions require current agency maps and local information. Here, the value is seeing how the large river, interior creeks, and low valleys fit inside the same county outline.
Elevation separates river lowlands from interior ridges
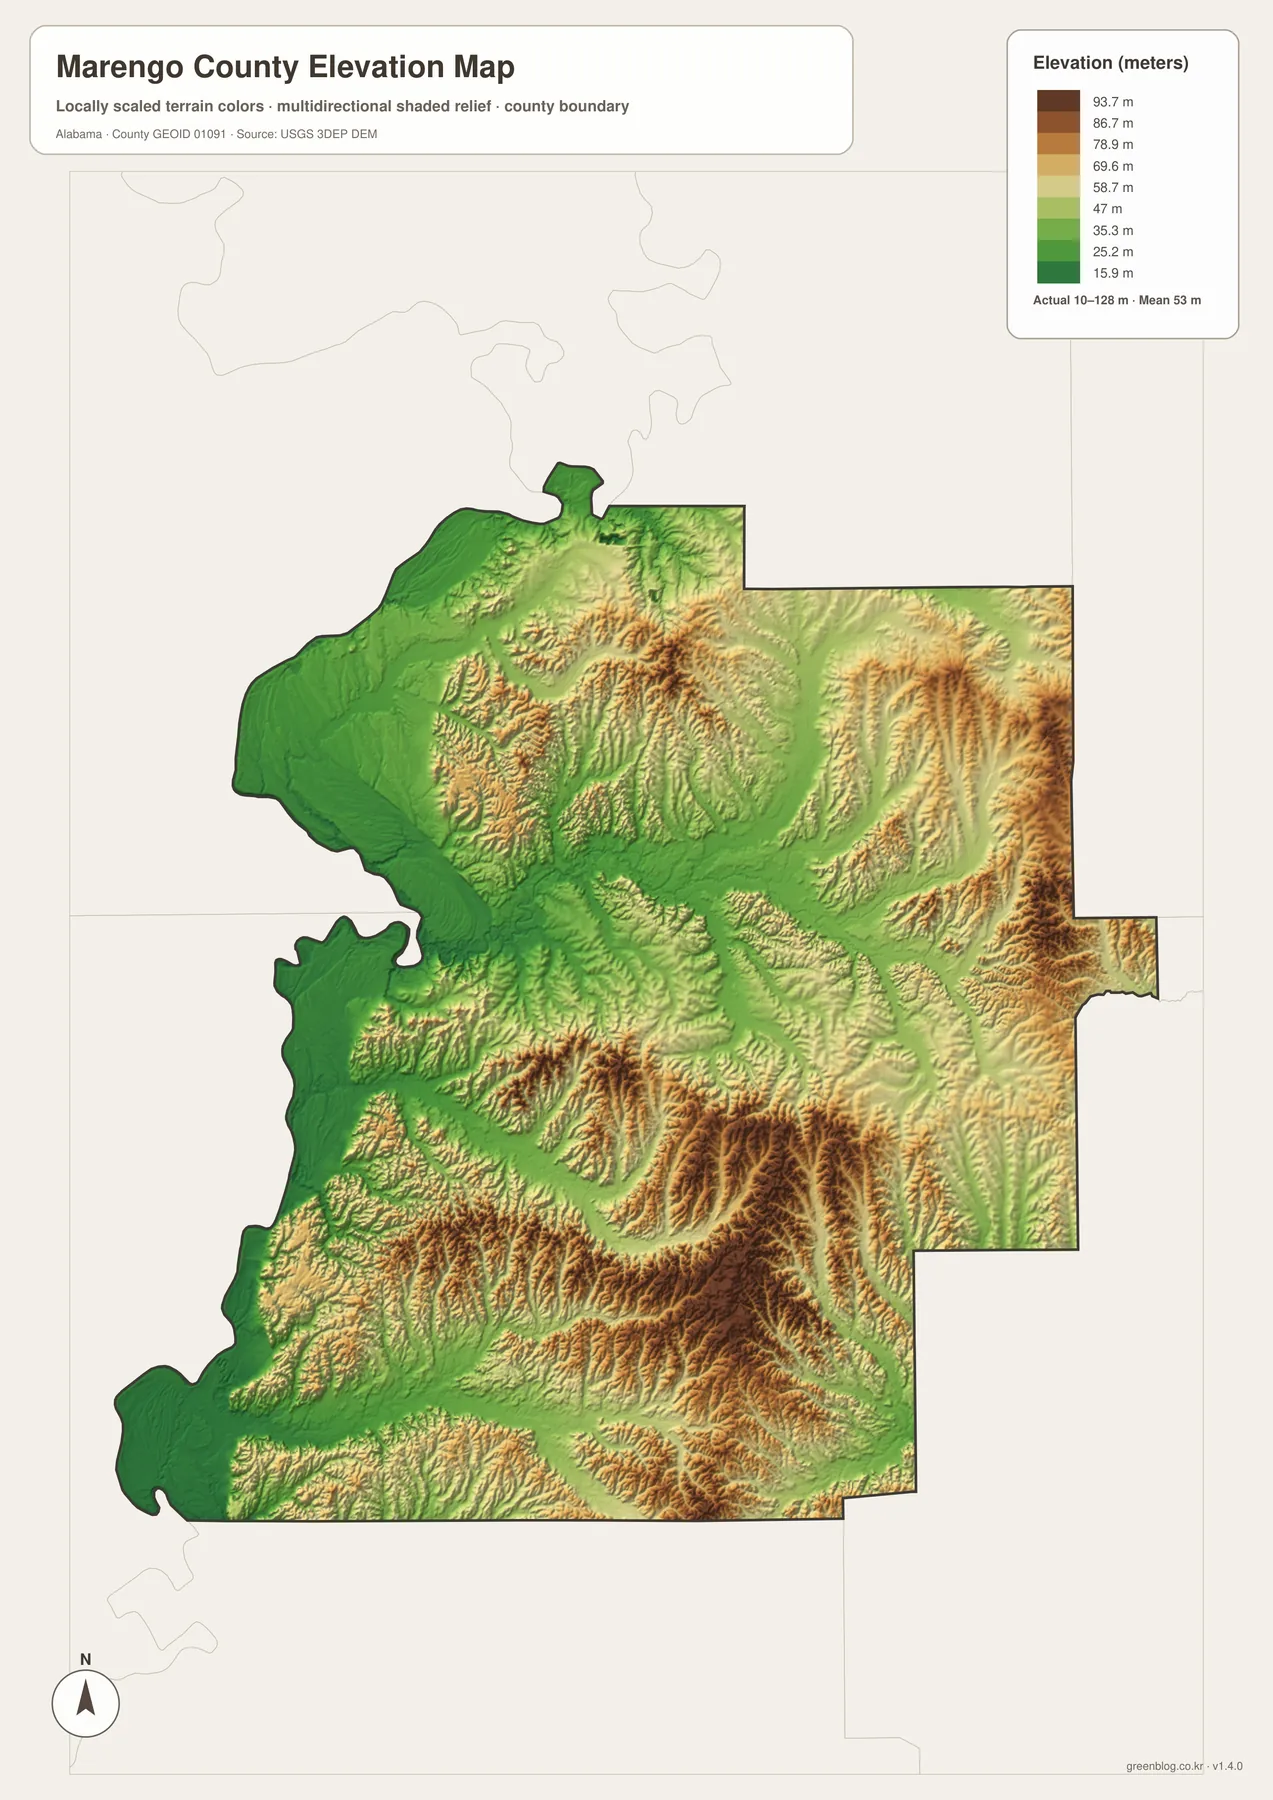
The elevation legend gives an actual range of about 10 to 128 meters and a mean near 53 meters. Much of the west and northwest is shown in green, indicating lower terrain around the Tombigbee side of the county. Brown and tan ridges become more common through the south-central interior and toward the east. Marengo County is not mountainous, but the shaded relief makes its rolling terrain much more obvious than the road map alone does.
Comparing this view with the water map is especially useful. Many streams occupy the lower corridors between ridges, and the broadest low country lies toward the major river system. The higher interior does not form one continuous ridge; instead, it appears as repeated narrow uplands separated by creek valleys. That pattern helps explain why local roads bend and why small communities can feel separated even when they are not extremely far apart in straight-line distance.
This elevation surface is meant for county-wide comparison. It should not be treated as a survey, engineering drawing, building-site measurement, or flood-elevation certificate. Anyone who needs exact ground heights should use the underlying USGS elevation data and appropriate field or engineering measurements.
Roads and local history explain the modern map
U.S. 43 provides the simplest north-south framework. It links Demopolis with Linden and continues toward Clarke County, tying the river city to the county seat and southern communities. U.S. 80 is the major east-west route through Demopolis and Faunsdale toward Selma, with westbound connections toward Sumter County and Mississippi. Alabama 28 and Alabama 69 add important links through the interior. Because no Interstate crosses Marengo County, these U.S. and state highways remain the main long-distance routes.
The settlement pattern also has a strong historical layer. Marengo County was created in 1818, and its name refers to Napoleon Bonaparte’s victory at the Battle of Marengo. Demopolis grew from the Vine and Olive Colony established by French exiles near White Bluffs in 1817. Linden became the county seat in 1819, and its name is associated with Hohenlinden, another Napoleonic-era battlefield remembered by the French settlers. The two principal cities therefore share a related naming history even though they developed different modern functions.
Railroads shaped smaller towns as well. Thomaston expanded after rail service arrived in 1901, and Sweet Water grew as rail connections supported timber, cotton, and local commerce in the early twentieth century. Their locations on today’s map make more sense when they are seen as rural service centers that developed away from the Demopolis river hub.
Marengo County also sits within the Black Belt and Canebrake, a landscape long associated with fertile soils, agriculture, forests, and wildlife. Chickasaw State Park near Gallion along U.S. 43 covers 520 acres and is included on the Black Belt Birding Trail. It gives the eastern side of the county a useful real-world reference point beyond towns and highways.
- For county government: start with Linden and U.S. 43.
- For the northwest river area: pair Demopolis with the Black Warrior–Tombigbee confluence.
- For the southwest: use Sweet Water, Nanafalia, and Putnam as orientation points.
- For the east: compare Thomaston and Providence with the eastern county boundary.
- For terrain: read the water and elevation maps together to connect creek valleys with surrounding ridges.
Frequently Asked Questions
Why is Linden the county seat when Demopolis is the larger city?
Linden is the administrative center, with the county-government and courthouse role. Demopolis is the larger population and service center because it developed at the Black Warrior–Tombigbee confluence and the junction of U.S. 80 and U.S. 43. Government and commercial importance are therefore divided between two cities.
What is the difference between the four downloadable maps?
The county map combines roads, boundaries, and many place labels. The city map isolates six major communities for quick orientation. The water map gives more detail on the Tombigbee River, creeks, and named lakes, while the elevation map emphasizes lower river country and higher interior ridges.
Can the water or elevation map be used for flood or engineering decisions?
No. Both are general reference maps. Flood risk, navigation rules, parcel questions, and exact elevations require current official data and, when necessary, professional surveying or engineering information.
Map File Information
Download the Marengo County map files
- Included Files: General county, city, water, and elevation maps
- File Type: Four high-resolution A3 JPG files bundled in one ZIP archive
- Intended Use: Printing, education, presentations, and map-based projects
Related Maps
- Abbeville, Headland, and Lake Eufaula on the Henry County Alabama Map
- Athens to Wheeler Reservoir on the Limestone County Alabama Map
- Autauga County Map
Sources and Reference Data
- U.S. Census Bureau QuickFacts – population, area, and demographic reference
- Marengo County official community page – county community information
- City of Demopolis visitor and history information – local historical context
- ALDOT Highway Functional Classification Maps – road and functional-class reference
- U.S. Army Corps of Engineers Black Warrior–Tombigbee Lakes – Demopolis Lake and navigation system
- USGS 3D Elevation Program – elevation reference data
Green Map creates custom-edited map images using open geographic data sources such as geoBoundaries, Natural Earth, OpenStreetMap, and government open data. These maps are edited visual materials, not raw data files, and are provided for education, documents, presentations, and graphic reference.