Forest is the defining land-cover pattern in Warren County in 2025. It accounts for 77.51% of the county, while large water bodies and scattered wetlands break up the green cover, especially toward the eastern side. Developed land occupies a much smaller share and is concentrated most strongly in the southeast, with thinner developed traces following several interior corridors and settlement areas.
This page compares four views of the same county: general land cover, forest and farmland, impervious surface, and mapped class differences between 1985 and 2025. The WebP images are provided for quick viewing, and the four original JPG maps are available together in one ZIP download. These are land-cover maps, not parcel, ownership, zoning, or development-right maps.
Table of Contents
A forest-dominated county with water woven through the landscape
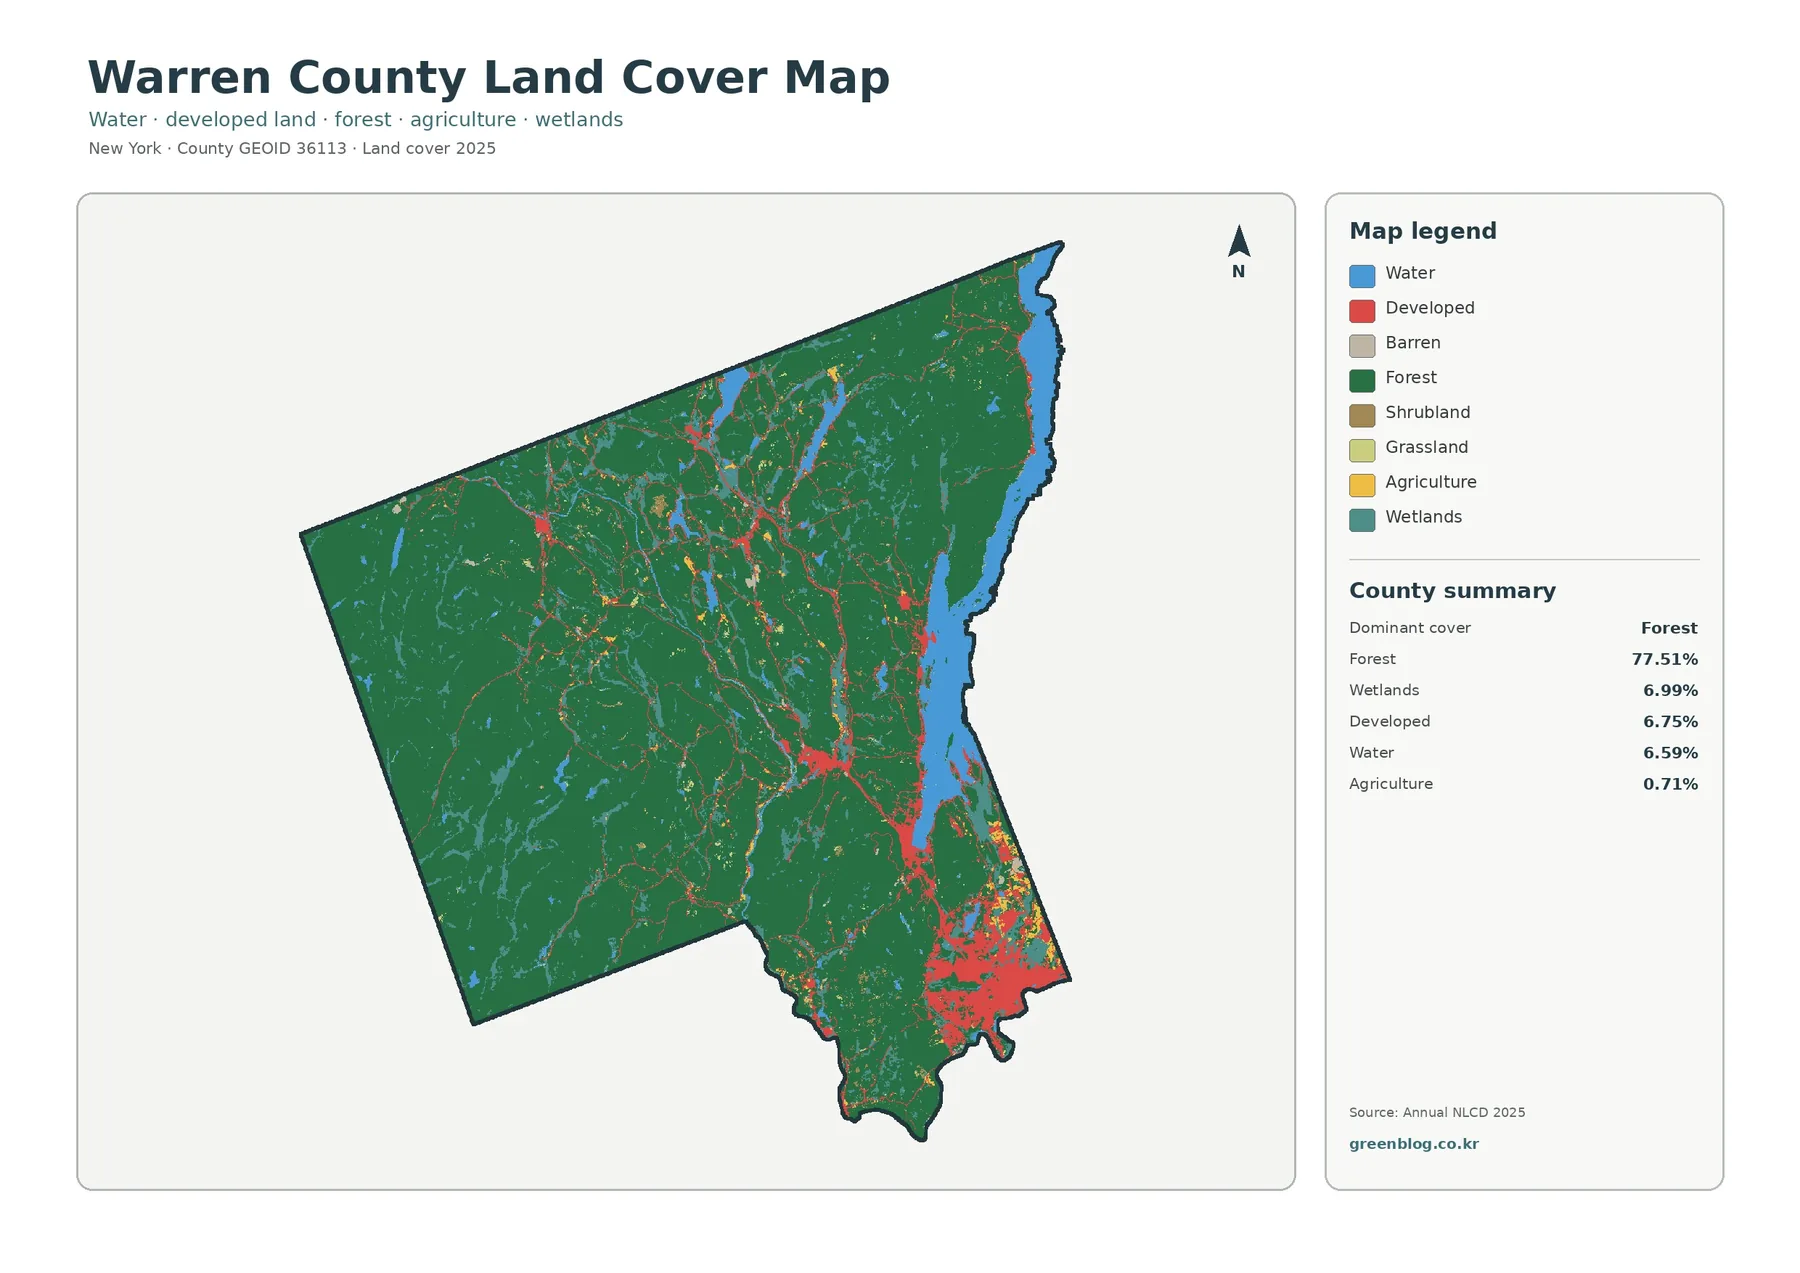
The broadest feature is the continuous dark-green forest across the western, northern, and central portions of the county. At 77.51%, forest has far more area than any other major class. That strong forest presence fits the county’s location in the southern Adirondacks, which the State of New York identifies as a central part of Warren County’s regional setting. Even so, the map is not uniformly green; lakes, wet areas, settlements, and narrow developed corridors create clear breaks.
Water covers 6.59% of the mapped area, and wetlands account for 6.99%. Those numbers are close, but the two classes appear differently. Blue water includes large, recognizable lake shapes as well as smaller lakes and water bodies. Wetlands are more fragmented and often appear beside water or within the forested landscape. The county’s long eastern lake is especially useful as a visual reference when moving from one map to another.
Developed cover makes up 6.75% of the county. Its largest cluster sits in the southeast, where the red developed class becomes much denser than it is elsewhere. Smaller developed patches and narrow lines continue northward and into the interior. The New York State county overview identifies the City of Glens Falls as a cultural center and highlights the Lake George area, providing useful geographic context for the concentration seen in the southern and southeastern part of the map.
Agriculture is only 0.71% of the 2025 summary. Small yellow areas appear mainly near the more open and developed parts of the county rather than forming large agricultural blocks. This makes Warren County visually different from New York counties where cropland or pasture occupies a major share. The percentage is small, but keeping agriculture as a separate class matters because those open areas can be easy to confuse with grassland or other nonforest surfaces at a quick glance.
Lake George is the clearest landmark for comparing the four maps
Lake George forms a long north-south water feature along the eastern side of Warren County and provides an easy anchor for reading the map. Warren County’s official water-resources page lists the lake at 28,170 acres and places it in the Lake George watershed within the broader Lake Champlain system. The land-cover map does not show lake depth or watershed boundaries, but the water shape makes it easy to locate surrounding forest, wetlands, and developed areas.
Other blue water bodies appear farther west and north, and the county planning material describes a landscape with more than 25 lakes, many streams and ponds, and more than 50 miles of the Hudson River. Those details help explain why water remains visually important even though forest dominates the county total. For map reading, water also works as a stable reference feature: a lake keeps the same position while the surrounding colors change from one thematic map to another.
Impervious surface sharpens the contrast between the southeast and the forest interior
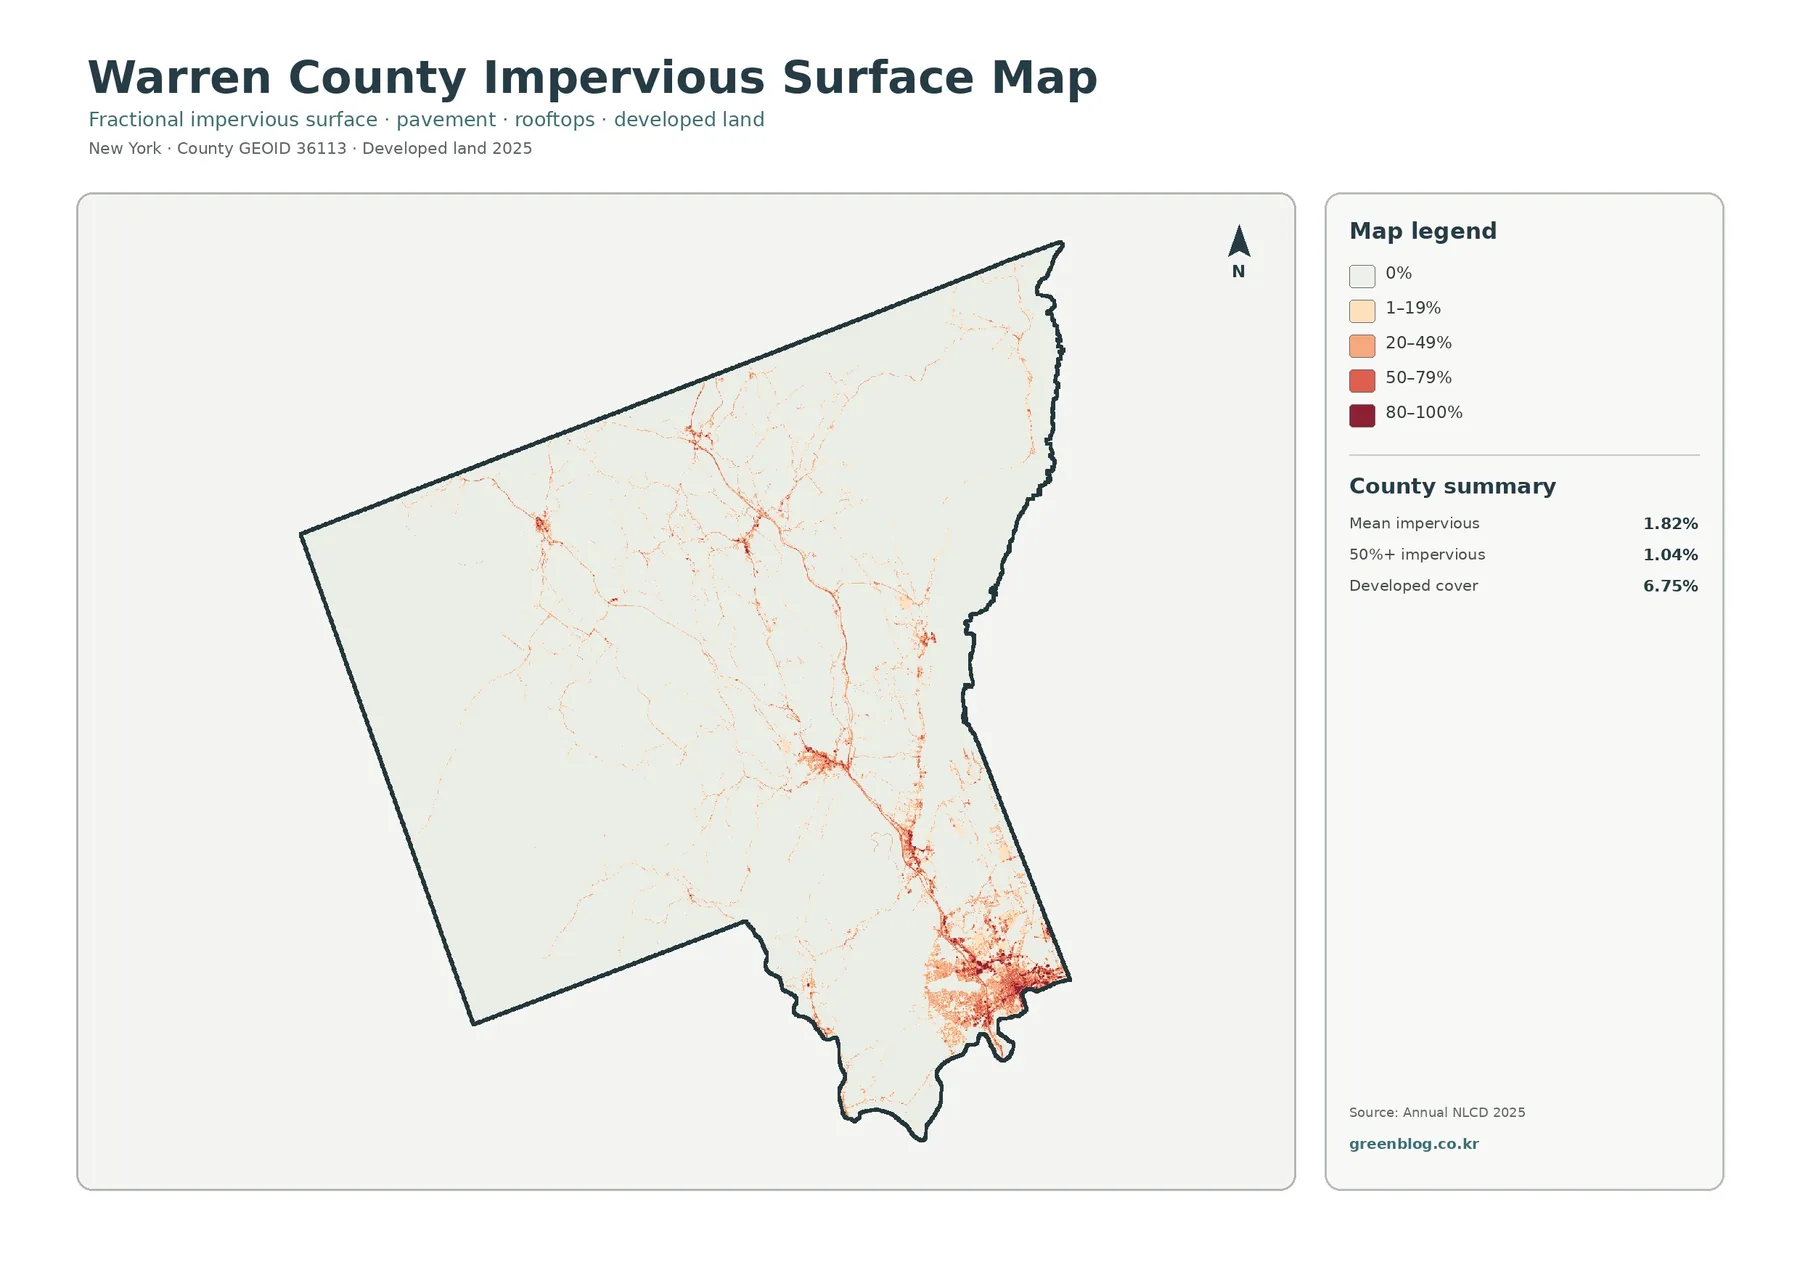
Impervious surface means pavement, rooftops, parking areas, and similar surfaces that do not readily absorb water. Warren County’s mean impervious value is 1.82%, so most of the county appears in the lightest classes. The southeast is the major exception. Orange and red cells become much more numerous there, and several narrow higher-value lines extend away from that concentration into otherwise lightly colored areas.
Only 1.04% of the county is mapped at 50% or more impervious surface. That figure is substantially lower than the 6.75% developed-cover share because developed land and impervious surface measure different things. A developed land-cover cell can still include lawns, trees, soil, and other permeable surfaces. The impervious layer narrows the question to how much of each cell is covered by hard surfaces.
Across the western and northern forest areas, high impervious values are sparse. Small points and thin lines appear, but they do not form the broad concentrations seen near the southeast. This difference is useful for watershed or environmental teaching because it separates a general developed-land category from the locations where pavement and roofs are especially concentrated. It should not, however, be treated as a road or building footprint map.
A simplified forest-and-farmland view makes the open areas easier to find
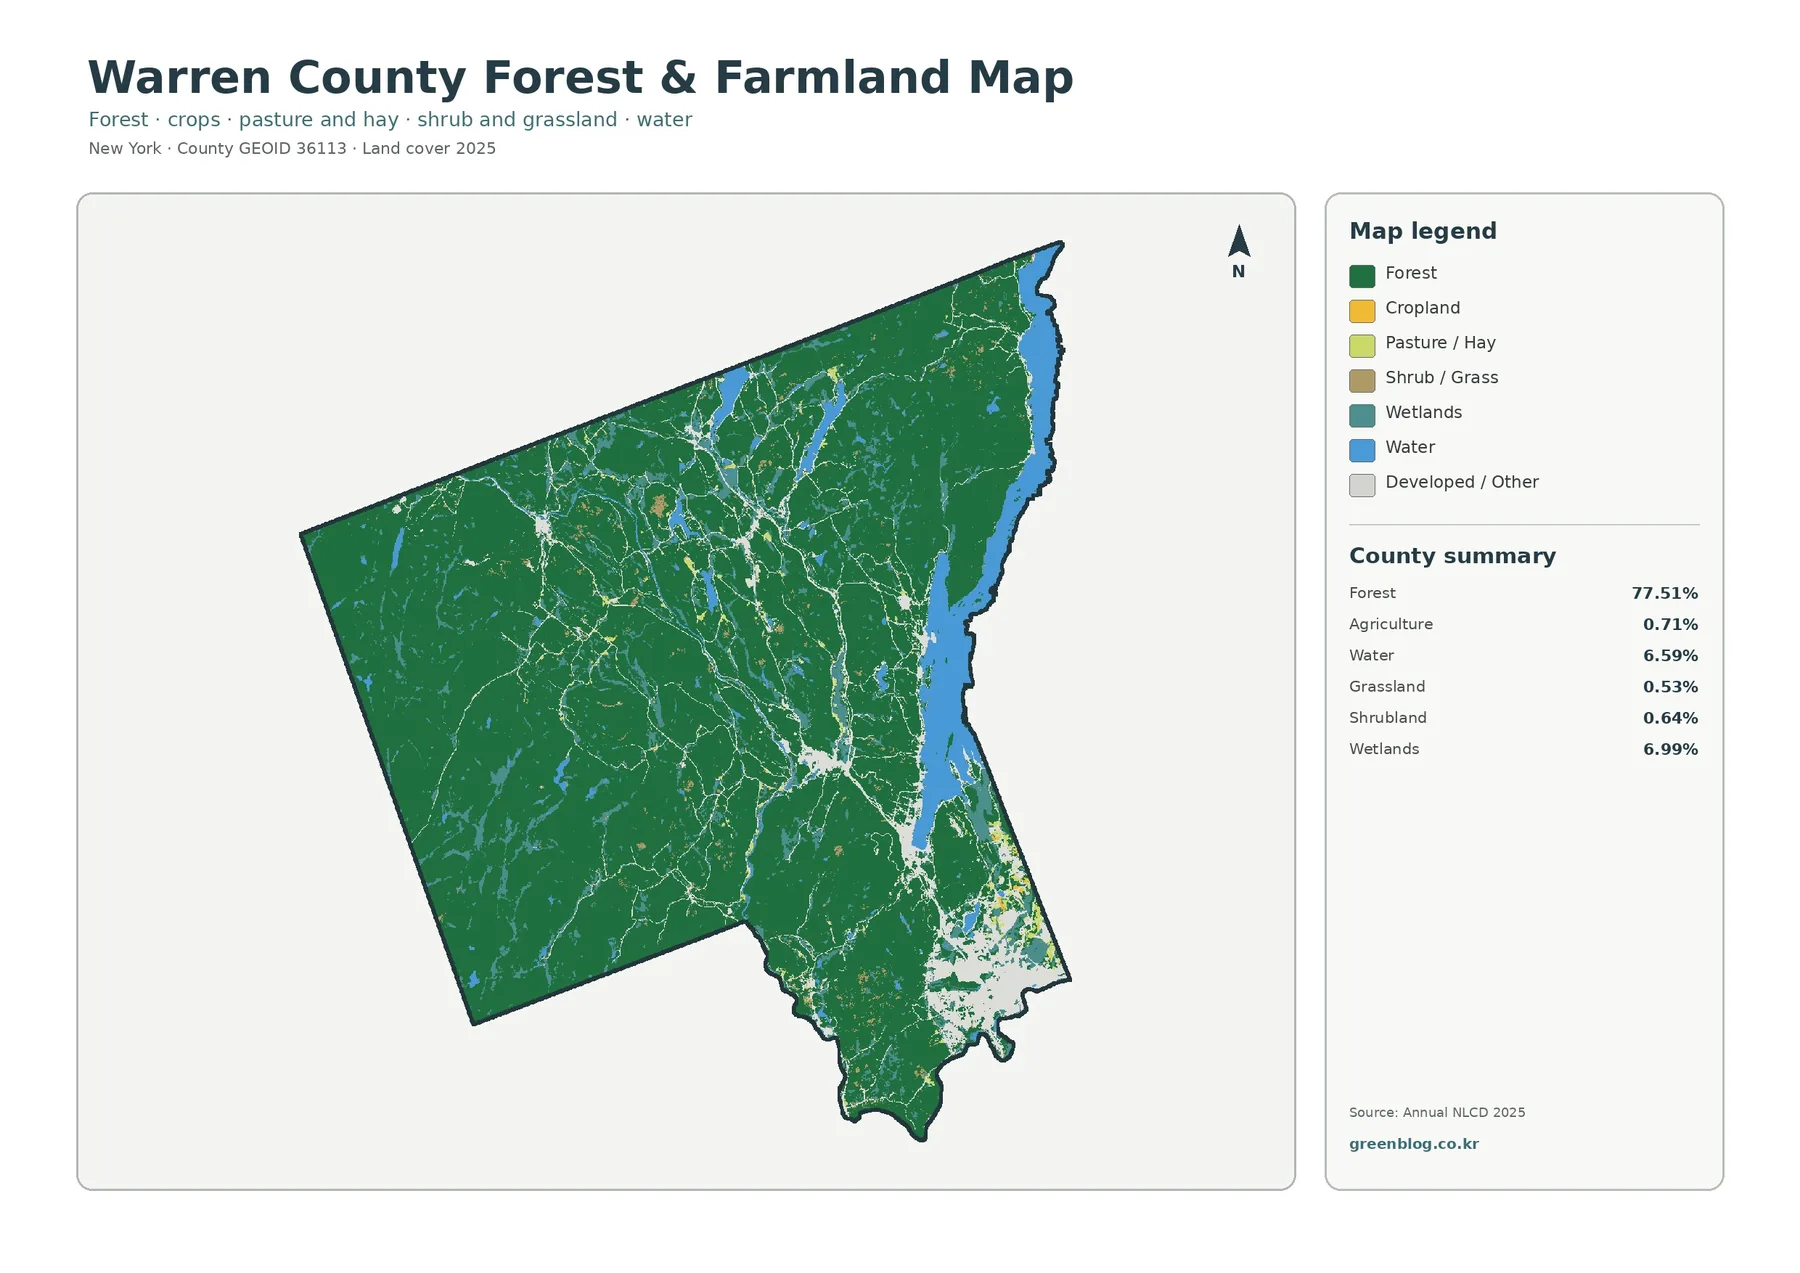
Removing much of the developed detail makes the county’s forest dominance even clearer. Forest remains 77.51%, while agriculture is 0.71%, grassland 0.53%, and shrubland 0.64%. Those open-land classes are small at the county scale and appear as scattered patches rather than extensive belts. The strongest contrast is therefore not forest versus farmland, but broad forest versus a mixture of small openings, water, wetlands, and developed areas.
The western side is particularly useful for seeing how uninterrupted the forest can be at this map scale. In the south and southeast, the pattern becomes more broken because light developed/other areas, water, and small agricultural or grassland patches occupy more space. This version works well in presentations where the goal is to explain forest continuity without the stronger red tones of the general land-cover map competing for attention.
The 1985–2025 comparison shows limited but widespread class differences
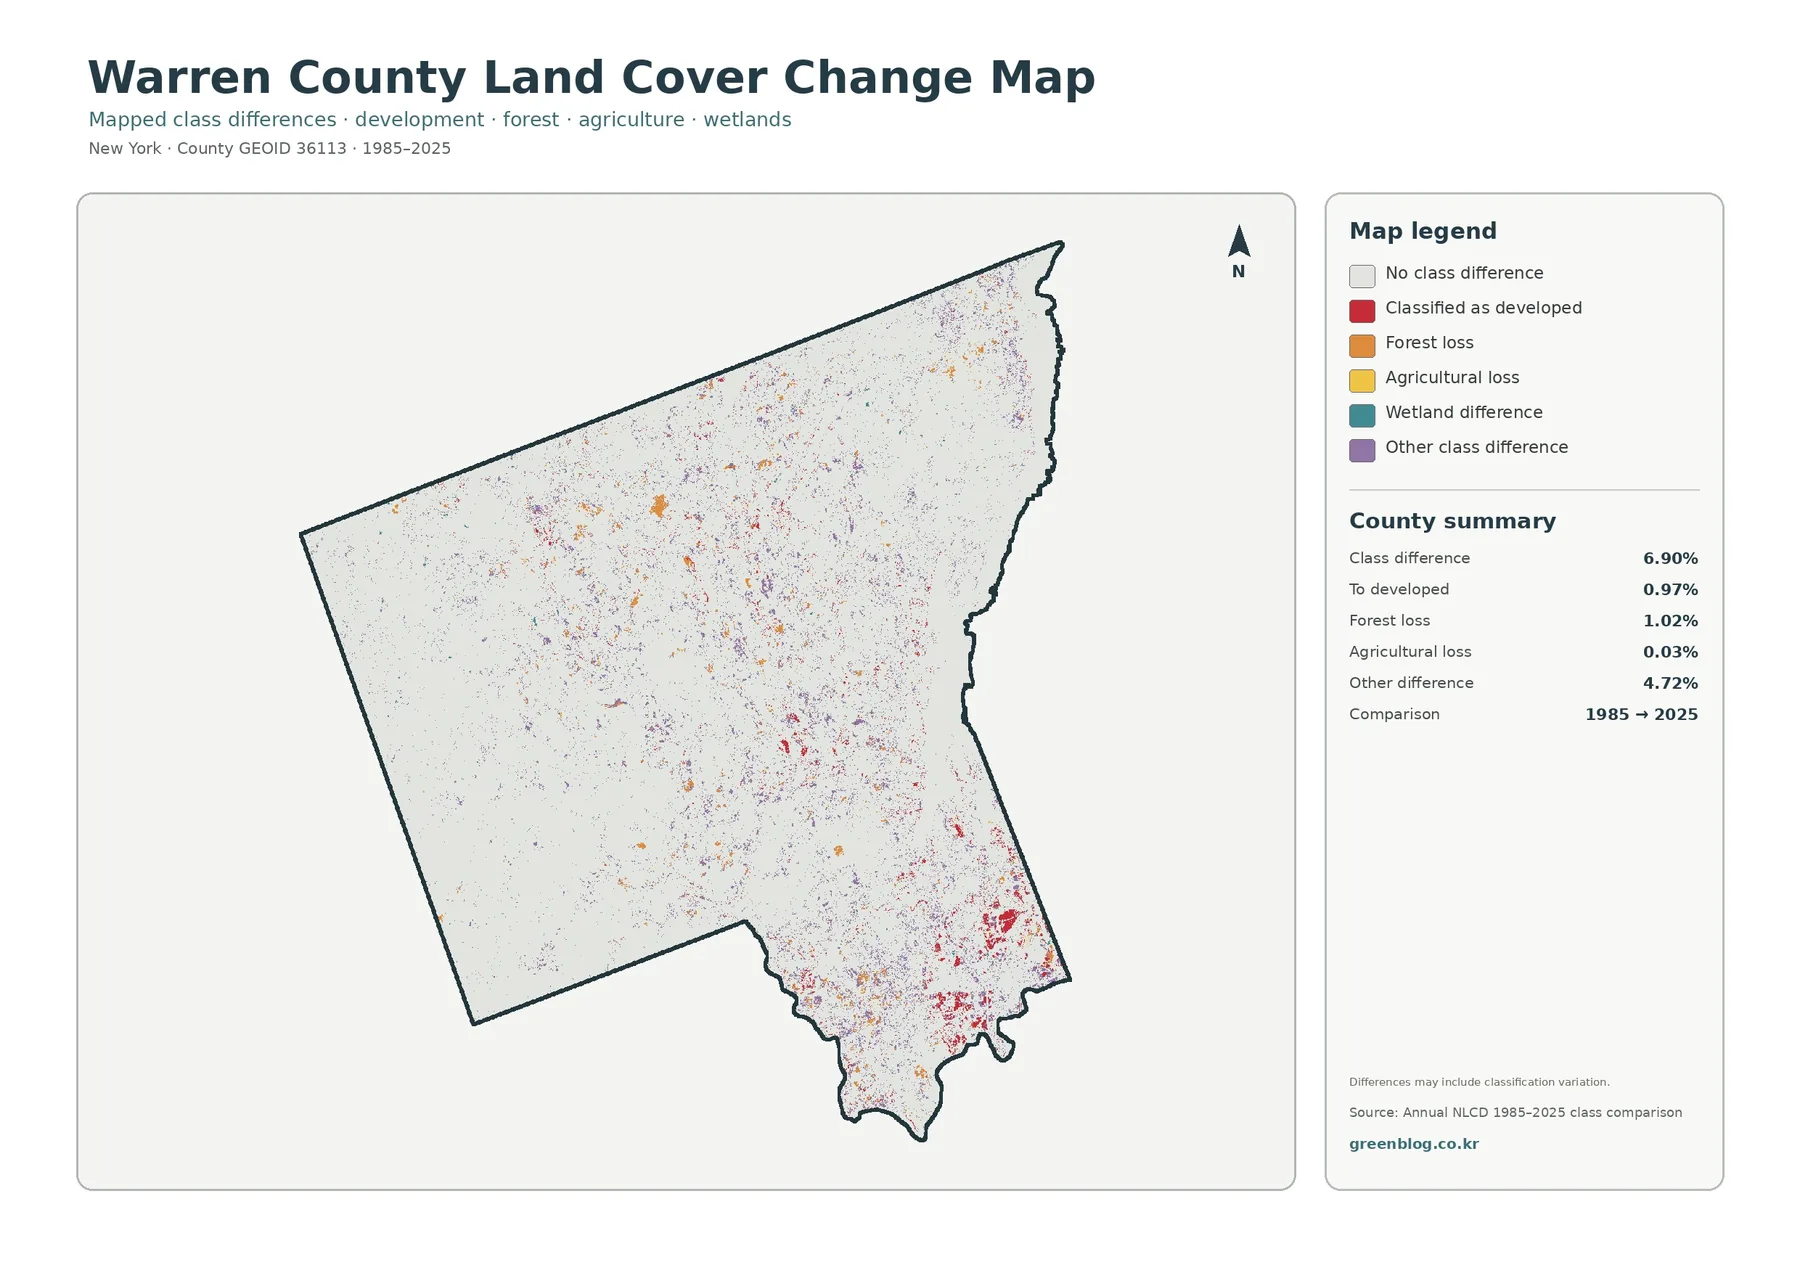
Class difference totals 6.90% in the 1985–2025 comparison. Of that total, 0.97% is summarized as classified to developed, 1.02% as forest loss, and 0.03% as agricultural loss. Other class difference is the largest listed component at 4.72%. The legend also includes wetland difference, visible as scattered teal areas, but the summary panel does not provide a separate percentage for that category.
Red developed-class differences are easiest to notice in the southeast and in a number of smaller interior clusters. Orange forest-loss cells are scattered across a much wider area, usually as small patches rather than one continuous block. Yellow agricultural-loss marks are rare, which matches the very small 0.03% summary. Purple other differences appear broadly through the county and account for most of the listed change total.
This comparison should be read as a difference between two classified endpoints, not as a complete history of every land change between 1985 and 2025. A cell may differ because the surface actually changed, because a boundary shifted slightly, or because a mixed pixel was assigned to another class. A mixed pixel is simply a grid cell containing more than one real-world surface. Additional years, aerial imagery, or site-level data are needed before assigning a specific cause.
A practical way to read the map set without mixing the legends
Start with the general land-cover map to locate the main forest mass, Lake George, other water bodies, and the southeast developed cluster. Then switch to the impervious map at the same location to see whether hard surfaces are broadly or narrowly concentrated. The forest-and-farmland view is useful for stepping back from development and comparing the large forest area with small open-land patches. Finish with the 1985–2025 comparison only after the current pattern is clear.
Using a fixed reference location prevents one legend from being mistaken for another. For example, the southeast appears red on the general map because it contains developed land; on the impervious map, different shades of orange and red represent percentages of hard surface. On the change map, red has yet another meaning: cells classified to developed in the comparison. The colors may look related, but each map answers a different question.
Download the four original Warren County JPG maps
The download ZIP contains four separate original JPG files: 2025 general land cover, forest and farmland, impervious surface/developed land, and the 1985–2025 class-difference map. Each file includes its own title, legend, and county summary, so it can be used independently in a lesson, presentation, reference folder, or environmental comparison. The four-map set is most useful when the same location is checked across more than one theme.
Each original JPG is 2480×1754 pixels. The asset manifest does not mark the files as meeting an A3 high-resolution reference, so the page should not promise a specific print quality or page size. Before large-format printing, check the legend and small text at the actual output size. The WebP previews are designed for convenient on-page viewing; the downloaded JPG files are the better basis for judging print sharpness.
Where these maps are most useful
For a broad regional introduction, the general land-cover map gives the clearest single-page summary. It shows why Warren County reads as a heavily forested Adirondack county while still containing major water features and a concentrated developed south. The forest-and-farmland version is better when the discussion is about forest continuity or the limited extent of agricultural and open land. It removes some visual competition from developed classes.
Watershed and environmental lessons can use the water and wetland shares as separate topics. Water is 6.59%, wetlands are 6.99%, and the two appear in different patterns across the county. The county’s official Lake George page can add local water-body information that is not contained in the land-cover image itself. These maps do not provide water quality, streamflow, depth, flood-zone, or regulatory information.
Planning discussions can use developed cover and impervious surface as context, but not as a substitute for municipal planning data. Developed cover is 6.75%, mean impervious surface is 1.82%, and 1.04% of the county falls in the 50%+ impervious category. Those three measures describe different aspects of the landscape. None of them indicates zoning, building permission, parcel ownership, or future development potential.
Important limits when reading classified land-cover pixels
Annual NLCD land cover is a raster product, meaning the landscape is represented as a grid of cells rather than exact parcel shapes. A real forest edge, narrow road, shoreline, or small wetland can cross a cell in a complicated way, yet the map must assign a generalized class. Because of that, the colored boundary should never be treated as a surveyed property line or a precise legal boundary.
Countywide percentages are summaries, not local percentages. Forest at 77.51% does not mean that every town or every square mile has the same forest share. The southeastern developed area, the Lake George shoreline, and the broad western forest have very different local patterns even though they contribute to one county total. Use the summary to understand overall scale and the map itself to describe location.
The 2025 map also has a time limit. Construction, tree cover changes, wetland shifts, or other surface changes after the observation period may not appear. The 1985–2025 comparison has a different limitation because it looks at two endpoints rather than a continuous sequence. For present-day parcel decisions or detailed change analysis, combine these maps with newer imagery, local GIS layers, field observations, or other purpose-specific records.
Frequently Asked Questions
What is the dominant land cover in Warren County in 2025?
Forest is the dominant class at 77.51%. Wetlands account for 6.99%, developed land 6.75%, water 6.59%, and agriculture 0.71%. The county total is strongly forested, but Lake George and other water bodies create large nonforest features, while the most noticeable developed concentration lies in the southeast.
Why is developed cover 6.75% while mean impervious surface is only 1.82%?
Developed land cover is a broad class that can contain buildings, roads, lawns, trees, and soil within the same developed setting. Impervious surface measures the share occupied by hard surfaces such as pavement and rooftops. That is why the mean impervious value can be much lower than the developed-cover share. Areas at 50% or more impervious surface account for 1.04% of the county.
Does the 6.90% class difference mean Warren County lost 6.90% of its forest?
No. The 6.90% figure is the total share of cells classified differently in 1985 and 2025. Forest loss is listed separately at 1.02%, while cells classified to developed are 0.97%, agricultural loss is 0.03%, and other class difference is 4.72%. The map should be read by category, and it does not by itself establish the cause of a classification change.
Map File Information
The ZIP contains four original JPG maps for Warren County: 2025 land cover, forest & farmland, impervious surface/developed land, and the 1985–2025 class-difference map.
- Included Files: Warren County land cover, forest & farmland, impervious surface, and 1985–2025 class-difference maps
- File Type: One ZIP with four separate original JPG maps
- Intended Use: Print reference, teaching, presentations, watershed context, and map comparison
Related Maps
- Albany County Land Cover Map
- Allegany County New York Land Cover Map
- Bronx County New York Land Cover Map
Sources and Reference Data
- MRLC Annual NLCD Data — Official access point for Annual NLCD land-cover and impervious-surface data.
- USGS Annual NLCD Land Cover Classification — Official classification documentation for the land-cover categories used in the map series.
- Warren County – Lake George — County water-resources information for Lake George, including location and watershed context.
- New York State – Warren County — State overview identifying the Lake George area, Glens Falls, and the county’s southern Adirondack setting.
Green Map creates custom-edited map images using open geographic data sources such as geoBoundaries, Natural Earth, OpenStreetMap, and government open data.
These maps are edited visual materials, not raw data files, and are provided for education, documents, presentations, and graphic reference.