Onondaga County combines three land-cover patterns that are unusually close in scale. Agriculture accounts for 30.33% of the 2025 map, forest for 29.71%, and developed land for 26.26%. Syracuse and Onondaga Lake create a strongly developed center, while farm fields, woods, wetlands, and large lakes become more prominent toward the county’s outer areas.
This page uses four maps to compare those patterns: general land cover, forest and farmland, impervious surface, and change from 1985 to 2025. The four original JPG maps are also available together in one download for printing, classroom work, reports, or side-by-side county reference.
Table of Contents
Onondaga County’s 2025 land-cover balance
No single cover type dominates the county. Agriculture leads at 30.33%, but forest is only slightly lower at 29.71%, and developed land is close behind at 26.26%. Wetlands make up 9.59% and water 3.31%. Together, mapped wetlands and water represent 12.90% of the county, so lakes, wet areas, and drainage corridors are a meaningful part of the landscape rather than a small background detail.
Development forms its largest continuous block around Syracuse. The urban pattern wraps around Onondaga Lake and spreads into nearby suburban communities. Farther from the center, developed land becomes thinner and more fragmented, while agriculture and forest take over most of the map. This contrast makes the transition from the Syracuse urban area to the surrounding rural county easy to recognize.
Land cover is not the same as zoning, ownership, or legal land use. The maps classify what covers the ground, such as forest, crops, water, wetlands, or developed surfaces. A parcel can contain more than one cover type, and a forest class does not indicate whether land is public or private. Parcel boundaries and zoning districts require separate local datasets.
General land cover: Syracuse at the center of a farm-and-forest county
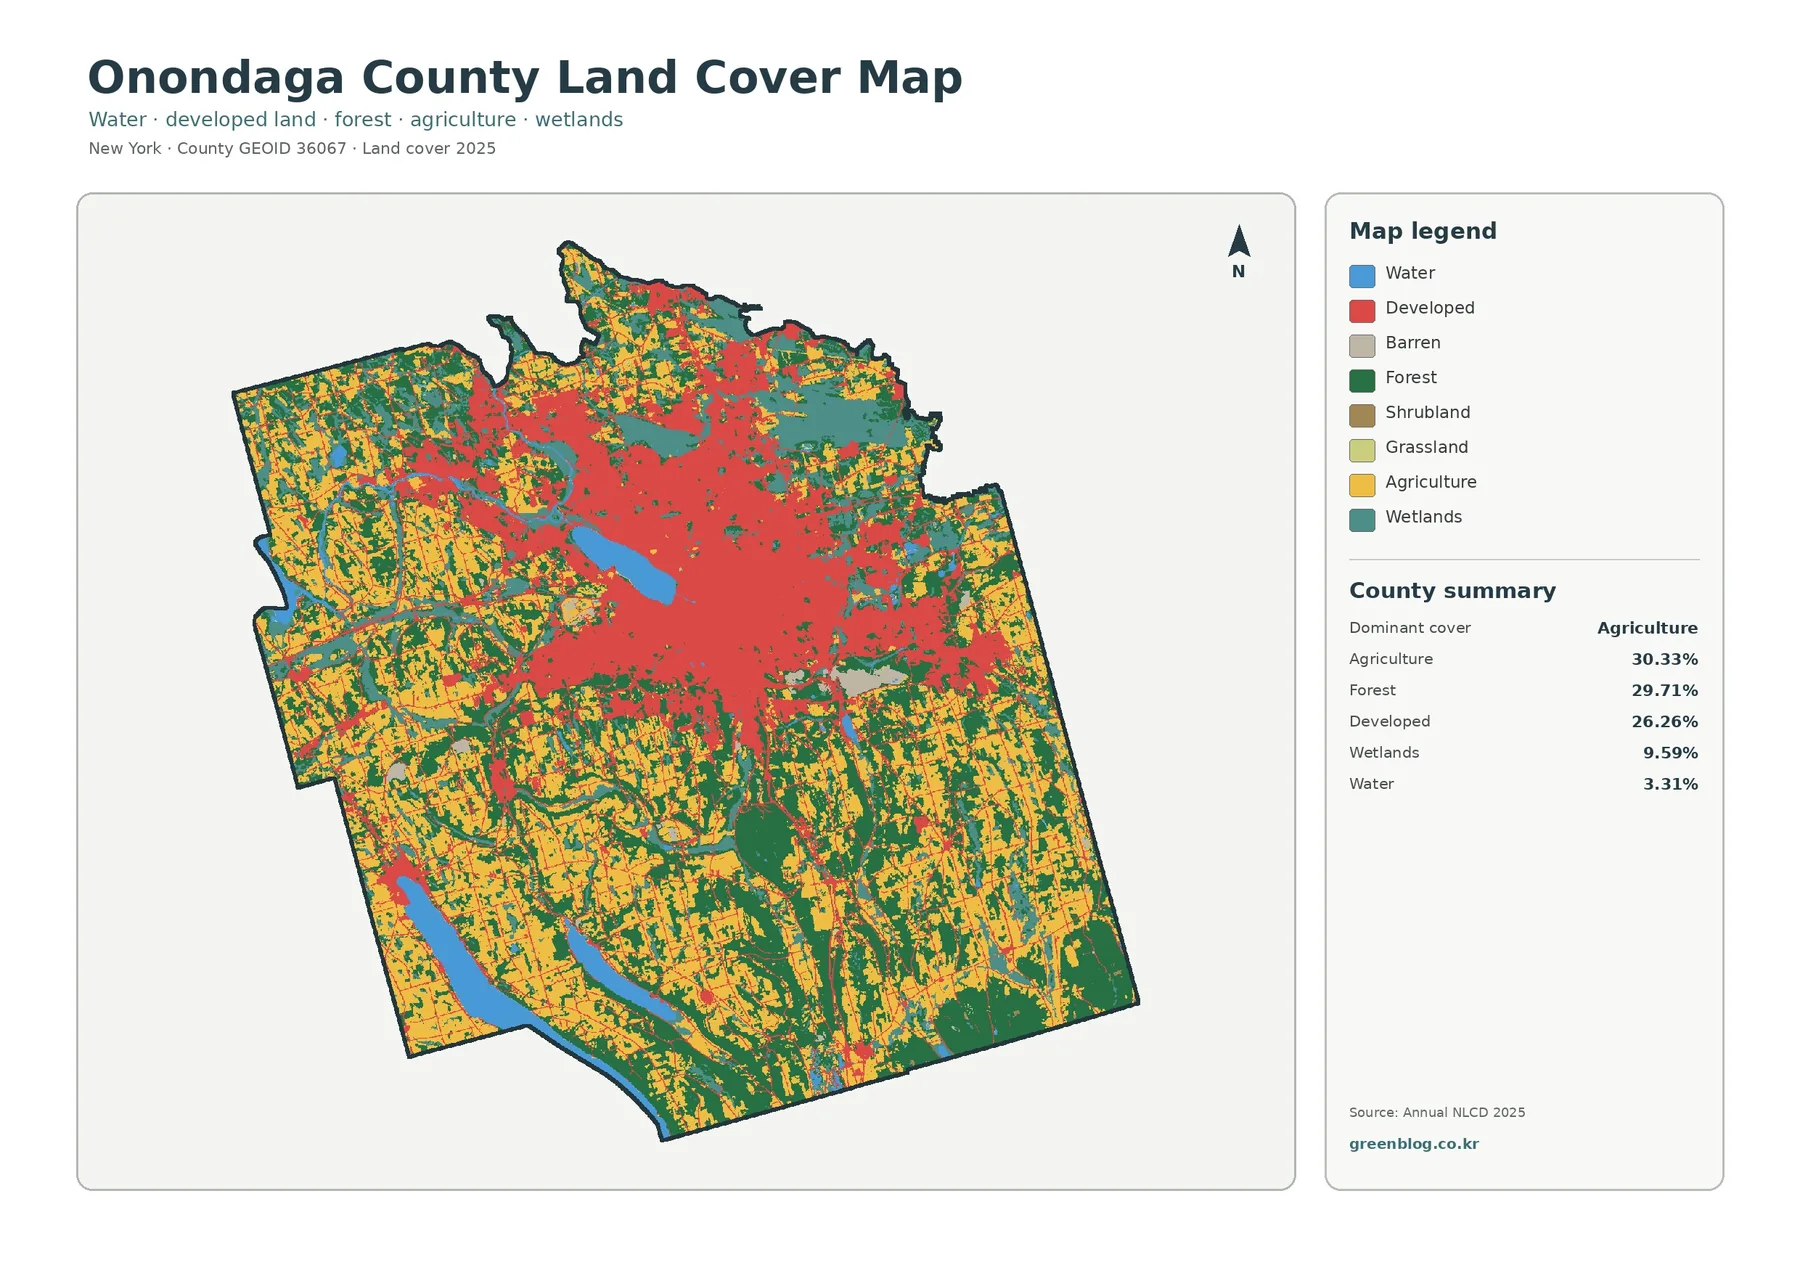
The general map shows the county’s full mixture of classes. Syracuse appears as the broad red developed area near the center, and Onondaga Lake cuts into that pattern as a clear blue water body. Development extends outward along settled corridors, but the red areas quickly break into smaller pieces as the map moves west, south, and east into agricultural and forested country.
Agriculture is the largest class at 30.33%. Yellow areas are widespread across the outer county, usually mixed with woods rather than forming one continuous farm block. Cornell Cooperative Extension’s Onondaga County agricultural census summary lists 572 farms and 164,239 acres of land in farms for 2022. Those records are not the same as a land-cover classification, but they help explain why agriculture is so prominent in the map.
Forest is nearly equal at 29.71% and appears throughout the county, with larger connected areas especially noticeable in the south and southeast. Wetlands account for 9.59% and often appear near water or in low-lying corridors. Open water adds 3.31%. The mix of woods, fields, wetlands, and lakes gives the rural areas several distinct patterns rather than one uniform appearance.
Forest and farmland become easier to compare
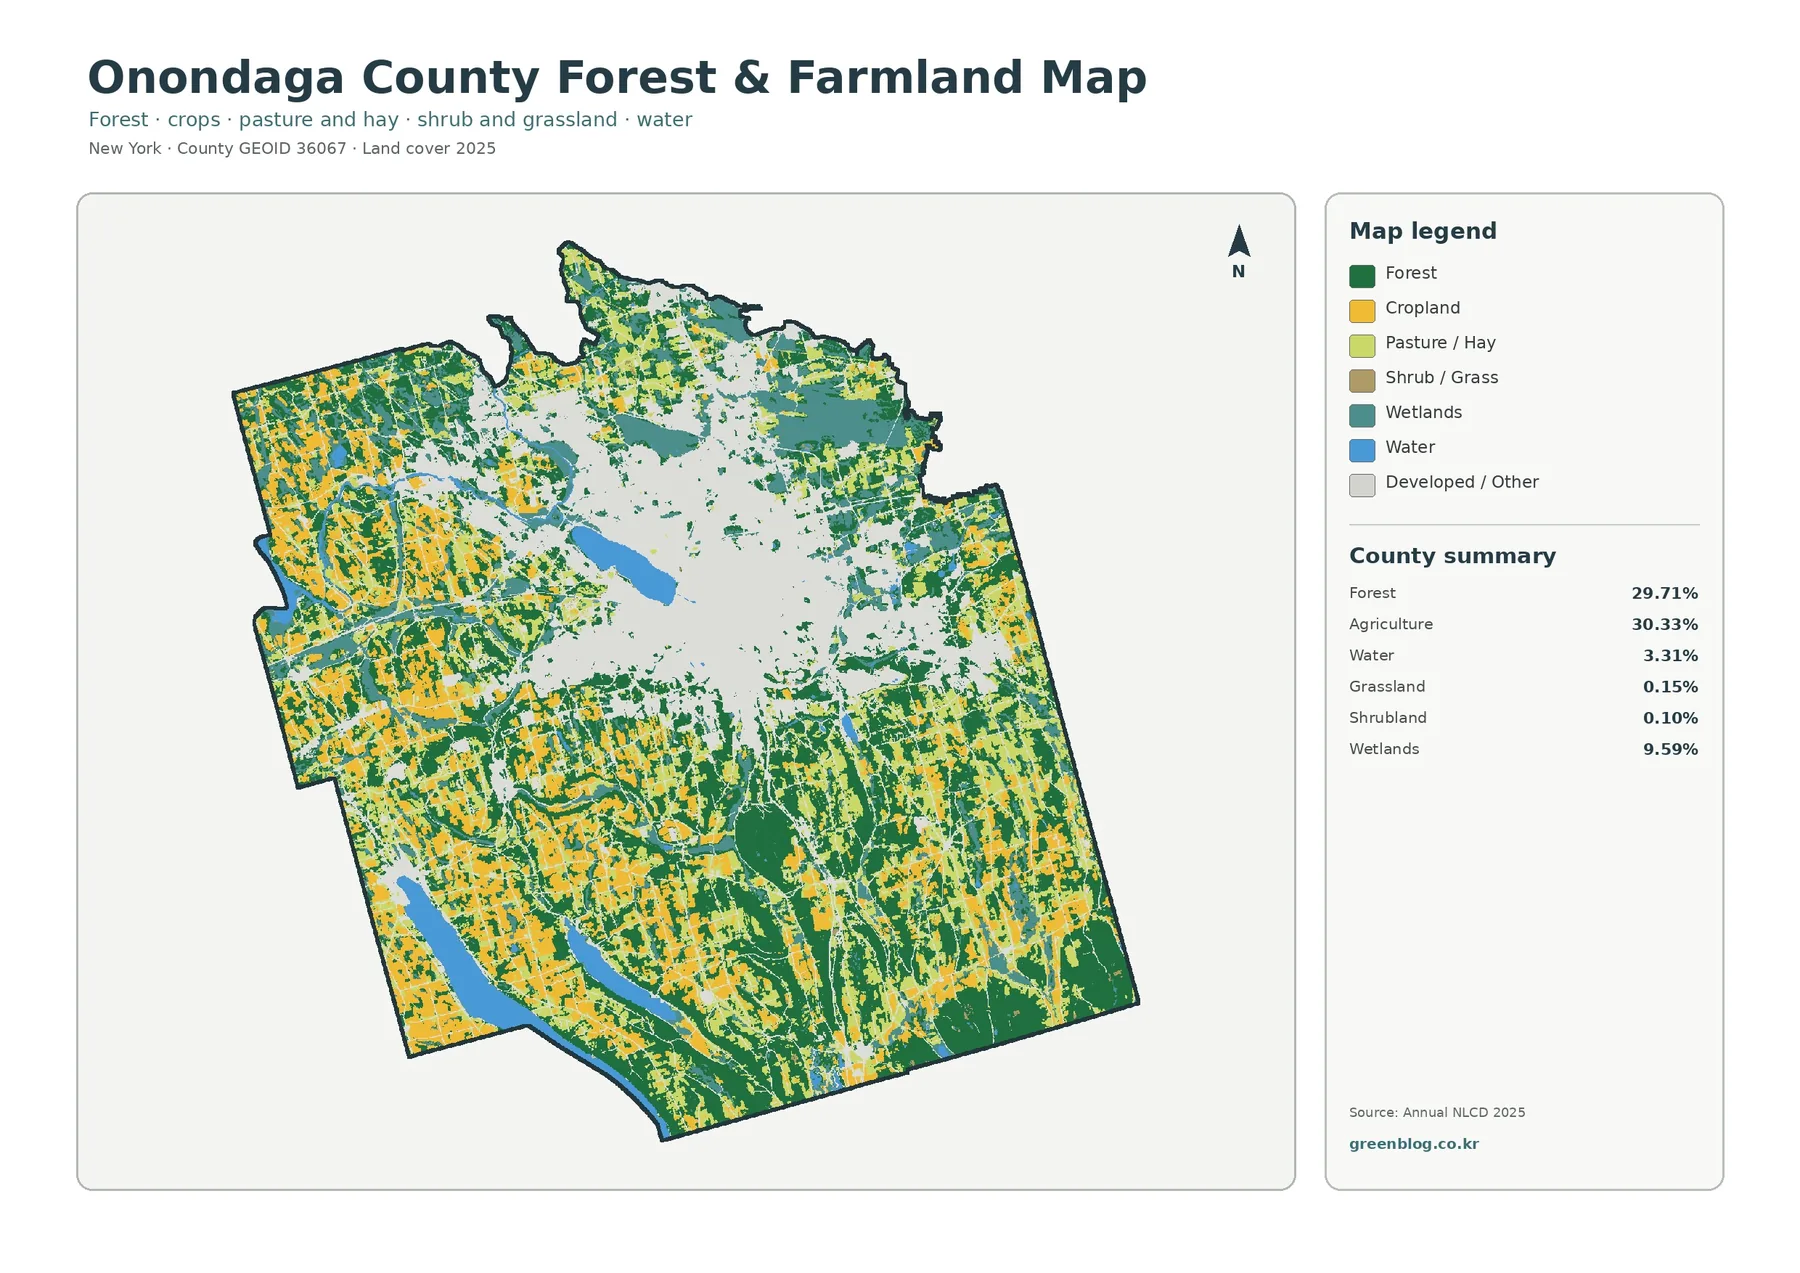
The forest-and-farmland map pushes most development into a light background and makes the rural pattern much clearer. Agriculture at 30.33% and forest at 29.71% are almost balanced, while grassland is only 0.15% and shrubland 0.10%. In other words, the nonurban county is better described through the relationship between fields and woods than through broad grass or shrub areas.
Western Onondaga County contains broad farm areas divided by forest strips and patches. Farther south, the two classes become more interwoven, and the eastern side also alternates between agricultural land, forest, and wetlands. These changes in pattern make the map useful for comparing rural sections of the county even though the countywide percentages remain almost equal.
The colors should not be treated as legal farm or forest boundaries. A green raster cell simply indicates forest as the mapped dominant cover, and an agricultural cell does not necessarily match an active farm parcel. Agricultural districts, protected farmland, ownership, or forest-management status must be checked with local planning and property information.
Impervious surface separates dense urban land from lower-intensity development
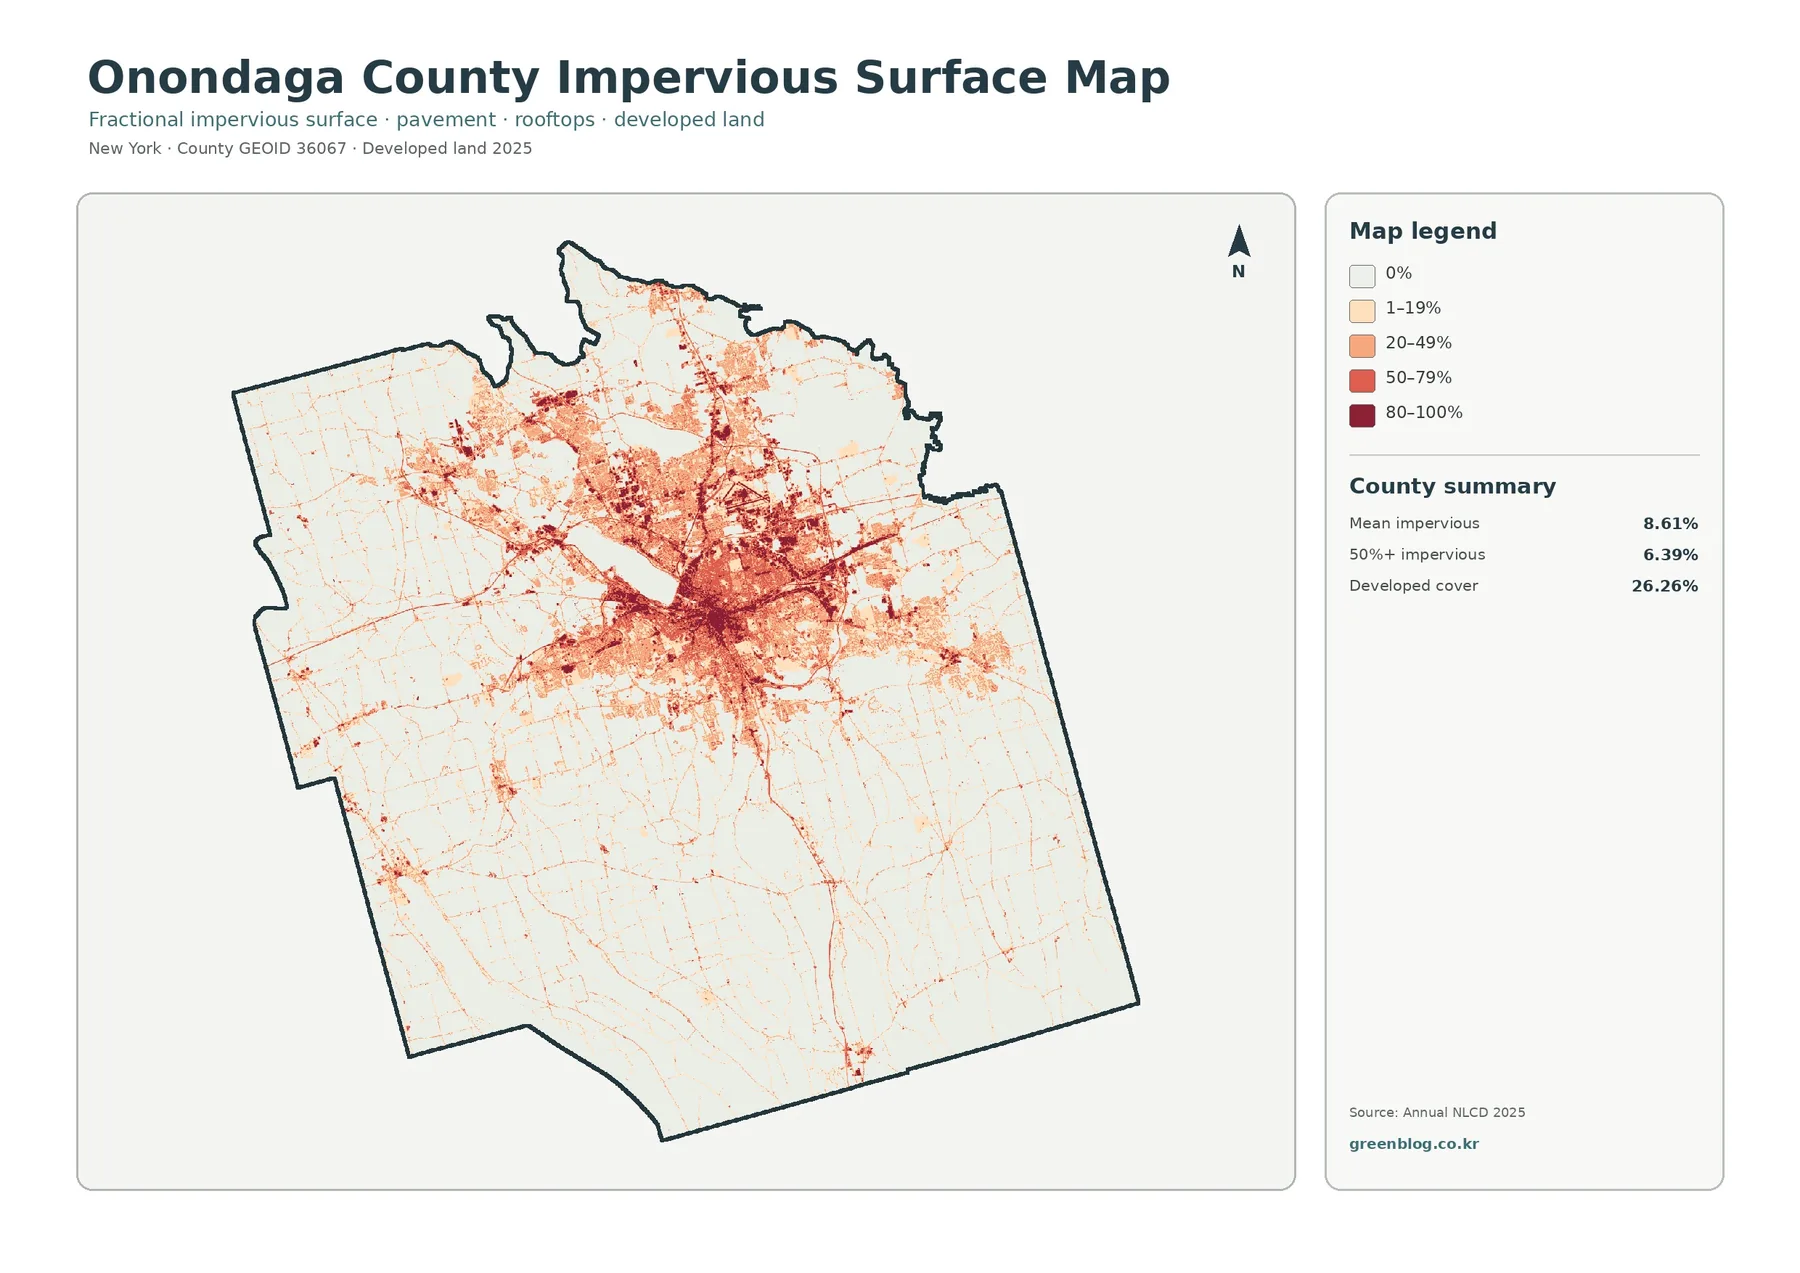
Impervious surface means pavement, rooftops, and similar materials that do not readily absorb rainfall. The map groups values into 0%, 1–19%, 20–49%, 50–79%, and 80–100%. Onondaga County’s mean impervious value is 8.61%, while 6.39% of the mapped area is at least 50% impervious. Developed land is much larger at 26.26% because developed classes can also include lawns, trees, and other permeable spaces.
The highest values cluster around Syracuse and the developed area beside Onondaga Lake. Darker surfaces branch outward along road and settlement corridors, while most rural areas remain in the lightest classes except for thin lines and small town clusters. This layer therefore shows urban intensity more clearly than the general land-cover map.
Imperviousness is useful for watershed context, but it should not be turned into a direct cause-and-effect claim. The map can show where hard surfaces are concentrated near lakes, wetlands, or streams. Determining whether a particular road or neighborhood contributes to flooding or water-quality problems requires drainage, soils, topography, rainfall, and monitoring data that are outside this map.
Mapped differences from 1985 to 2025
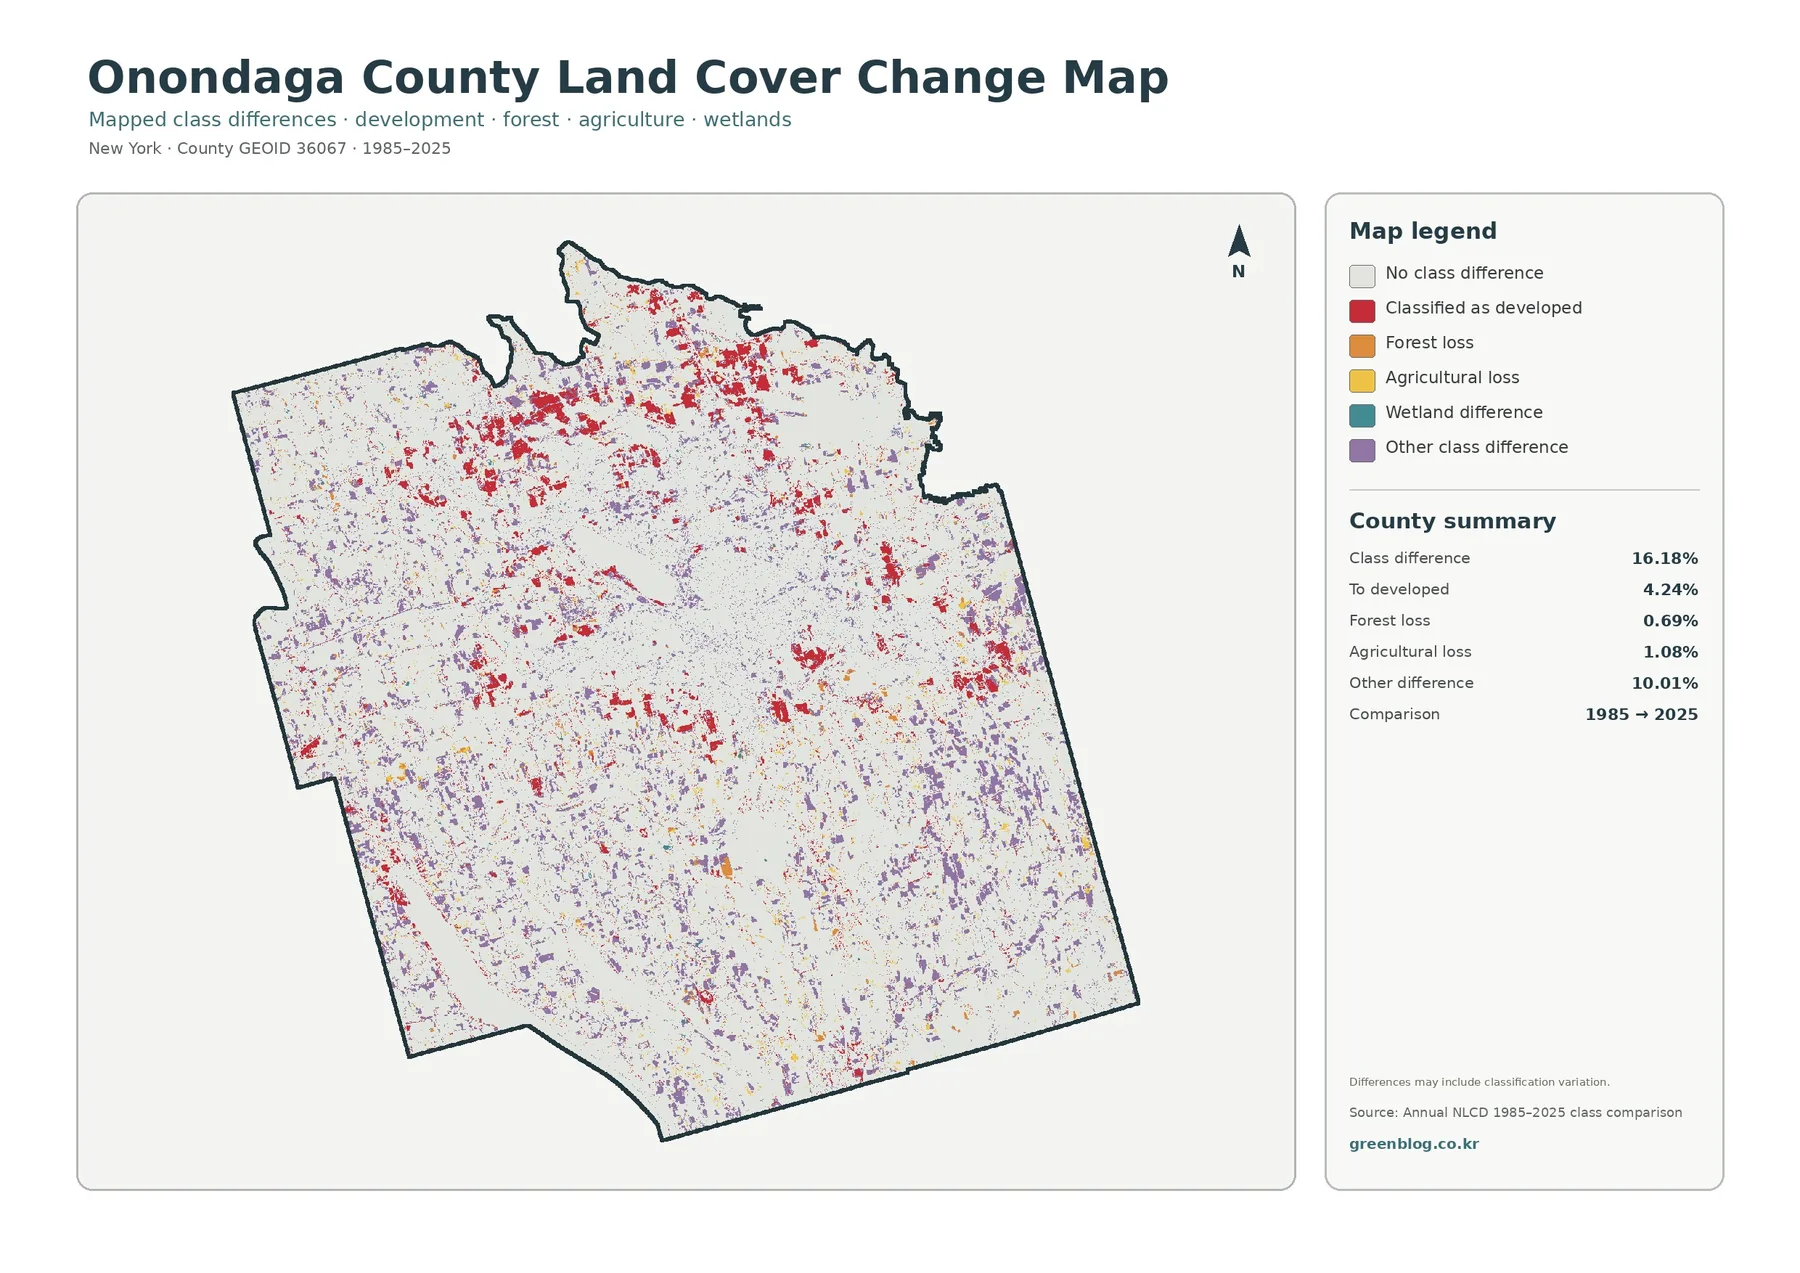
The change map compares classifications from 1985 and 2025. A class difference is mapped across 16.18% of the county. Areas classified as changing to developed land account for 4.24%, forest loss for 0.69%, agricultural loss for 1.08%, and other class differences for 10.01%. Most mapped difference therefore cannot be summarized as development alone.
Red developed-change areas appear around the broader Syracuse area, northern suburban sections, and scattered communities farther from the center. Because much of the old urban core was already developed in 1985, some of the more visible change lies along established urban edges. Rural areas contain more scattered purple “other difference” cells along with smaller agricultural and forest changes.
Not every colored cell should be read as confirmed land conversion. Forest edges, wetlands, and mixed agricultural areas can be classified differently because of image conditions or classification methods. The map itself notes that differences may include classification variation. It works best as a screening layer for finding change clusters that can then be checked with aerial imagery or local planning records.
Lakes and wetlands add another layer to the county pattern
Onondaga Lake sits directly beside Syracuse, placing one of the county’s most visible water bodies next to its largest developed concentration. The New York State Department of Environmental Conservation describes the lake as being on the edge of the City of Syracuse and receiving drainage from a roughly 285-square-mile watershed located mostly in Onondaga County. Nine Mile Creek and Onondaga Creek are the two largest tributary sources identified by DEC.
Oneida Lake touches the county along the north, while the southwest includes the long forms of Skaneateles Lake and Otisco Lake. DEC identifies Otisco as the easternmost of the eleven Finger Lakes and notes that it lies entirely within Onondaga County. These water bodies provide useful reference points for comparing nearby wetlands, farms, forests, and developed surfaces on the four maps.
Using the four maps and downloading the JPG set
The general map is the best overview, while the forest-and-farmland version is cleaner for rural comparison. The impervious layer distinguishes dense built surfaces from lower-intensity development, and the change layer adds the 1985–2025 time comparison. Looking at the same location across all four maps can separate present cover, development intensity, and long-term mapped difference without forcing one map to answer every question.
The set can support classroom lessons, county profiles, watershed introductions, agricultural and forest comparisons, and presentation graphics. Keep the legend and county boundary visible when printing or cropping. This is especially important for the change map because red means a change classified as developed, not every type of change, while purple represents other class differences.
The download ZIP contains four original JPG files: general land cover, forest and farmland, impervious/developed land, and land-cover change from 1985 to 2025. The files can be saved for offline reference, printed, inserted into documents, or arranged side by side for comparison.
Resolution and classification limits
Annual NLCD is a raster dataset derived from satellite imagery at 30-meter spatial resolution. A raster divides the landscape into grid cells, and each cell receives a class or value. Small buildings, narrow roads, field edges, and strips of trees can share one cell, so the displayed boundaries are generalized rather than surveyed property lines.
The impervious product also does not draw exact building footprints. It estimates the share of hard surface within each cell. Time comparisons require additional care because real land-cover change and classification variability can both create differences. MRLC warns that methodological differences between releases can produce apparent change, so important conclusions should be checked against compatible data and local records.
For those reasons, this map set is strongest at the county scale. Use it to compare broad patterns and identify places that deserve a closer look. Current zoning, ownership, construction status, exact acreage, or regulatory decisions should always be checked with the appropriate local or state source.
Frequently Asked Questions
What is the largest land-cover class in Onondaga County?
Agriculture is the largest 2025 class at 30.33%. Forest is very close at 29.71%, and developed land follows at 26.26%. The close balance helps explain why a major urban center and broad rural landscapes are both prominent in the same county map.
Why is developed land 26.26% while mean impervious surface is only 8.61%?
Developed land can include lawns, trees, and landscaped open space along with roads and buildings. Impervious surface measures only the share covered by harder materials such as pavement and rooftops, so the countywide average is naturally lower.
Does the 1985–2025 map show parcel-by-parcel development history?
No. It compares 30-meter raster classifications at county scale. It can locate broad change clusters, but the history of a specific property should be verified with aerial imagery, planning records, building information, or other detailed sources.
What files are included in the download?
The ZIP contains four original JPG maps: general land cover, forest and farmland, impervious/developed land, and land-cover change from 1985 to 2025. Because each emphasizes a different part of the landscape, they are most useful when compared together.
Map File Information
Onondaga County Land Cover Maps 4 original JPG maps in one ZIP file.
- Included Files: Use only the versions confirmed in the article and supplied images
- File Type: Use the confirmed download contents
- Intended Use: Printing, education, presentations, and map-based projects
Related Maps
- Albany County Land Cover Map
- Allegany County New York Land Cover Map
- Bronx County New York Land Cover Map
Sources and references
- MRLC Annual NLCD Data – source data access and Annual NLCD product information
- USGS Annual NLCD Land Cover Classification – land-cover classes and product description
- MRLC FAQ – 30-meter Annual NLCD resolution and cautions about comparing releases
- Cornell Cooperative Extension of Onondaga County – Agriculture – county agricultural context and statistics
- New York State DEC – Onondaga Lake and Watershed – lake, watershed, and tributary information
- U.S. Census Bureau TIGER/Line Shapefiles – county boundary and geographic reference data
Green Map creates custom-edited map images using open geographic data sources such as geoBoundaries, Natural Earth, OpenStreetMap, and government open data.
These maps are edited visual materials, not raw data files, and are provided for education, documents, presentations, and graphic reference.