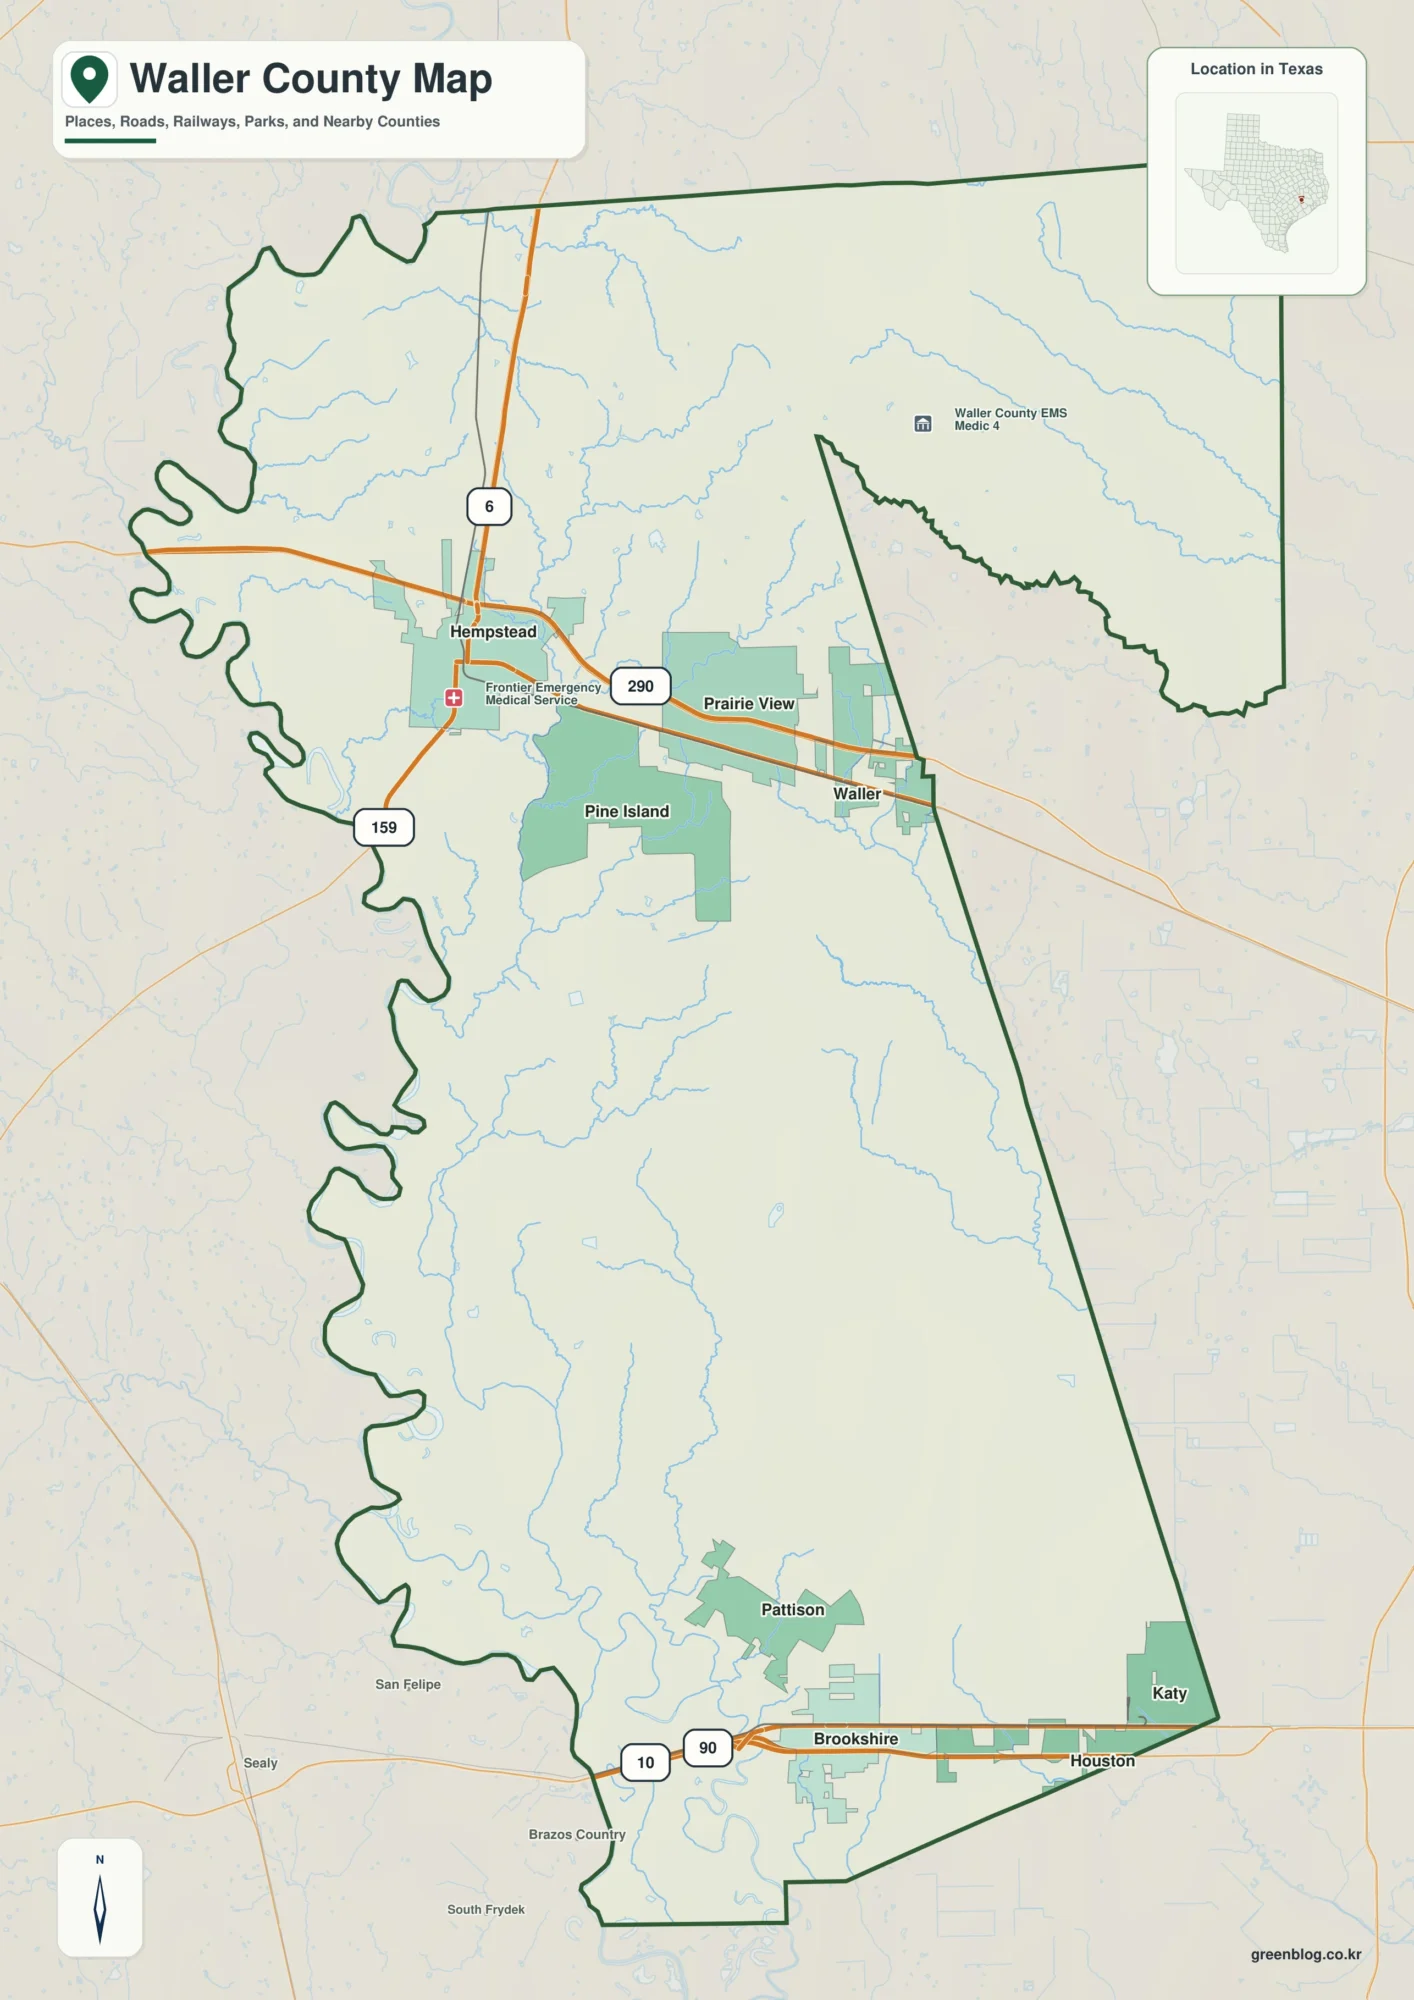
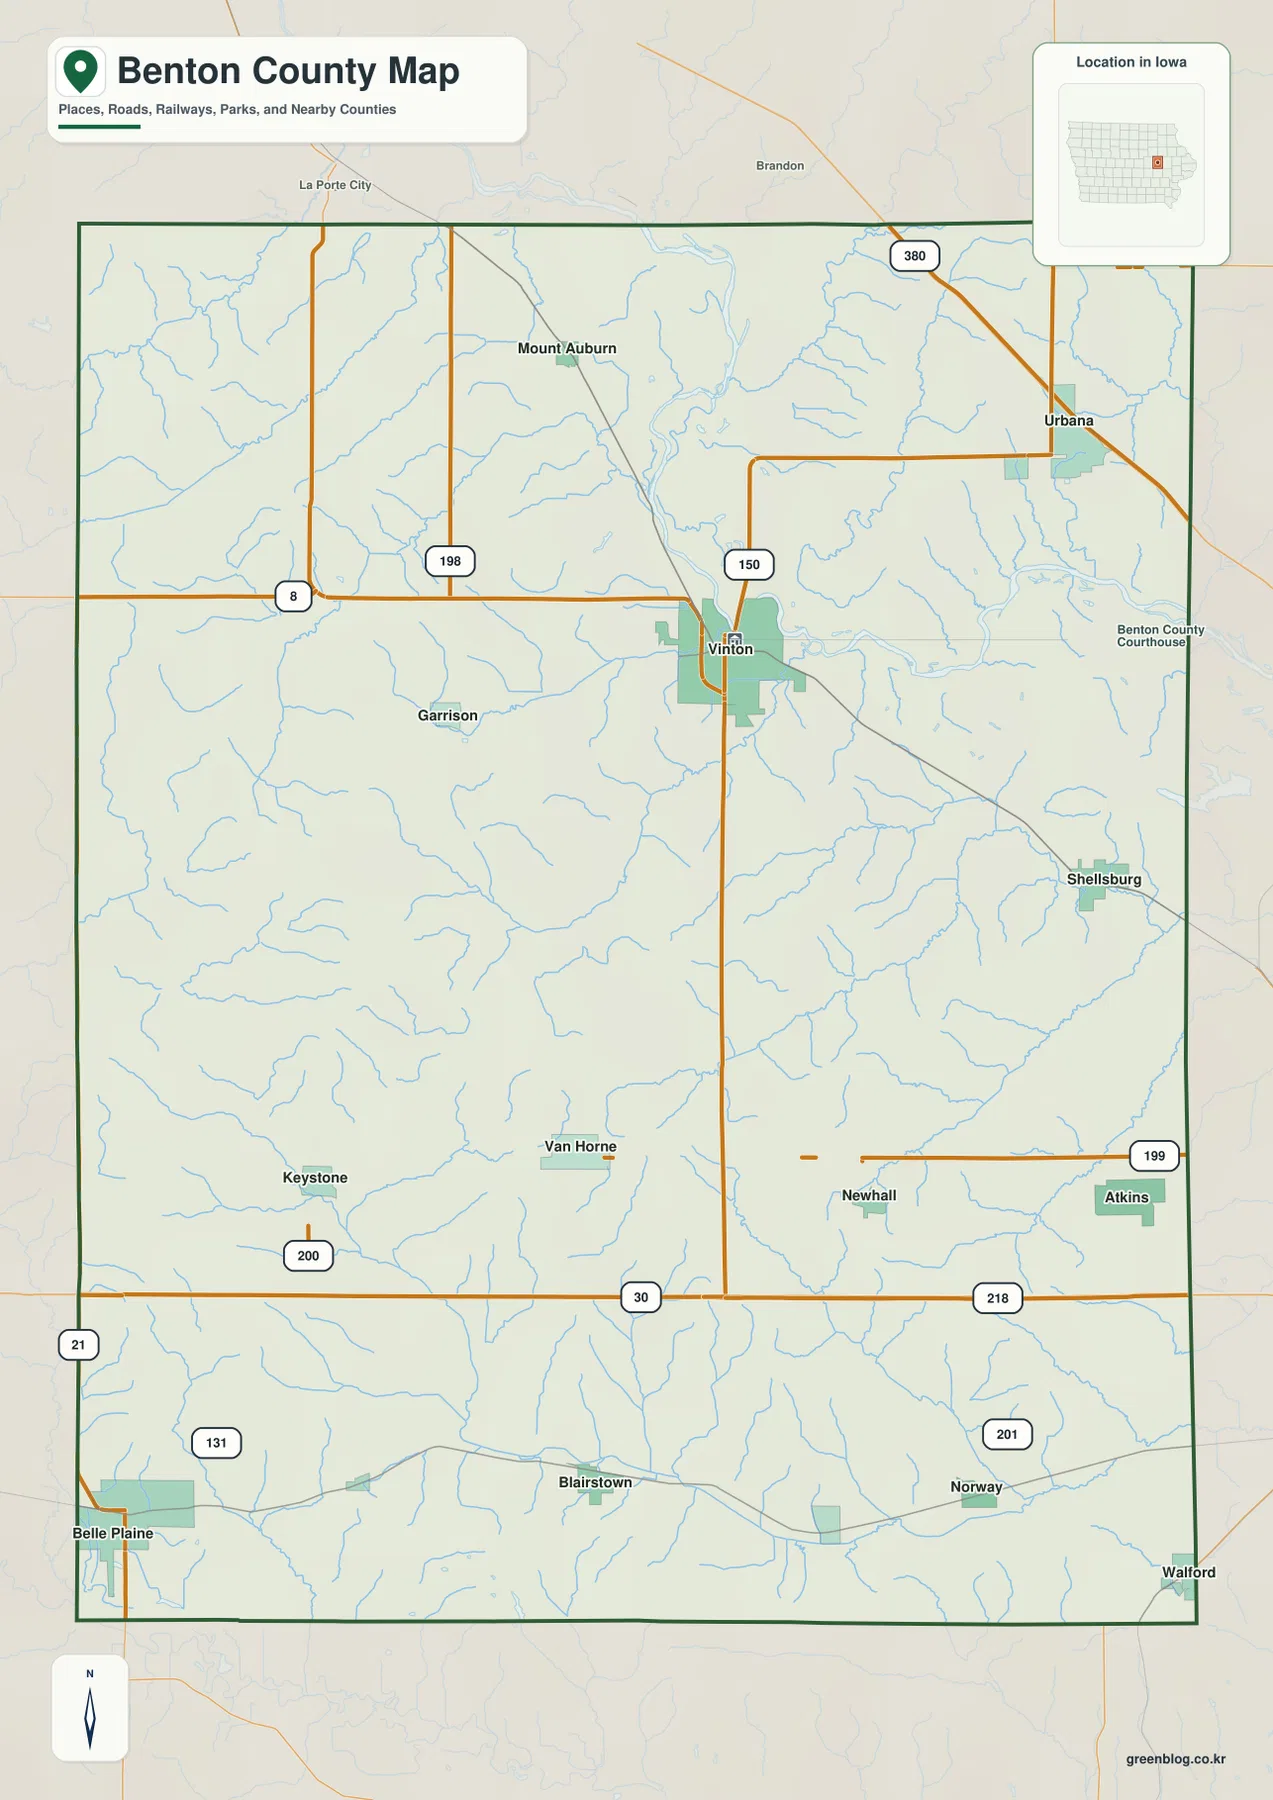
Taylor County in west-central Georgia is easiest to understand by starting at Butler and following the roads, creeks, and rolling terrain outward. The county map places Butler near the center of the road network, Reynolds to the east, and smaller labeled places such as Howard and Norwich toward the west. You can also download four high-resolution A3 JPG maps of Taylor County in one ZIP from this page, covering the county reference map, major cities, water features, and elevation.
The four views show a county that is more varied than the short list of towns suggests. State Route 3 runs north and south through Butler while Route 96 crosses the county from west to east toward Reynolds. The water map adds Patsiliga Creek, Beaver Creek, Whitewater Creek, Cedar Creek, several millponds, and many unnamed tributaries. The elevation map then explains why those streams occupy long green valleys between higher ridges, with actual elevations ranging from about 89 to 246 meters.
Table of Contents
Butler makes the road network and county outline easier to follow
Butler is the clearest starting point on the general county map. Route 3 passes through it from north to south and Route 96 crosses it from west to east. Route 208 is visible farther north, while Routes 283, 263, and 128 form a group of connections in the northeastern part of the county. South of Butler, Routes 195, 19, 90, 127, and 137 appear across the lower half of the map. Taken together, these roads show how the county is tied together without requiring every local street to be drawn.
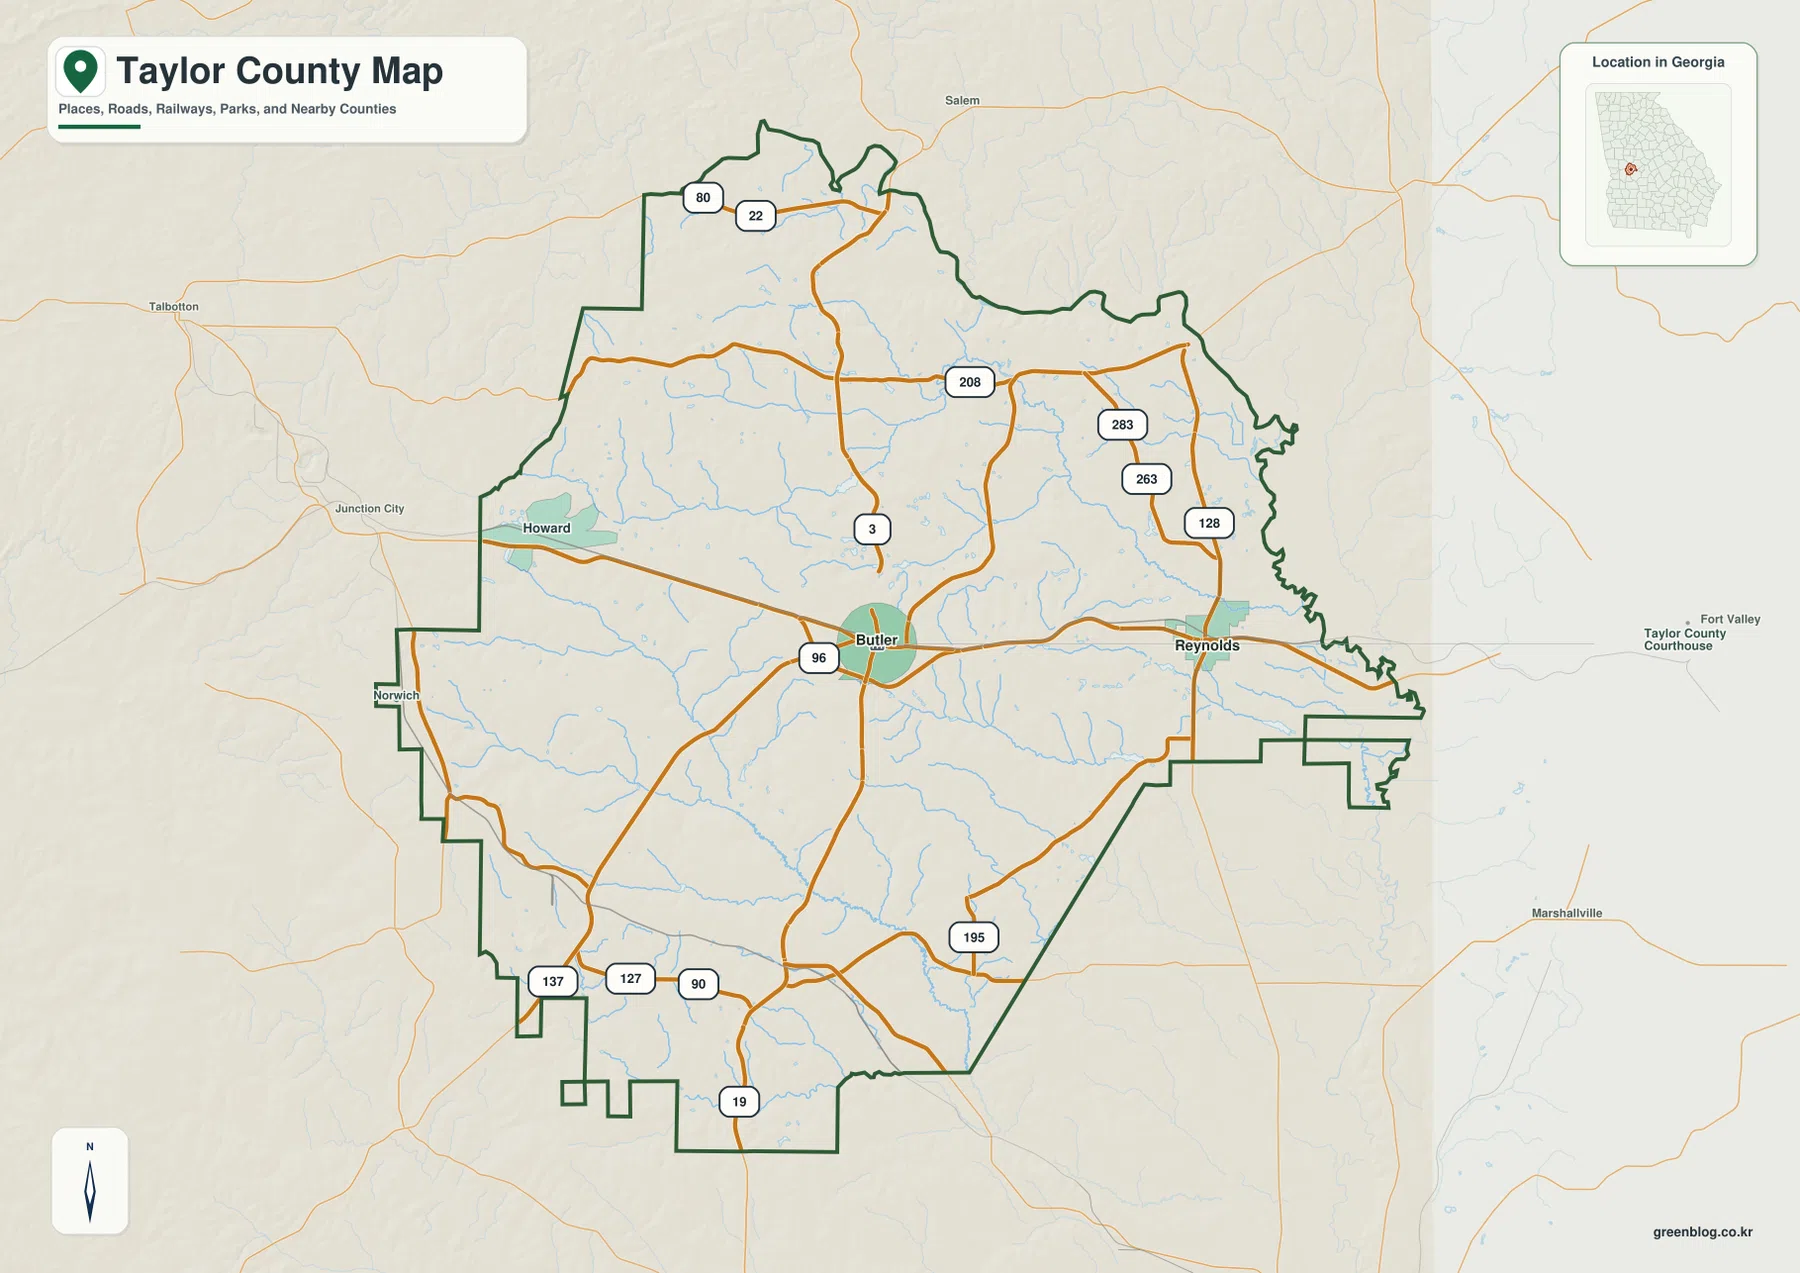
Reynolds sits east of Butler along Route 96 and provides a second useful reference point for the eastern side of the county. Howard appears to the west, and Norwich is labeled closer to the western edge. The northwestern corner includes Routes 80 and 22, while several roads converge and separate again near the southern boundary. Because the outline has multiple steps, notches, and a narrow eastern extension, the road map is also useful for seeing where the county shape changes rather than treating Taylor County as a simple rectangle.
This is a county-level reference, not a parcel, zoning, or turn-by-turn street map. It is most useful for locating the main towns, understanding the boundary, and seeing how state and federal routes cross the county. For an address, property line, or legal boundary, a more specialized official map is necessary. For general geographic orientation, however, the combination of the county outline and numbered roads gives a strong first view.
Butler and Reynolds form the two-city pattern shown on the city map
The city map simplifies the county to its two ranked major cities. Butler is listed with 1,935 people and Reynolds with 995 people on the map’s city index. Butler occupies the central part of Taylor County, while Reynolds lies farther east. With only two ranked cities shown, their separation is easy to see, and the surrounding road and stream network becomes the main context for understanding the space between them.
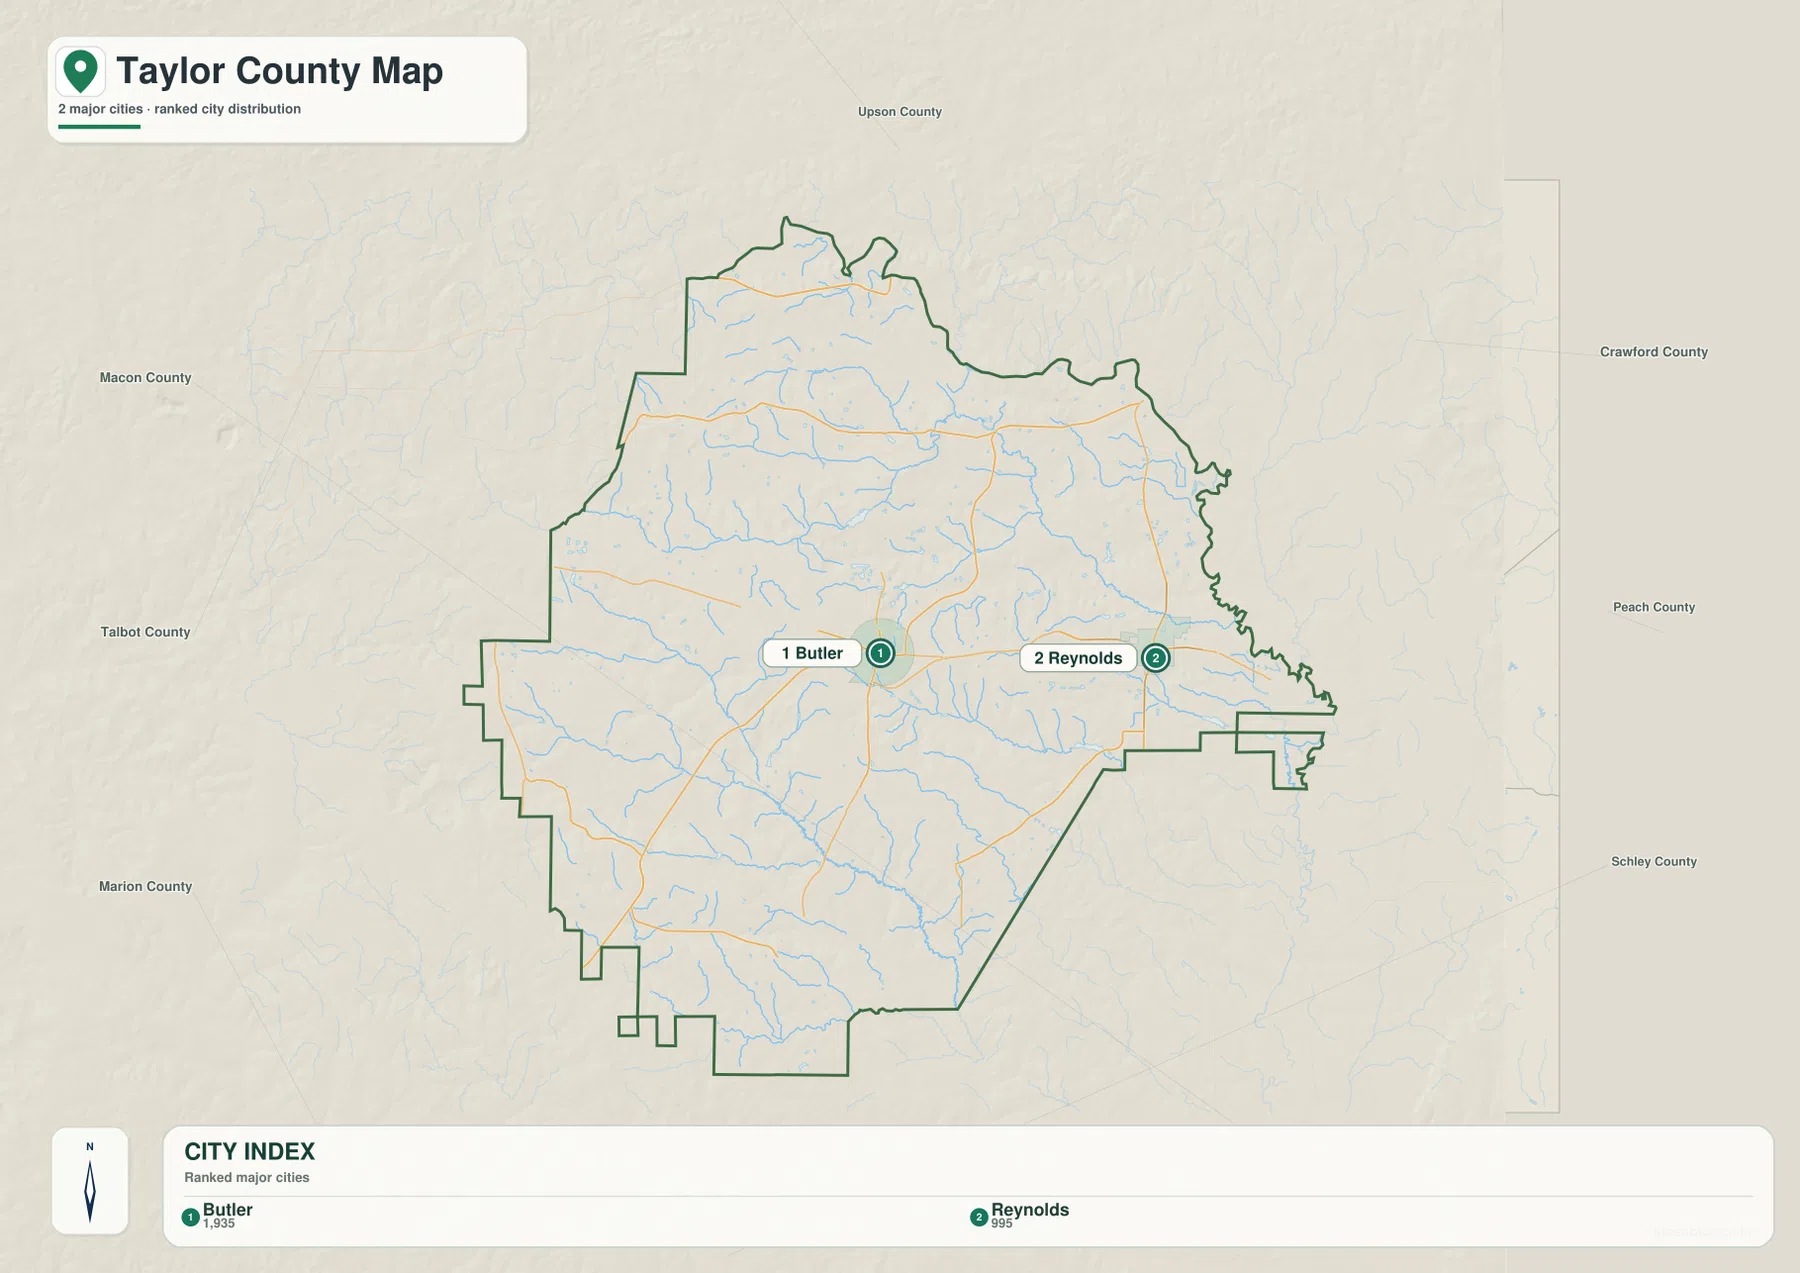
Butler is also the county seat, which makes its central location important for administrative orientation. Reynolds, by contrast, is the main ranked city shown on the eastern side of the county. The city map is not intended to show every unincorporated community or neighborhood. Its strength is the uncluttered comparison between the two largest labeled centers and the broad county shape around them.
The general map fills in details that the city map intentionally leaves out. Howard and Norwich appear as additional place labels, and the county is crossed by numerous roads and streams that do not show up as city markers. Looking at the two maps together keeps the city pattern from feeling isolated: Butler and Reynolds are the most prominent urban references, but they sit inside a much larger rural landscape of creeks, ponds, and rolling ridges.
Patsiliga Creek, Beaver Creek, and millponds break the county into many small valleys
The water map is much denser than the road map. Patsiliga Creek curves through the northeastern part of Taylor County, while Beaver Creek runs across the upper middle. Horse Creek and Meadow Creek appear farther south and east, and Whitewater Creek forms a prominent drainage through the southern half of the county. Cedar Creek follows the far southern area near the boundary. Many smaller unnamed tributaries branch into these larger channels, creating a fine network across nearly the entire county.
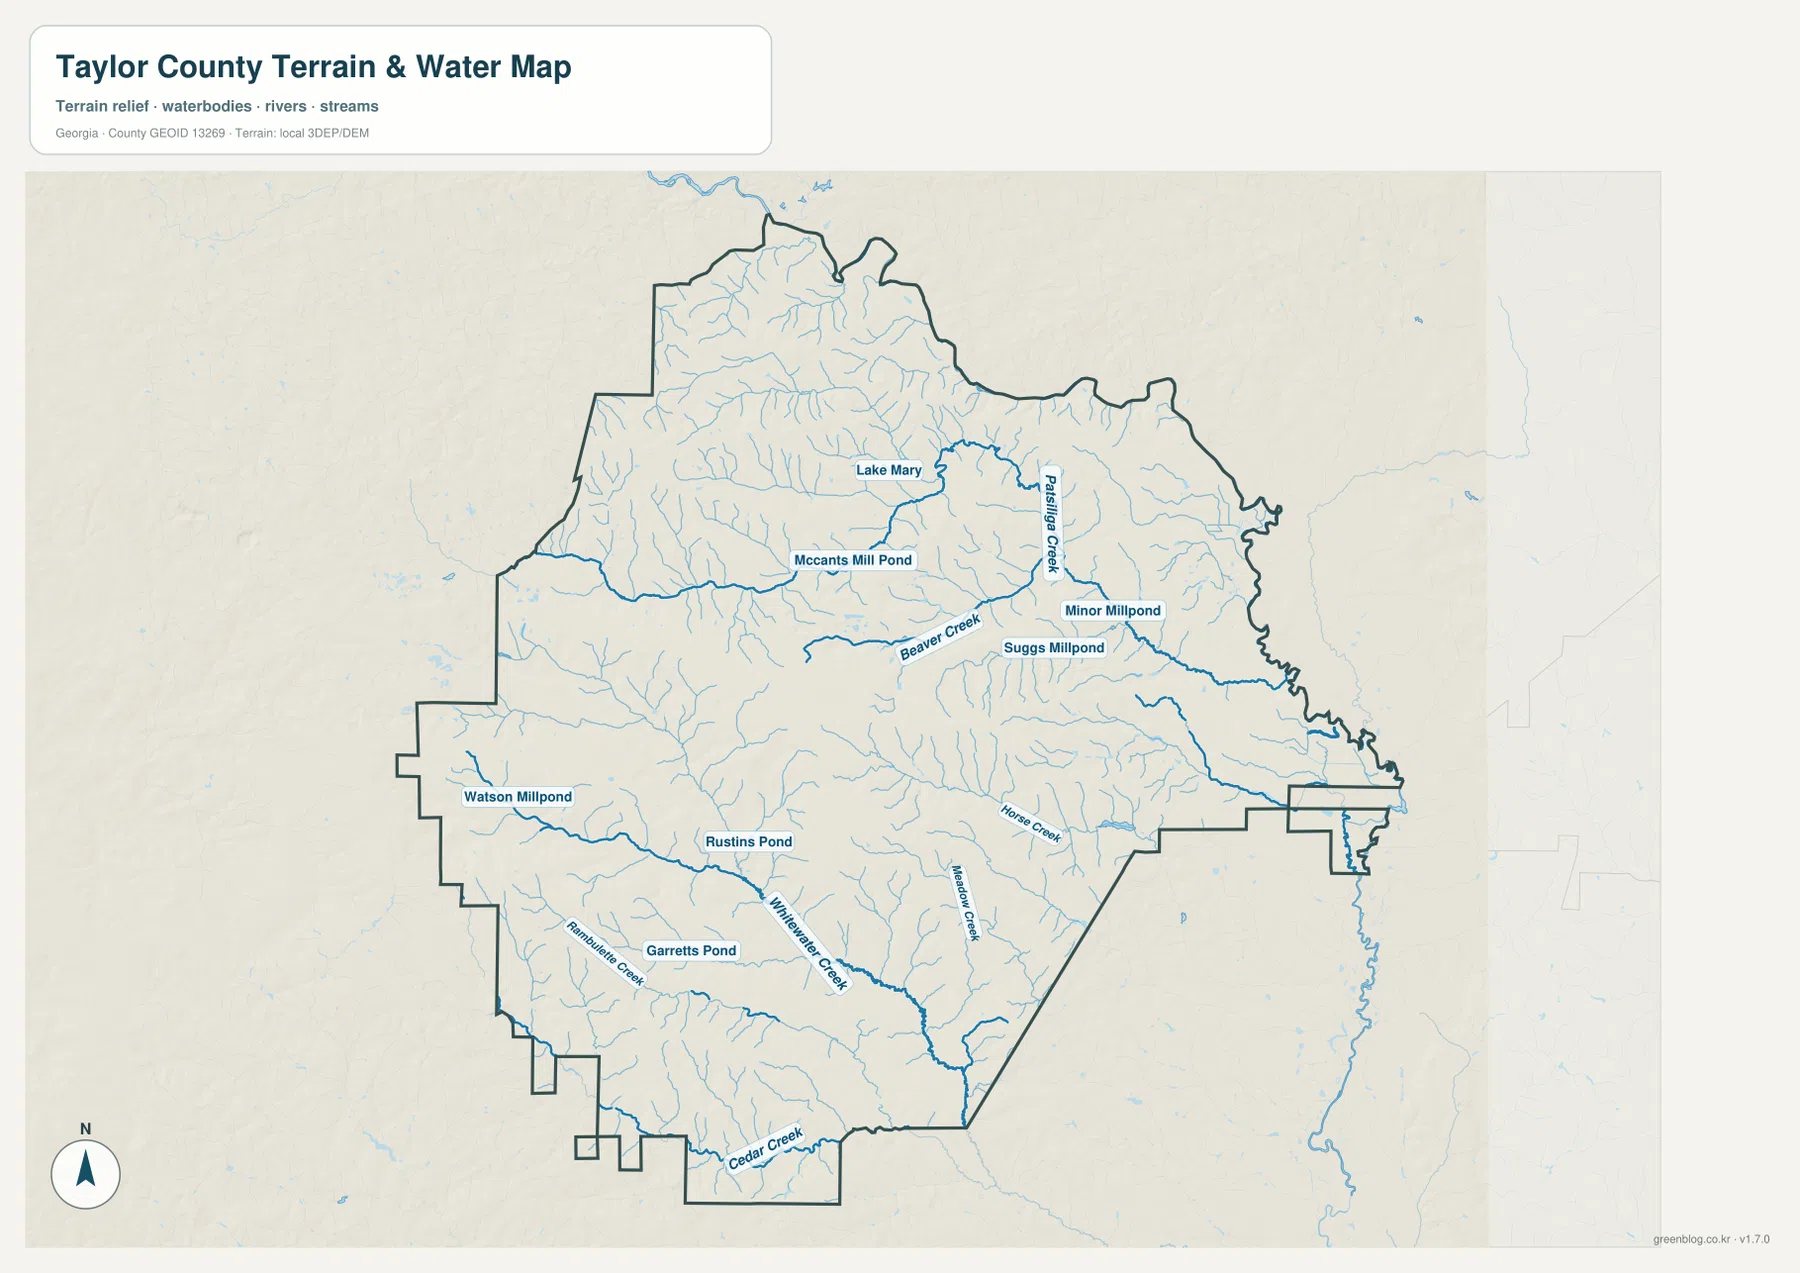
Named waterbodies are scattered rather than concentrated in one large lake. Lake Mary and McCants Mill Pond sit in the northern half, with Minor Millpond and Suggs Millpond near the Patsiliga and Beaver Creek system. Watson Millpond, Rustins Pond, and Garretts Pond appear farther west and southwest. This distribution gives Taylor County a landscape of small stream corridors and impounded ponds instead of one dominant waterbody.
The stream network also helps explain the terrain. Thin tributaries repeatedly occupy narrow low ground between ridges, and the larger named creeks collect those smaller branches. This map is useful for understanding where watercourses are located and how they fit the landform, but it is not a flood-hazard or legal water-boundary map. Flood zones, wetlands regulation, or property-level drainage questions require the appropriate official data.
Elevation from 89 to 246 meters separates western ridges from eastern low ground
The elevation map shows an actual range of about 89 to 246 meters, with a mean elevation of 157 meters. The darkest browns and warm tan colors are concentrated in the west and west-central parts of Taylor County, where short ridges rise above nearby drainage lines. The east and northeast contain more green, indicating lower terrain, and the narrow eastern extension is especially low compared with the interior hills.
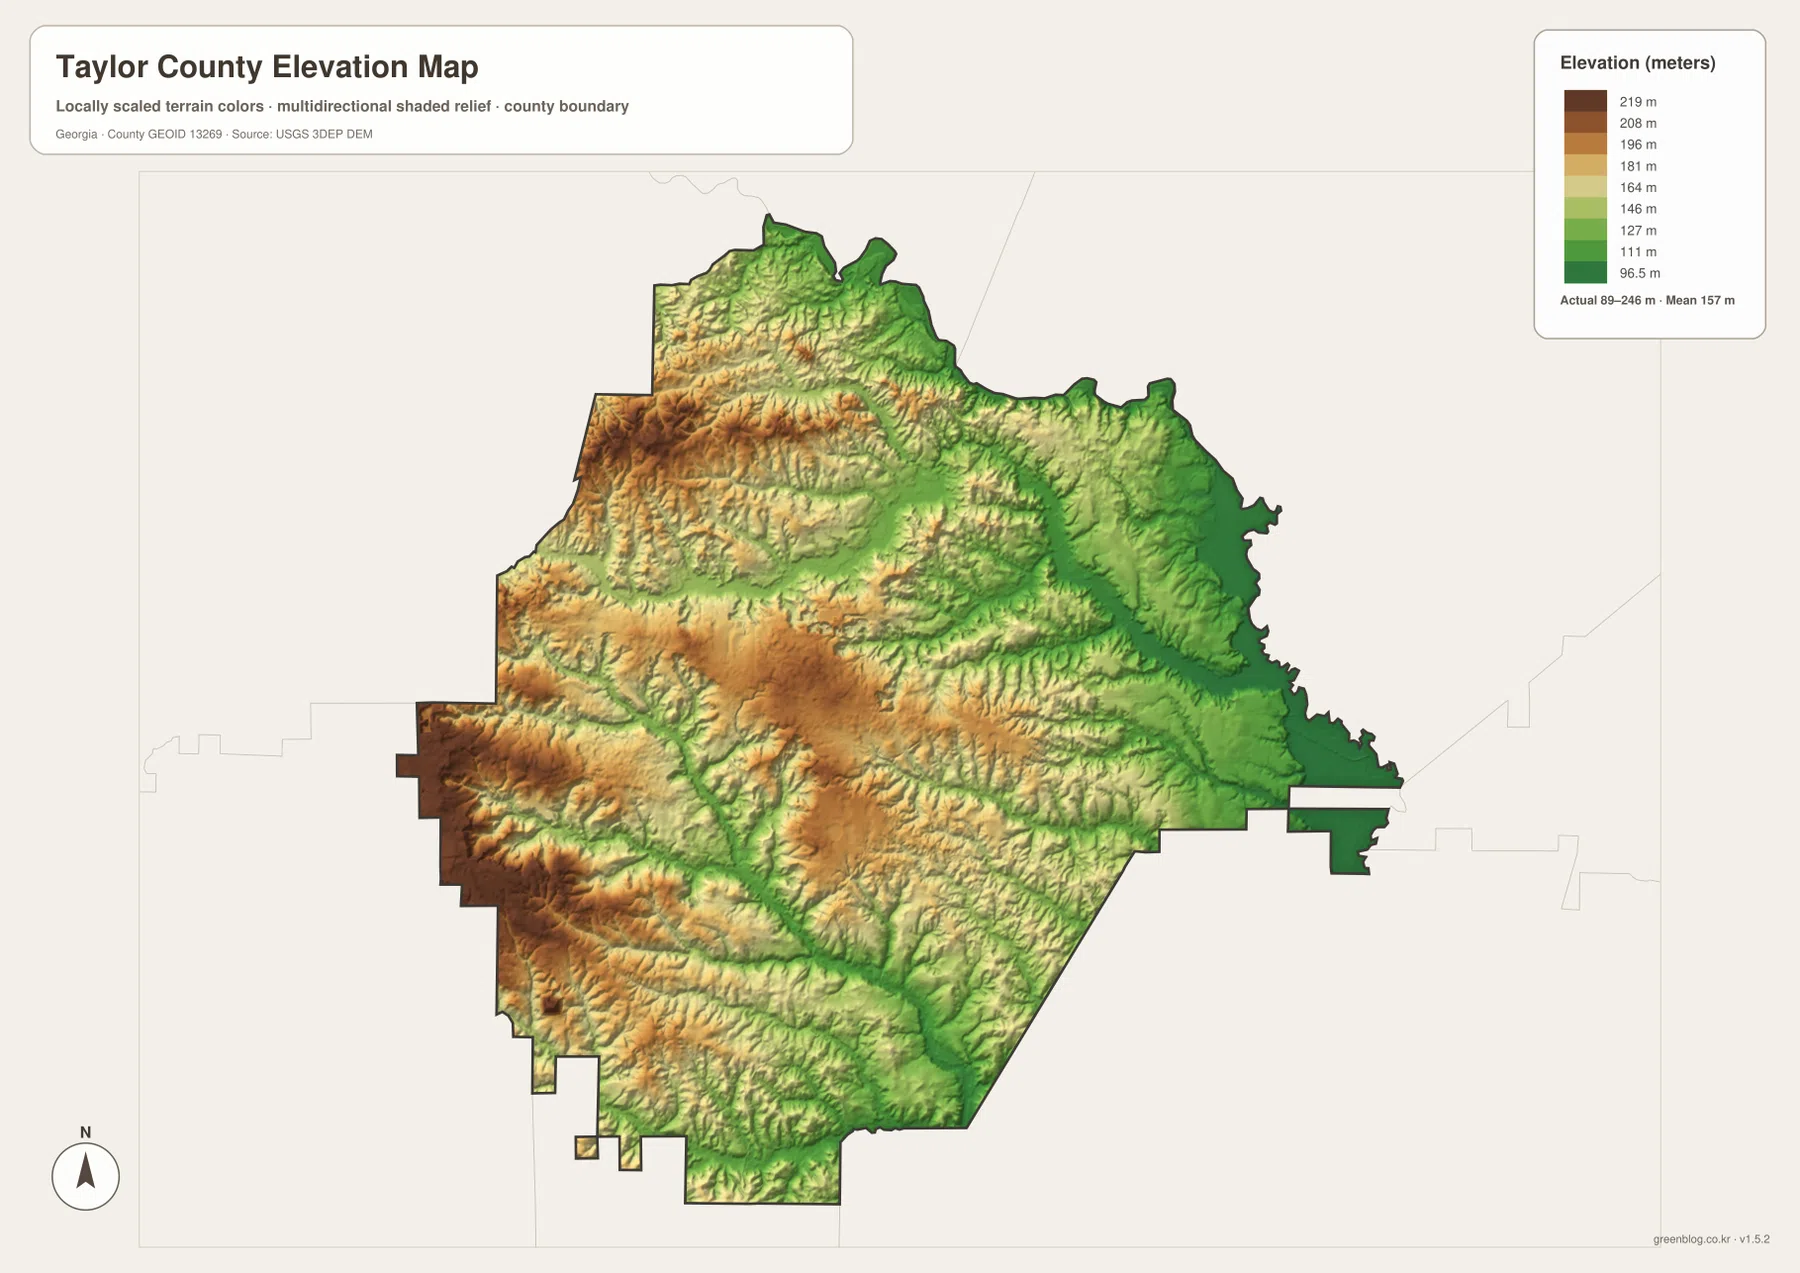
The interior is not a flat plateau. Narrow green lines cut between higher areas, matching the drainage paths visible on the water map. Whitewater Creek and other streams follow these lower corridors, while higher ground separates neighboring watersheds. The change from west to east is gradual and broken by many small ridges rather than one single slope.
Taylor County therefore has meaningful local relief even though it is not a mountain county. A road-only map can make the area between Butler and Reynolds look relatively simple, but the elevation layer reveals a textured surface of ridges and valleys. That difference matters when the goal is to describe the physical landscape rather than simply locate a town or highway.
A practical way to move from roads to towns, water, and relief
For a quick geographic overview, begin with the general county map and locate Butler, Reynolds, Route 3, and Route 96. Then use the city map to reduce the settlement pattern to the two ranked centers. The water map adds the creek systems and ponds that fill the rural spaces between those places. Finally, the elevation map explains why the streams follow narrow low corridors and why western Taylor County appears more rugged than the east.
- Use the county reference map for the boundary, Butler, Reynolds, and the main numbered roads.
- Use the city map when the main question is the relative position of Butler and Reynolds.
- Use the water map for Patsiliga Creek, Beaver Creek, Whitewater Creek, Cedar Creek, ponds, and tributaries.
- Use the elevation map to compare the 89–246 m relief and the contrast between western ridges and eastern low ground.
The maps can also be combined in a report, classroom activity, local-history project, or general county reference. The web images are designed for quick viewing, while the downloadable A3 JPG set is better when a larger image is needed for printing or closer inspection. Each map uses the same county boundary but emphasizes a different set of features, so choosing the right one depends on the question being asked.
Frequently Asked Questions
How can I tell Butler and Reynolds apart on the maps?
Butler is near the center of the county where Routes 3 and 96 meet, while Reynolds is farther east along Route 96. The city map highlights both as the two ranked major cities, making their relative positions easy to compare.
Where is the higher ground in Taylor County?
The elevation map places much of the higher terrain in the west and west-central parts of the county. The mapped elevation range is about 89 to 246 meters, with a mean of 157 meters, while the east and creek valleys are generally lower.
What files are included in the Taylor County download ZIP?
The archive contains four high-resolution A3 JPG files: the county reference map, city map, water map, and elevation map. The images shown in the article are lighter WEBP previews for faster page loading.
Sources and Reference Data
The following external sources can be used to check county background information and the boundary, hydrography, and elevation data used for mapping.
- U.S. Census Bureau QuickFacts for Taylor County
- New Georgia Encyclopedia entry for Taylor County
- USGS National Hydrography
- USGS 3D Elevation Program
Map File Information
The ZIP contains four high-resolution A3 JPG maps of Taylor County: a county reference map, city map, water map, and elevation map. Use these files when you need larger images than the WEBP previews shown on the page.
- Included Versions: County, city, water, and elevation
Related Maps
Green Map creates custom-edited map images using open geographic data sources such as geoBoundaries, Natural Earth, OpenStreetMap, and government open data. These maps are edited visual materials, not raw data files, and are provided for education, documents, presentations, and graphic reference.