The Jefferson County New York Land Cover Map brings together a landscape where agriculture and forest occupy nearly equal shares, while wetlands, open water, and developed areas add strong local contrasts. In the 2025 summary, agriculture accounts for 36.19% of the county and forest for 34.52%. Wetlands cover 12.65%, developed land 9.60%, and water 5.14%, so no single category explains the county by itself.
Four views are included on this page: general land cover, forest and farmland, impervious surface and developed land, and mapped class differences from 1985 to 2025. The WebP images are convenient for browsing, while the four original JPG maps are available together in one ZIP download for printing, teaching, presentations, and map-based reference work.
Table of Contents
A county where farm country and woodland share the map
Jefferson County stands out because its two largest cover groups are close in size but arranged differently. Agriculture spreads across broad western, southwestern, and central areas, often forming large open patches. Forest is more continuous in parts of the east and southeast and also appears between agricultural areas elsewhere. That contrast is more useful than the percentages alone because it shows where each cover type shapes the visible landscape.
Wetlands are also a major part of the pattern. At 12.65%, they appear around water, between forest and farmland, and across several northern and eastern areas. Open water contributes another 5.14%. Large blue areas along the western side and interior lakes break up the otherwise land-dominated map and make the county’s water-rich setting immediately visible.
Developed cover is smaller at 9.60%, yet it is easy to locate because it forms compact red concentrations and thinner connecting lines rather than a broad blanket. Land cover should not be confused with zoning or ownership. These categories describe the surface seen and classified from remotely sensed data; they do not tell a reader who owns a parcel, what a parcel is legally zoned for, or whether development is permitted.
Reading the 2025 land cover map
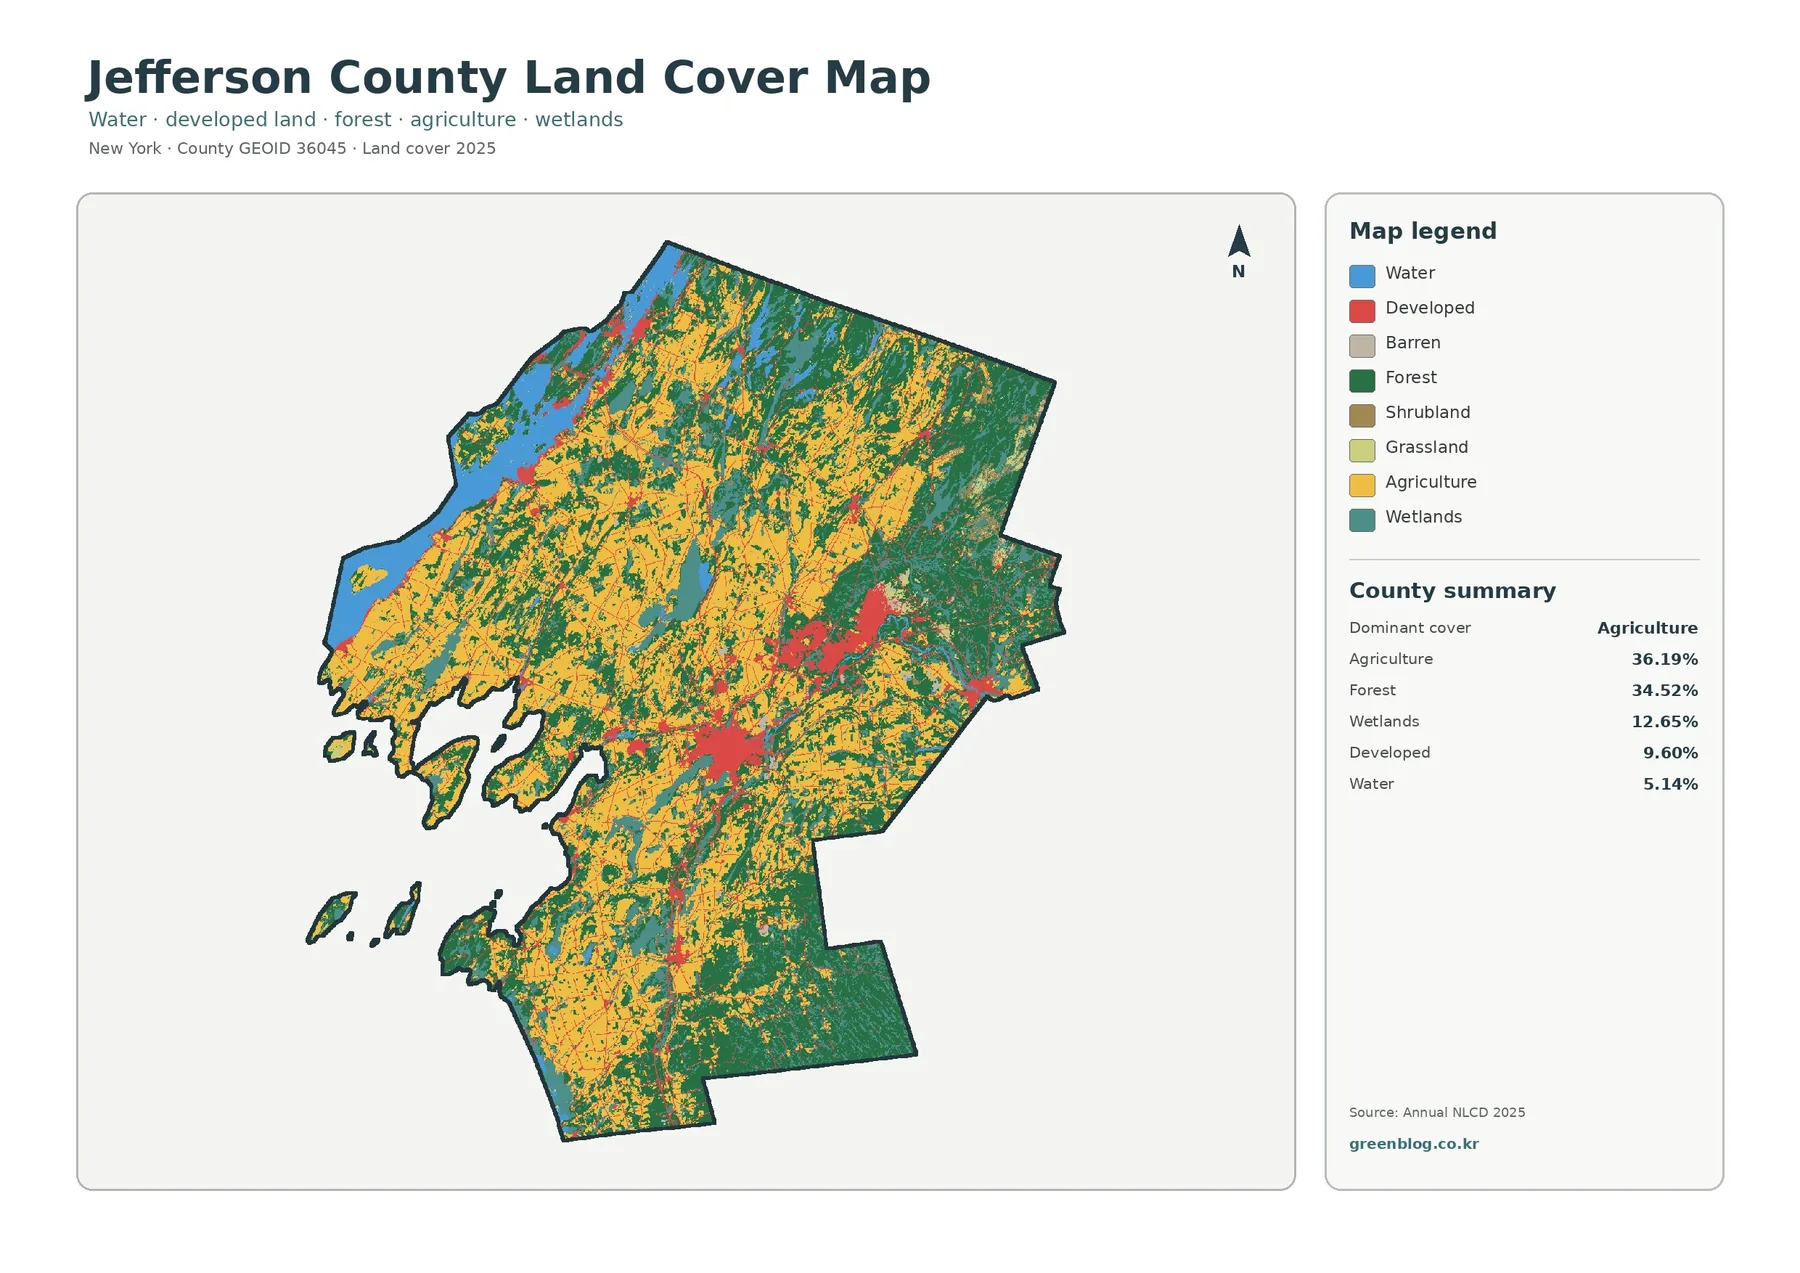
The general map is the best place to begin because all major classes can be compared at once. Agriculture is especially prominent through the western and central portions, while forest becomes more extensive toward the east and southeast. Wetland colors weave through both settings, and open water forms a conspicuous edge and several interior features. Developed areas are concentrated rather than evenly distributed.
This mix prevents the county from reading as either purely agricultural or primarily forested. A reader can move from large farm-dominated patches into wooded areas without crossing a simple straight boundary. Wetlands and smaller water features interrupt both, creating a more complex pattern than the headline percentages suggest.
The legend groups water, developed land, barren land, forest, shrubland, grassland, agriculture, and wetlands. Small pixels or patches should not be interpreted as surveyed property boundaries. Land-cover products use raster cells, meaning the landscape is divided into a grid and each cell receives a class. Along forest edges, wetlands, and mixed rural areas, one cell may contain more than one real-world surface even though the map must assign a single category.
Forest and farmland become clearer when other classes are simplified
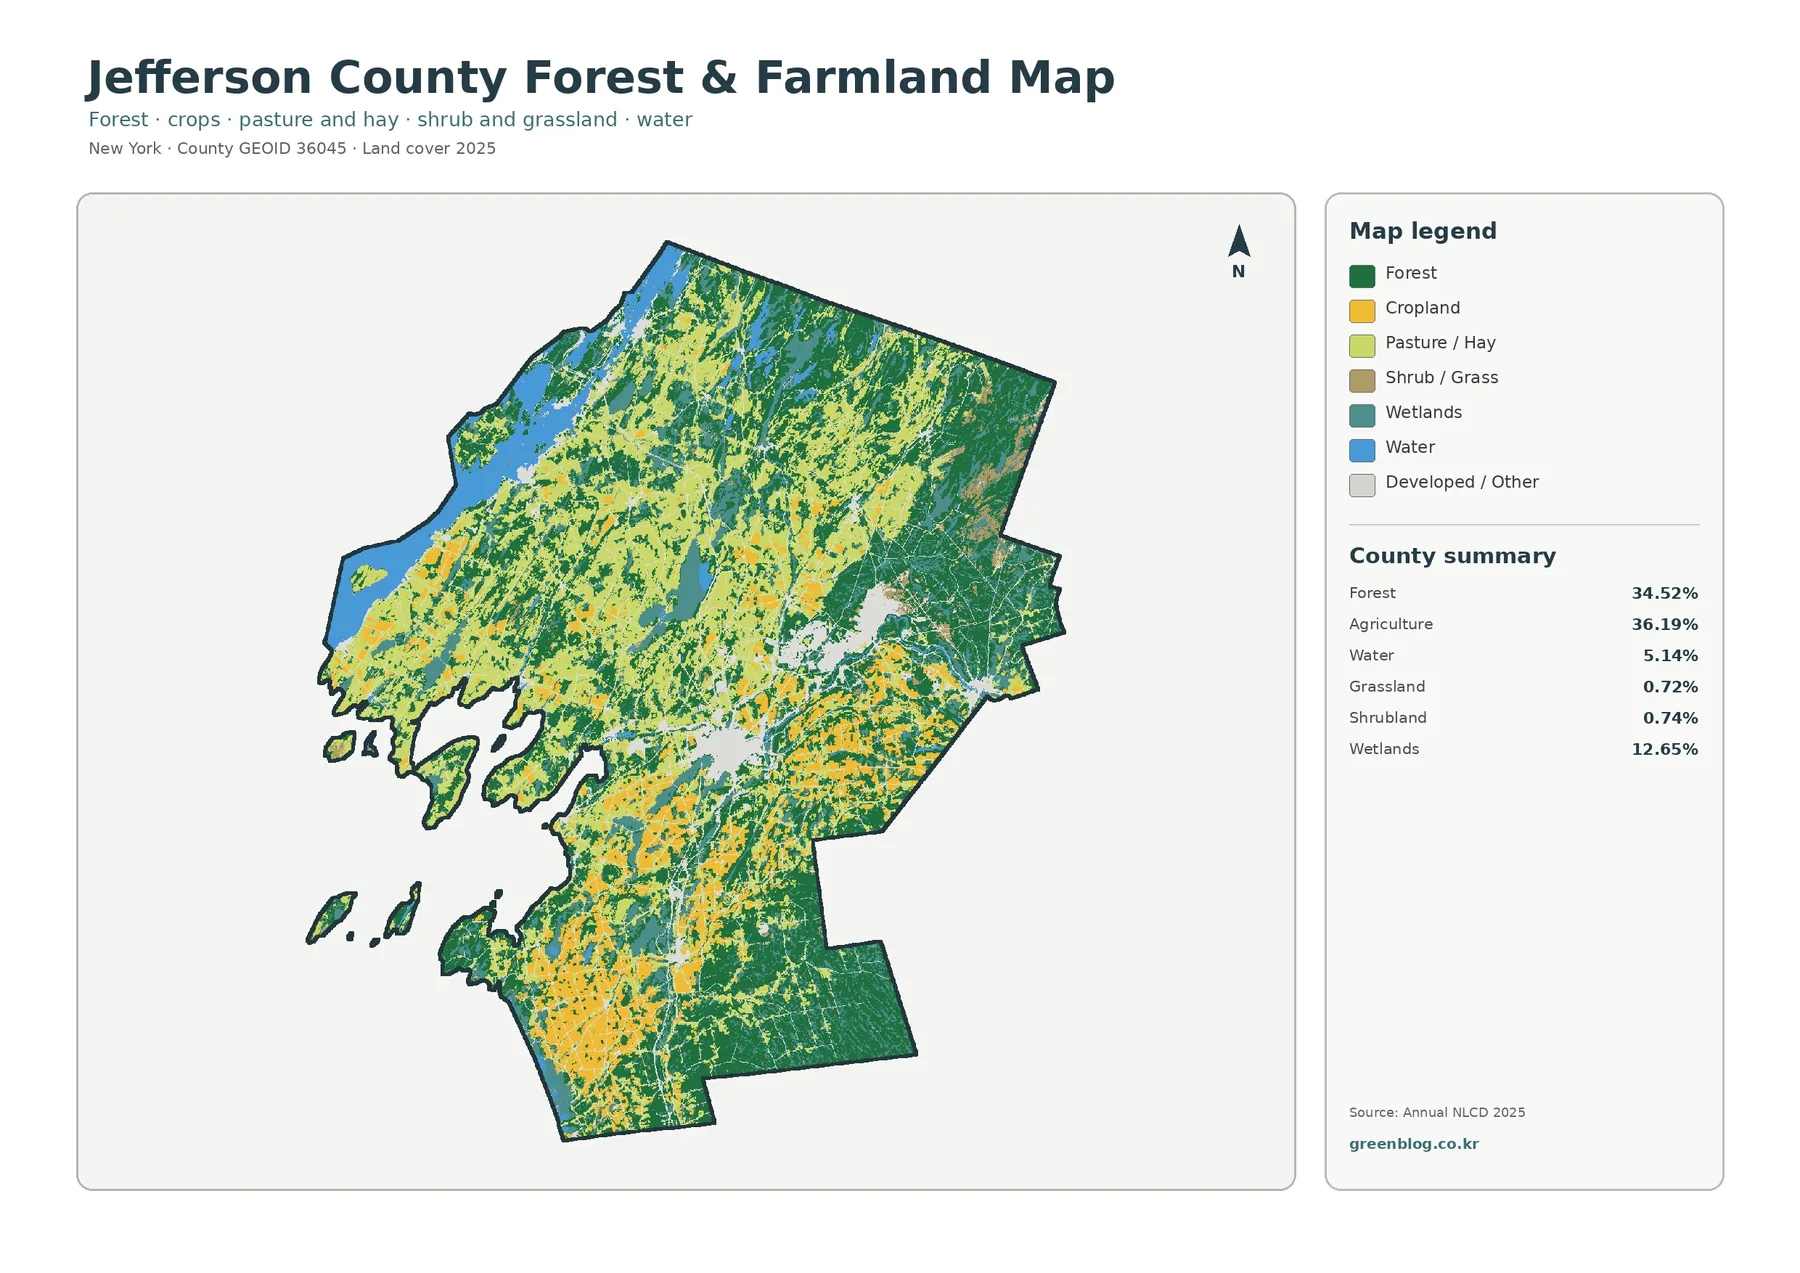
A simplified forest-and-farmland view makes the near balance between agriculture and forest easier to see. Agriculture totals 36.19%, while forest totals 34.52%. The agricultural pattern is broad across western and southwestern Jefferson County and continues into central areas. Forest occupies larger continuous tracts in the east and southeast, with smaller wooded areas mixed through farm country.
The map also separates cropland from pasture and hay, which helps readers see that the agricultural category is not visually uniform. Those subgroups are useful for regional comparison, but they should not be treated as field-by-field farm records. Individual operations, crop types, and property lines require more detailed agricultural or parcel data.
Water and wetlands remain visible instead of being removed from this view. That choice matters because 12.65% wetland cover and 5.14% water influence how farm and forest areas are arranged. Around the western water edge and several interior features, the surrounding cover differs from the broader inland farm pattern. The map therefore works well for comparing land-cover context rather than only counting acreage.
Impervious surface reveals where development is concentrated
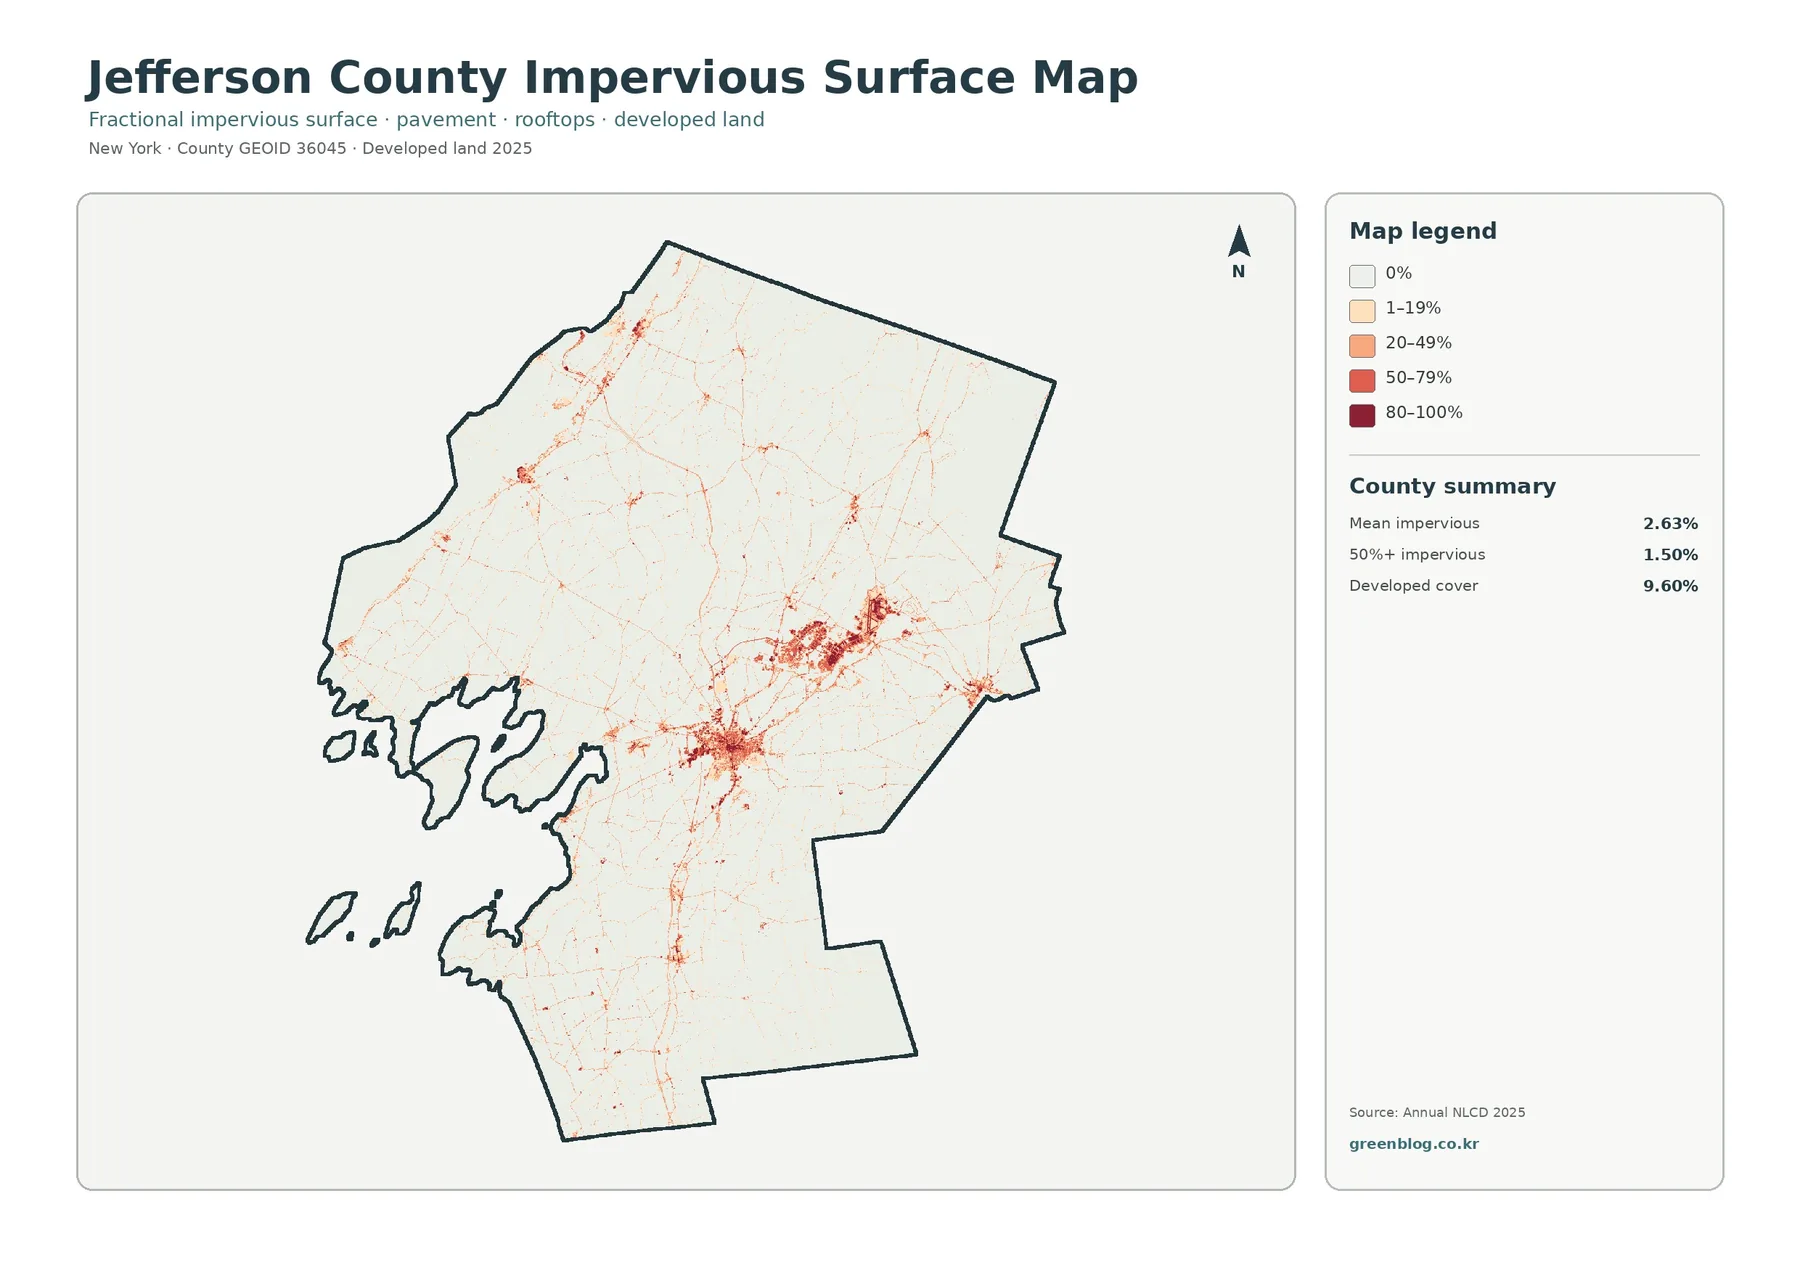
Impervious surface means pavement, rooftops, parking areas, and other surfaces that do not readily absorb rainfall. Jefferson County’s mean impervious value is 2.63%, while 1.50% of the mapped area reaches at least 50% impervious cover. Developed land accounts for 9.60% in the general land-cover summary, which is consistent with a county where dense built surfaces occupy limited areas rather than most of the landscape.
On this map, the strongest red and orange concentrations form around several central and eastern settlement areas. Thin lines extend outward along travel corridors, while most of the county remains pale. The map shows development and roads occupying many of the same corridors, but that spatial association should not be turned into a claim that one caused the other.
The graduated legend is useful because a place classified as developed on the general land-cover map can still vary greatly in how much of each cell is paved or built. Values of 1–19%, 20–49%, 50–79%, and 80–100% separate low-intensity areas from more heavily sealed surfaces. For watershed or runoff discussions, that distinction can be more informative than a single developed-land color.
What the 1985–2025 class-difference map does—and does not—show
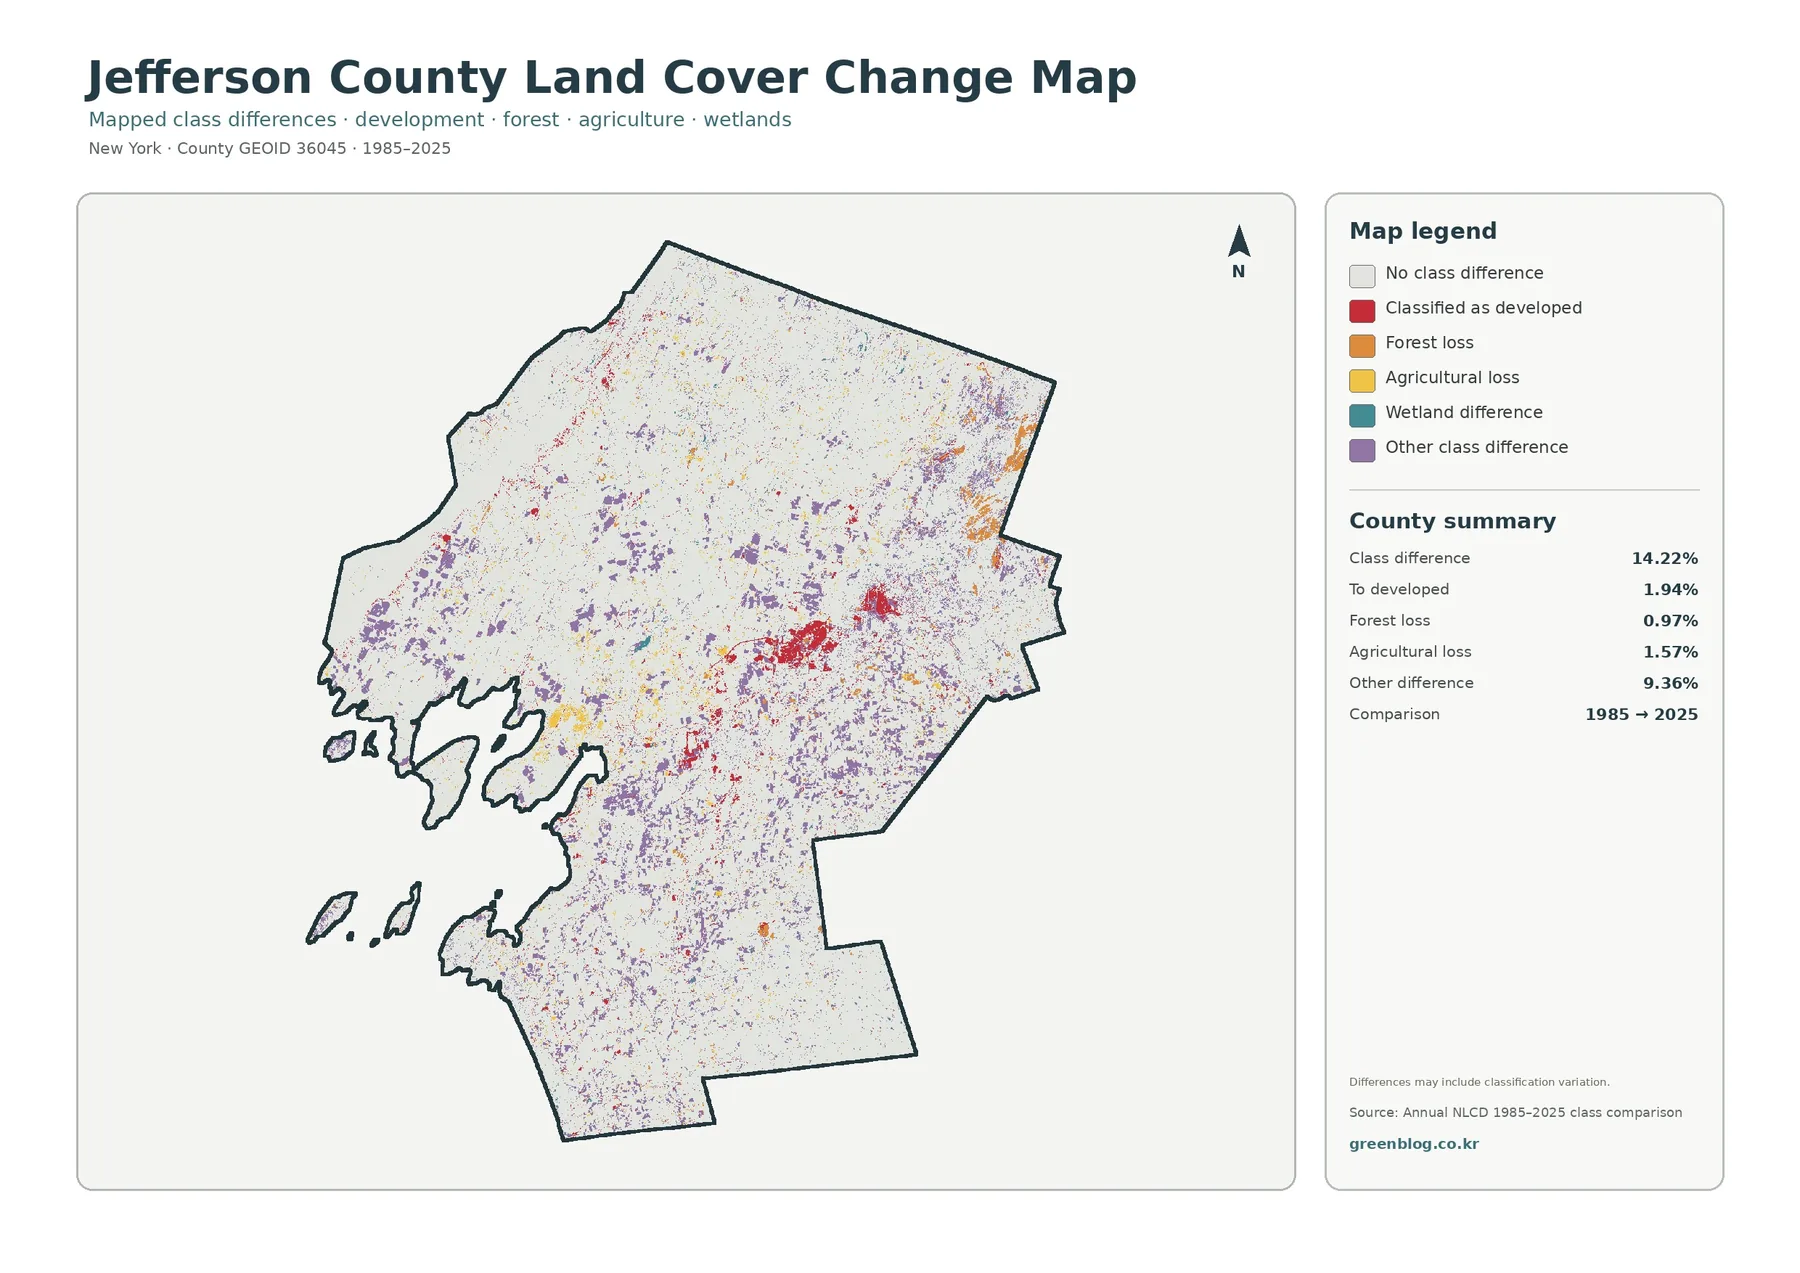
The comparison map reports a class difference for 14.22% of the county between 1985 and 2025. Areas classified as developed account for 1.94% of the difference, forest loss for 0.97%, agricultural loss for 1.57%, and other class differences for 9.36%. Most of the map remains in the no-difference category.
Red change patches are noticeable near established developed concentrations and their surroundings. Purple and other colors appear more widely as smaller scattered patches, while orange and yellow differences occur in several locations rather than one single zone. This view is useful for locating where mapped categories differ between the two comparison years.
A class difference is not automatically proof of a specific land-use event. Real surface change can contribute, but classification methods, mixed pixels, seasonal conditions, and data characteristics can also affect a cell’s label. The map itself notes that differences may include classification variation, so small isolated patches deserve cautious interpretation.
Choosing the right map for a question
For a quick county-wide overview, start with the general land-cover map. It establishes the broad balance among agriculture, forest, wetlands, water, and development. Move to the forest-and-farmland map when the main question concerns rural land patterns. Use the impervious map when hard surfaces, settlement intensity, or runoff context matter, and finish with the change map when comparing the two mapped years.
Using the four maps together is especially effective in a classroom or presentation. The same location can be followed from a broad cover class to a forest-or-farm emphasis, then to impervious intensity, and finally to mapped change. That comparison teaches more than treating each image as a separate illustration because it shows how different datasets answer different parts of the same geographic question.
Download the four original JPG maps
The downloadable ZIP contains the four original JPG maps shown on this page: general land cover, forest and farmland, impervious surface and developed land, and the 1985–2025 class-difference map. The larger JPG files are better suited than the WebP previews for printing, slide decks, worksheets, and offline map comparison.
Limits to keep in mind before using the maps
Land-cover data generalize the ground into raster cells, so narrow roads, small buildings, tiny wetlands, and parcel boundaries may not appear at their real-world size. A mixed pixel can contain more than one surface type, yet the final land-cover layer still needs to assign a representative class. Enlarging the image does not create new survey-level detail.
The 2025 map is a snapshot of a classified dataset, not a live view of current construction or farming conditions. The 1985–2025 comparison is likewise a classification comparison rather than a record of permits, ownership changes, or the reason a site changed. Readers who need current zoning, parcel, or project information should consult the relevant local and county records.
Frequently Asked Questions
What is the largest land-cover category in Jefferson County?
Agriculture is the largest category in the supplied 2025 summary at 36.19%. Forest is close behind at 34.52%, so the county is best understood as a mix of extensive farm country and woodland rather than as a landscape dominated by only one of those classes.
What files are included in the download?
The ZIP contains four original JPG maps: general land cover, forest and farmland, impervious surface and developed land, and mapped land-cover class differences from 1985 to 2025. The WebP versions in the article are intended mainly for fast on-page preview.
Can this map be used to determine zoning or parcel development rights?
No. Land cover describes the mapped surface, not legal land use, zoning, ownership, or development rights. Parcel-level decisions require official local planning, zoning, and property records.
Map File Information
Jefferson County Land Cover Map Files
- Included Files: Use only the versions confirmed in the article and supplied images
- File Type: Use the confirmed download contents
- Intended Use: Printing, education, presentations, and map-based projects
Related Maps
- Albany County Land Cover Map
- Allegany County New York Land Cover Map
- Bronx County New York Land Cover Map
Sources and reference data
The map set relies on standard national land-cover and boundary sources. The official pages below provide the underlying data access, classification definitions, and geographic boundary references needed to understand the map framework.
- MRLC Annual NLCD Data
- USGS Annual NLCD Land Cover Classification
- U.S. Census Bureau TIGER/Line Shapefiles
Green Map creates custom-edited map images using open geographic data sources such as geoBoundaries, Natural Earth, OpenStreetMap, and government open data.
These maps are edited visual materials, not raw data files, and are provided for education, documents, presentations, and graphic reference.