Download four high-resolution A3 JPG maps of Atkinson County in one ZIP, with matching WEBP previews available on this page. The maps cover the county boundary and roads, the positions of Pearson and Willacoochee, major waterways, and the county’s low Coastal Plain elevation. Pearson sits near the center of the county, Willacoochee is close to the western side, and Route 82 links them across a largely rural landscape with Axson farther east.
Each view is designed for a different question rather than repeating the same information. Start with the general county map when you need roads, nearby communities, and the outline of Atkinson County; use the city view to compare Pearson and Willacoochee without extra detail. The water map brings the Alapaha and Satilla drainage areas and named creeks forward, while the elevation view shows the county’s modest changes in height. The on-page previews make it easy to choose the most useful map before using the downloadable JPG files for printing, lessons, reports, or reference work.
Table of Contents
Pearson as the road-and-boundary reference point
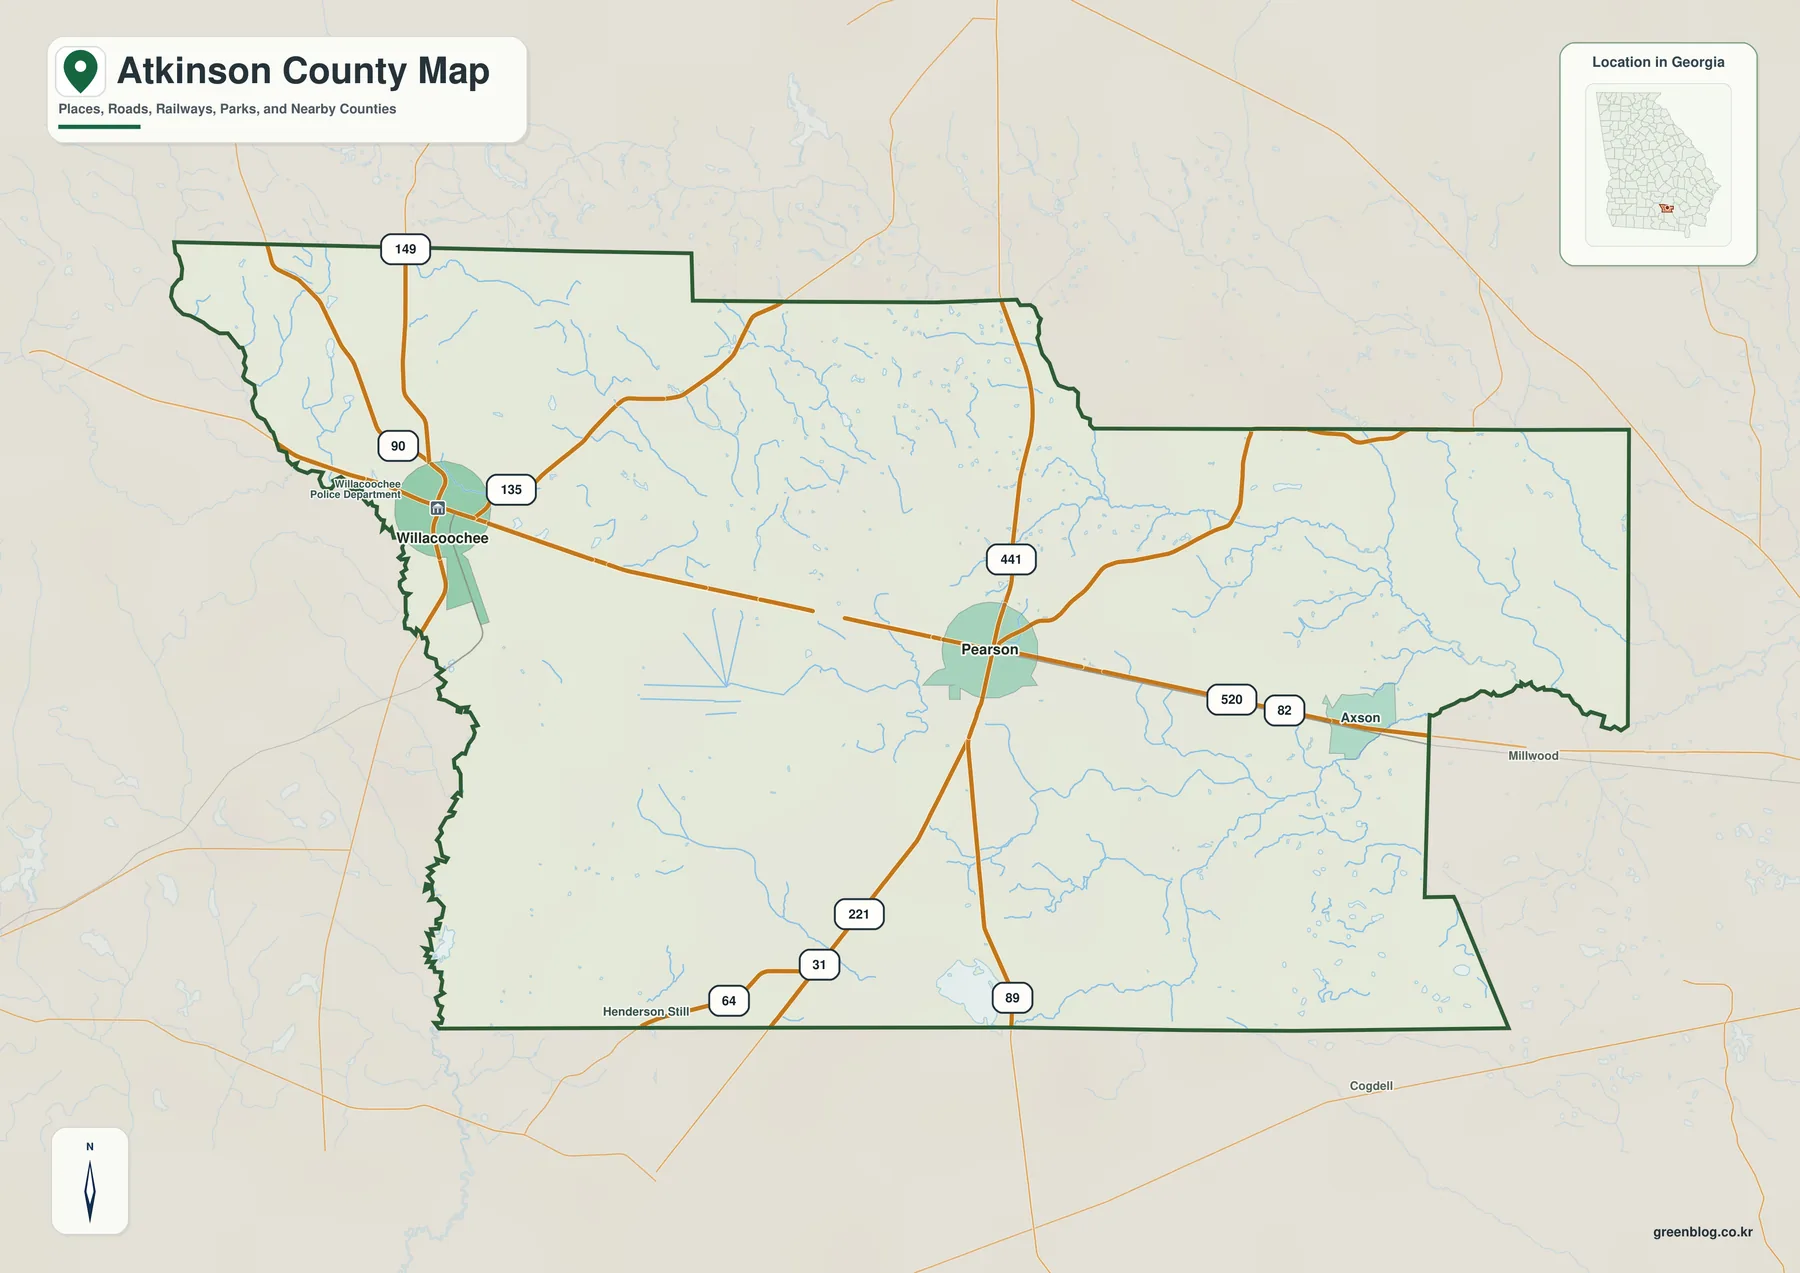
The general map is the quickest place to learn the county’s overall shape. Pearson is the most useful orientation point because several numbered routes meet in and around the city. The map shows Route 82 extending east and west through Pearson, with the road continuing toward Willacoochee in the west and Axson in the east. North of Pearson, 441 is labeled; routes marked 221, 31, 64, and 89 appear to the south and southwest. Around Willacoochee, the map includes 90, 135, and 149. These labels are useful not because a reader needs to memorize every route number, but because they show how the two main towns connect with the much larger rural area around them.
The boundary itself is irregular enough to be worth noticing. The northern edge contains several step-like changes, the western side follows a more uneven line, and the eastern and southeastern edges include large bends rather than a simple rectangle. Pale-blue streams cross much of the interior, so areas that look empty when attention is focused only on roads are actually divided by many small waterways. The map is appropriate for countywide orientation, but it should not be treated as a parcel, zoning, legal-boundary, or turn-by-turn navigation product. Those tasks require current records from the responsible agency.
| State | Georgia |
|---|---|
| County seat | Pearson |
| Incorporated cities | Pearson and Willacoochee |
| Other principal communities | Axson and Kirkland |
| County created | 1917 |
| 2020 population | 8,286 |
| 2020 land area | 342.72 square miles |
| 2020 population density | 24.2 people per square mile |
| Elevation-map range | about 34–92 m; mean 61 m |
| Download package | four high-resolution A3 JPG files in one ZIP |
The 2020 figures help explain the visual scale of the map. A population of 8,286 spread across 342.72 square miles of land equals about 24.2 people per square mile. That is consistent with a county in which small urban areas around Pearson and Willacoochee are separated by broad stretches of forest, farms, wetlands, streams, and lightly settled roads. The table therefore adds context to what the map already suggests: the named cities matter, but most of Atkinson County is rural rather than continuously developed.
Pearson and Willacoochee in a two-city county
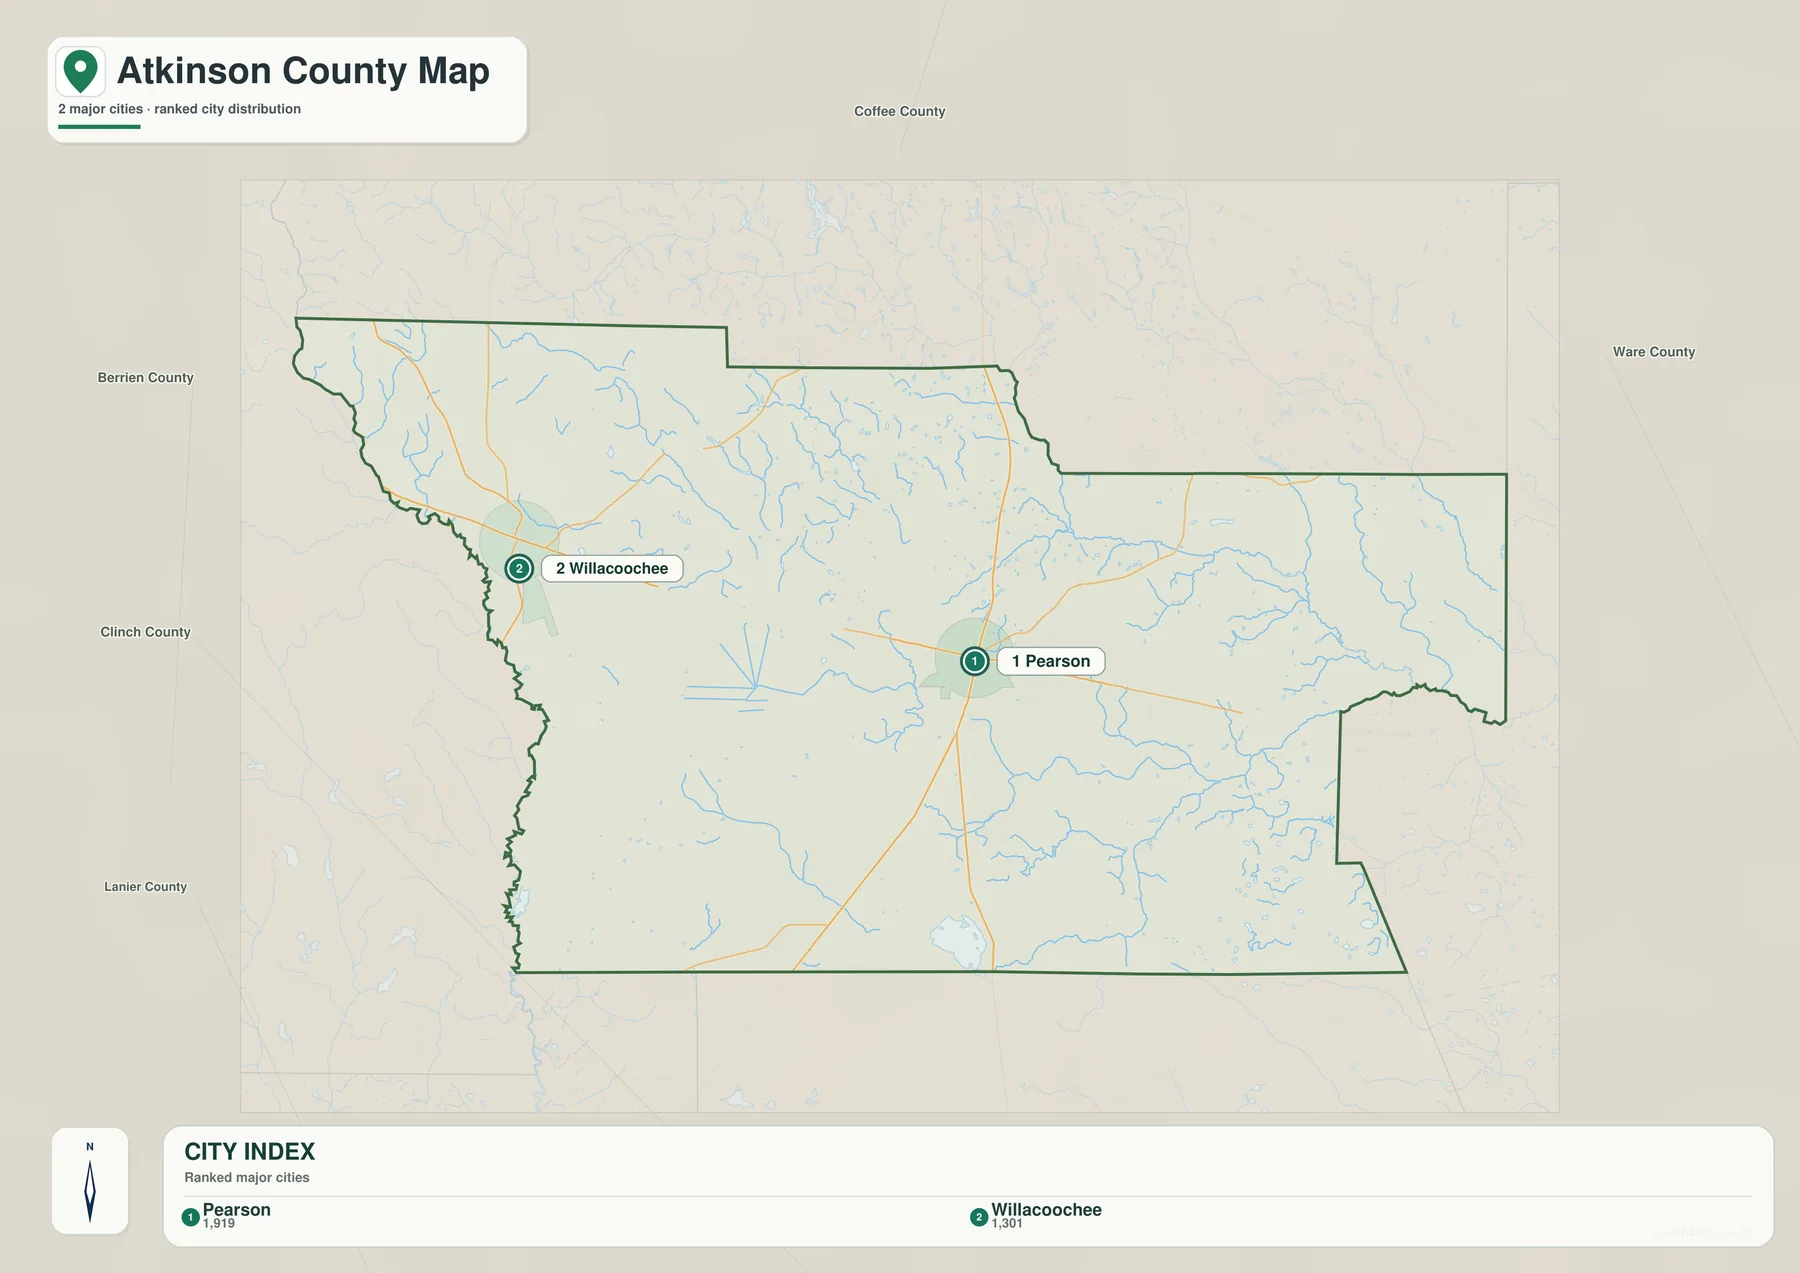
The city map removes most of the road labels so that the settlement pattern is immediately clear. Pearson is marked as city 1 and Willacoochee as city 2. The CITY INDEX at the bottom of the supplied preview lists Pearson at 1,919 and Willacoochee at 1,301. The map does not need many labels to make its point: Pearson is closer to the center of the county, while Willacoochee is positioned near the western boundary. Once those two locations are established, it becomes much easier to return to the general map and understand why Pearson works as the countywide reference point and why Willacoochee is the natural reference for the west.
Surrounding county labels add a broader sense of place. Coffee County appears to the north, Berrien County to the west and northwest, Clinch County to the west and southwest, Lanier County farther southwest, and Ware County to the east. Those names are not a substitute for a detailed regional road map, but they show how Atkinson County fits into south Georgia. The current article also identifies Axson east of Pearson and Kirkland west of Pearson as important unincorporated communities. When those places are added mentally to the two-city view, the county looks less like two isolated towns and more like a chain of small communities associated with the east–west travel corridor.
Pearson is especially helpful as an orientation point because it combines the county-seat role with a central road location. From Pearson, a reader can move west toward Willacoochee, east toward Axson, or follow numbered routes north and south toward neighboring counties. Willacoochee, by contrast, sits much closer to the western edge and provides a better starting point for understanding the Berrien and Clinch side of the county. The two places therefore serve different geographic roles even though both are incorporated cities. This distinction is clearer on the maps than it would be in a simple alphabetical list of communities.
For classroom or report use, the city map is often better than the general map when the question is simply where the incorporated towns are located. It eliminates most of the smaller road and stream labels that would compete with the city markers. The general map can then be placed beside it to restore the road network and nearby communities. Using the two maps together lets a reader move from a clean settlement overview to a more detailed transportation view without trying to force every type of information onto one page.
Two drainage directions across Atkinson County
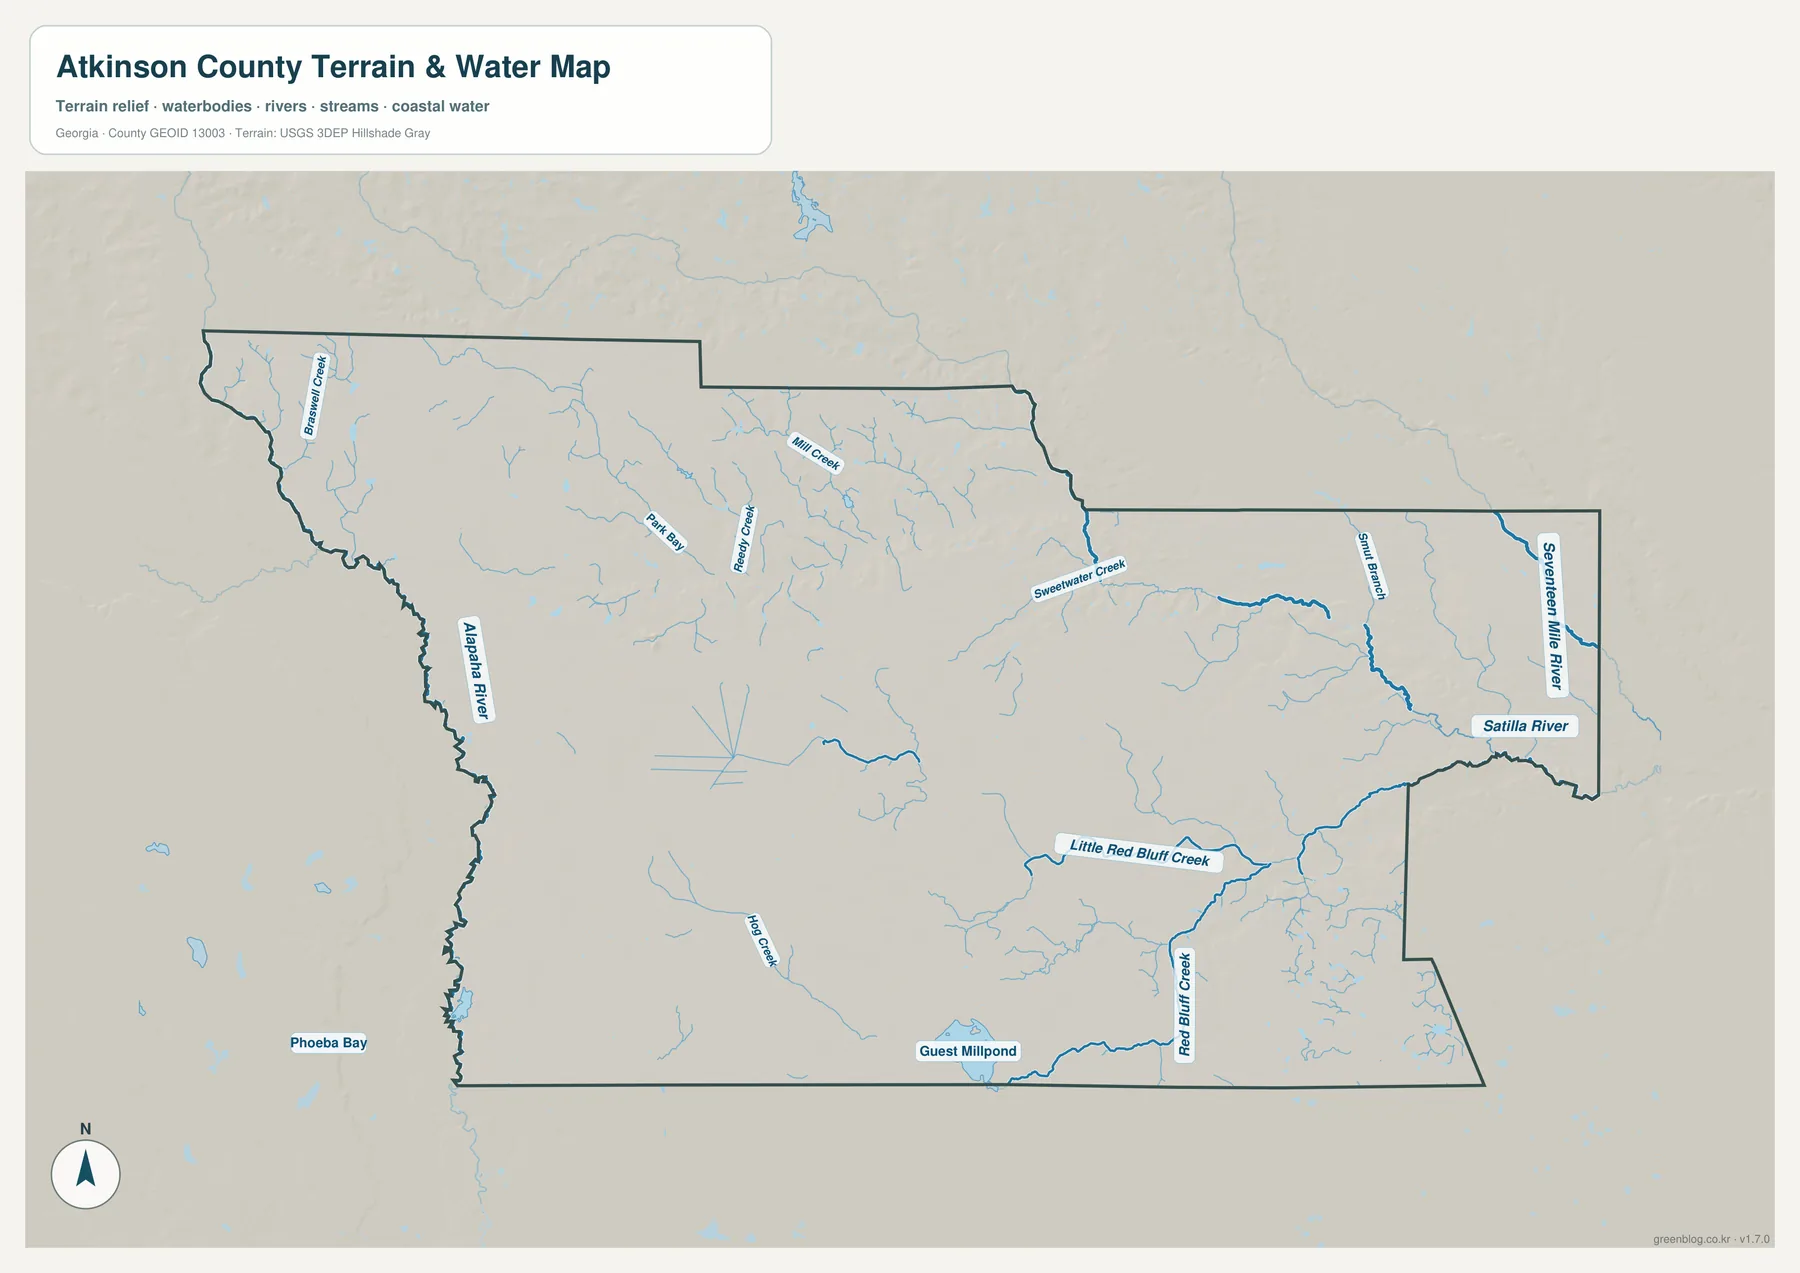
Water gives Atkinson County a second organizing pattern that is very different from the road network. The Alapaha River is labeled along the western side of the map, while the Satilla River appears along the eastern side. Between them are numerous smaller streams, including Sweetwater Creek, Mill Creek, Little Red Bluff Creek, Red Bluff Creek, and Hog Creek. Seventeen Mile River is labeled near the eastern edge, and the map also marks smaller water features such as Guest Millpond in the south and Phoebe Bay outside the southwest side of the county. These names are much easier to follow here than on the general road map because water is the main subject.
The supplied background material explains that most of Atkinson County is associated with the Satilla side, while a narrower western area around Willacoochee belongs to the Alapaha drainage and ultimately the Suwannee system. In everyday terms, water on the far western side of the county follows a different major route from much of the water in the central and eastern parts. That makes Atkinson County a useful example of how a county boundary can cross more than one large watershed. A reader does not need specialist hydrology terminology to see the difference: the two larger rivers sit on opposite sides, and the smaller creeks fill the land between them.
Red Bluff Creek is especially useful because it connects the map with one of the authoritative sources included in the package. The current article identifies a USGS monitoring location near U.S. 82 east of Pearson, and the terrain-and-water map labels both Little Red Bluff Creek and Red Bluff Creek as they extend through the southeastern part of the county. This gives a teacher, local historian, or map user a concrete way to move from a printed image to a public monitoring record without pretending that the static map itself contains current water-level information.
The limitations matter. This map is designed to show river, creek, and waterbody locations at county scale. It does not show safe boating routes, current depth, flood probability, wetland jurisdiction, or property boundaries. Those questions require more specialized and up-to-date sources. For geographic orientation, however, it performs a valuable task: it turns the many pale stream lines seen on the general map into named water features and makes the contrast between the Alapaha and Satilla sides of the county much easier to understand.
Low Coastal Plain relief from 34 to 92 meters
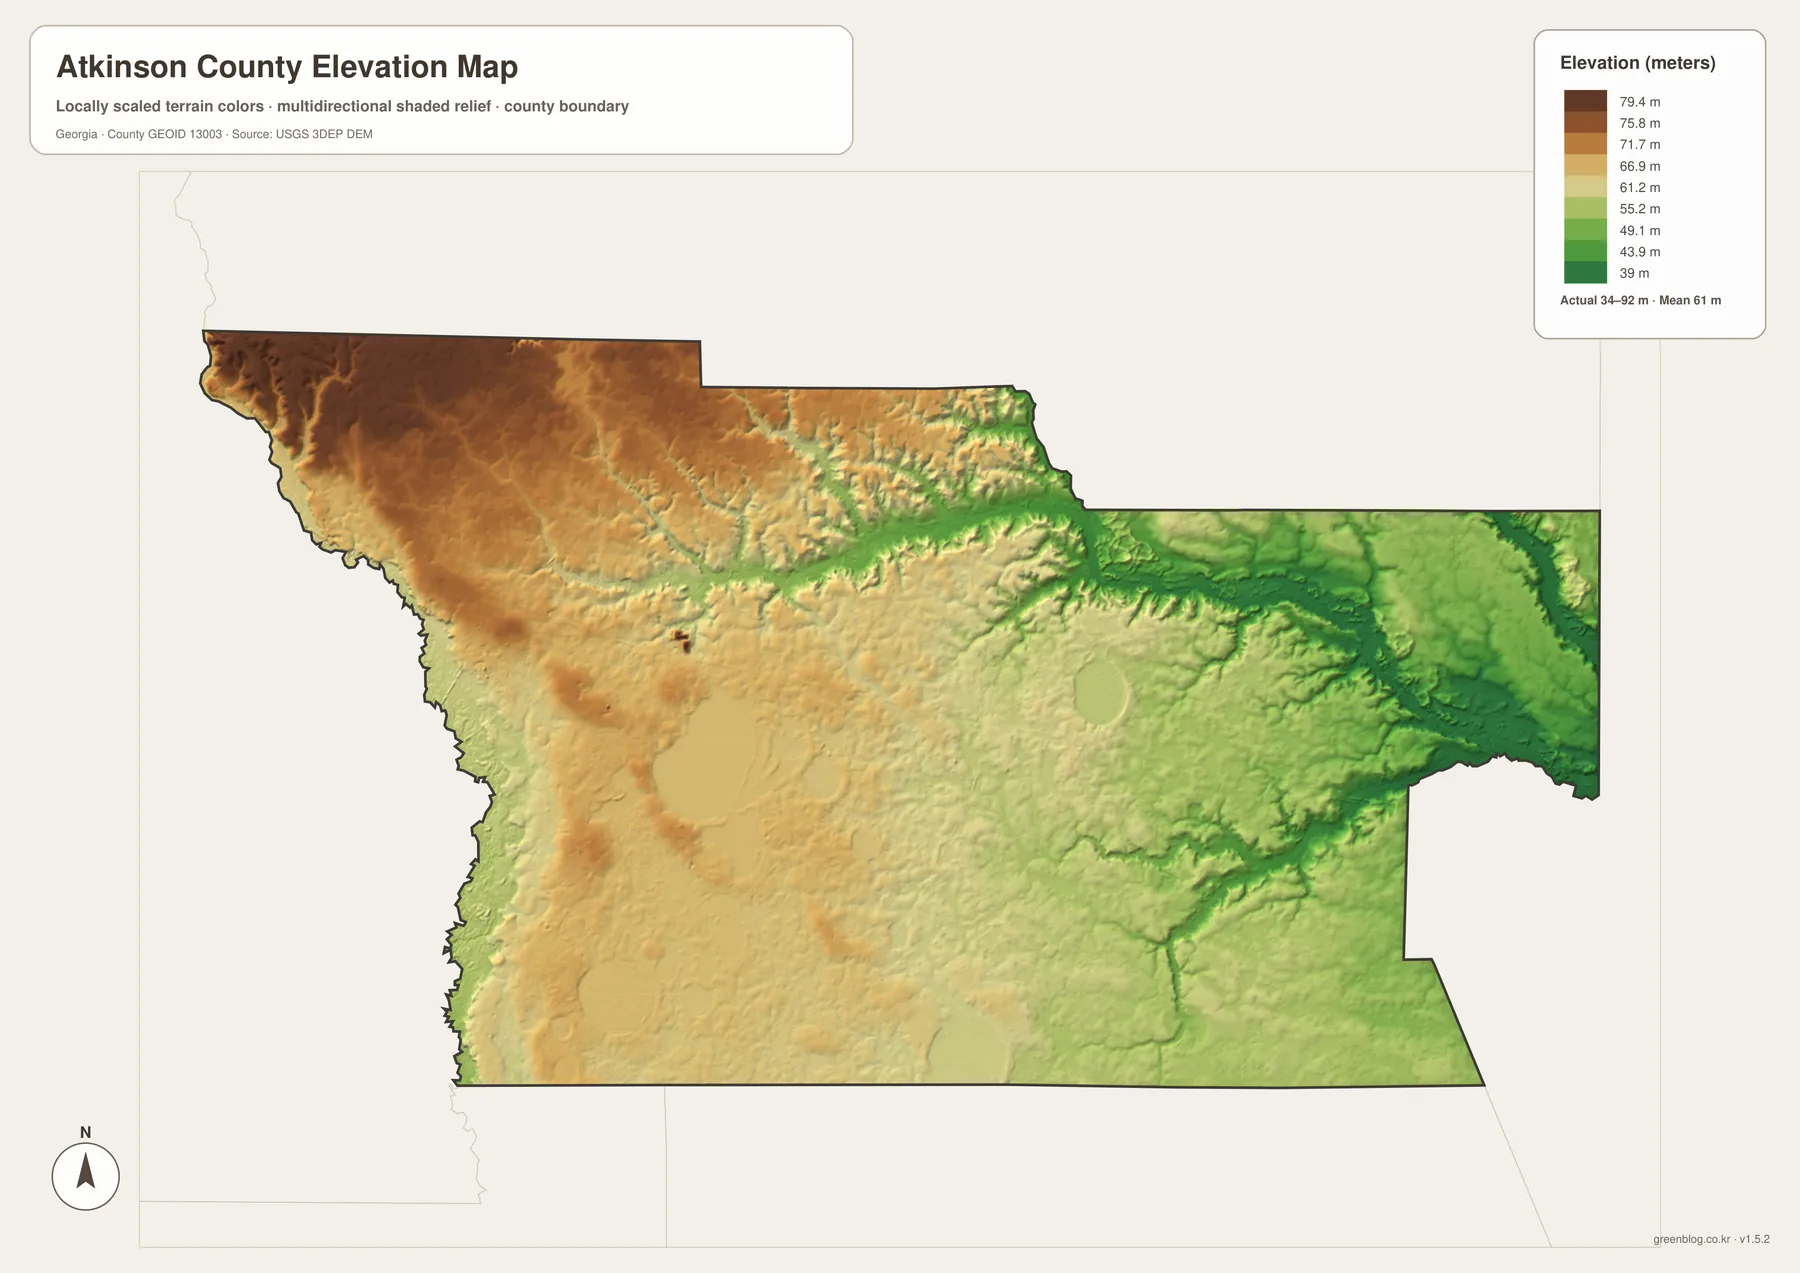
The elevation map confirms that Atkinson County is a low-relief Coastal Plain county rather than a mountainous one. The legend places the county between roughly 34 and 92 meters in elevation, with an average near 61 meters. Because the colors are locally scaled, brown and tan do not mean high mountains; they simply mark the higher parts of this county. Green shades mark lower areas. The northwest stands out in warmer colors, while broad portions of the east are greener. Narrow green branches also follow many of the stream valleys that cut across the interior.
Comparing the elevation and water maps makes the pattern easy to see. Lower green terrain follows the Satilla River side and the channels associated with Red Bluff Creek in the east and southeast. Other narrow depressions correspond to smaller streams that branch through the county. Higher colors occupy more of the northwestern interior and some areas between the stream corridors. The differences are measured in tens of meters, not hundreds, but they still help explain why waterways take the paths they do and why wetlands or low stream corridors appear in particular parts of the county.
This locally scaled surface should be used for relative comparison within Atkinson County. It is not a survey-grade elevation product, and a reader should not extract an engineering elevation for a house site, road project, or drainage design from the picture. The value of the map is visual: it shows that a county often described as generally flat still contains meaningful small changes in height. For lessons about terrain and water, those small differences are more useful than a statewide color scale that might make the entire county appear almost identical.
The elevation view is also a good example of why separating map themes improves readability. If the same shading were placed under every road, city label, creek name, county label, and boundary annotation, the page would become crowded. Here the terrain can be examined without that competition. A reader who wants road context can refer back to the general map, while someone comparing stream valleys can keep the terrain-and-water map beside the elevation file. The two images answer related questions without duplicating each other.
How local history explains the present map
Atkinson County was created in 1917 from parts of Coffee and Clinch counties and became Georgia’s 153rd county. It was named for William Y. Atkinson, who served as governor of Georgia in the 1890s. That relatively late creation date is useful context when looking at the current boundary. The county did not emerge from one obvious natural enclosure; it was formed by dividing existing county territory. The nearby Coffee and Clinch labels on the modern map therefore connect directly with the administrative history of the county.
The east–west arrangement of communities has an older history than the county itself. The supplied article describes the Kinnaird Trail as a route used by Muscogee people and later traders between the Flint River region and St. Marys on the coast. After the Civil War, the Brunswick and Albany Railroad followed part of the same broad travel direction and reached Pearson during the 1870s. Today, the Route 82 corridor links Willacoochee, Pearson, and Axson across the county. The modern road is not the historical trail or railroad, but all three help explain why the east–west band remained important to settlement and movement.
Willacoochee was incorporated in 1889 and Pearson in 1890. After the county was organized, Pearson became the county seat, and its courthouse was completed in 1920. Willacoochee preserves another part of the local story through McCranie’s Turpentine Still, which operated from 1925 to 1949. The supplied background material connects the local economy with pine forests, timber, turpentine, farming, and later poultry and other agricultural activity. Those industries make sense in the landscape visible on the maps: large rural spaces, modest terrain, numerous streams, and small towns rather than a dense urban network.
The four-map package can support that historical story without turning the page into a specialist research map. The general map supplies the modern road corridor and community names. The city map simplifies the settlement pattern to Pearson and Willacoochee. The water map provides the rivers and creeks that shaped travel, forestry, and wet ground, and the elevation map shows why many of those waterways occupy lower terrain. A local-history presentation can use one or two of those layers at a time, keeping the explanation clear while still connecting present geography with earlier transportation and resource use.
Choosing the right map for a project
The best file depends on the question. For a quick county overview, the general map offers the most balanced combination of boundary, roads, towns, streams, and nearby place context. For a lesson focused on settlement, the city map is cleaner because Pearson and Willacoochee stand out immediately. For rivers, creeks, wetlands, or drainage direction, the terrain-and-water map gives the most useful labels. For terrain, the elevation map makes the 34–92 meter local range and the lower stream corridors visible at a glance. Separating those tasks is more readable than trying to use one overloaded image.
- General county map: use it for the county outline, Pearson, Willacoochee, Axson, numbered roads, and broad geographic orientation.
- City map: use it to compare Pearson and Willacoochee and to place the county relative to Coffee, Berrien, Clinch, Lanier, and Ware counties.
- Terrain and water map: use it for the Alapaha and Satilla rivers, Red Bluff Creek, Sweetwater Creek, other named streams, and waterbody context.
- Elevation map: use it to compare the relatively higher northwest with lower eastern and stream-valley terrain across the county’s locally scaled 34–92 m range.
For printed material, pairing two maps can be more effective than selecting only one. A transportation or county-orientation handout might place the general and city maps side by side. A physical-geography lesson can pair the water and elevation maps so readers can compare blue stream lines with lower green terrain. The downloadable JPG files use an A3 layout, which provides more room for labels than the on-page WEBP previews. Even so, they remain reference graphics rather than operational GIS layers. Current road closures, parcel ownership, zoning, survey boundaries, flood determinations, and exact site elevations require the latest official data.
A practical reading sequence is to begin with Pearson on the general map, move west to Willacoochee and east to Axson, then switch to the city map for a simplified settlement view. Next, use the water map to locate the Alapaha River on the west and the Satilla River on the east, noting the smaller creeks in between. Finally, compare those waterways with the elevation colors. This sequence turns four separate images into one coherent geographic explanation without forcing the reader to decode all layers at once.
Frequently Asked Questions
Where should I start when reading the Atkinson County map?
Start with Pearson. It is the county seat and the most useful central reference on the general map because several numbered routes meet nearby. From Pearson, follow Route 82 west toward Willacoochee and east toward Axson. Once that east–west relationship is clear, the city, water, and elevation maps are much easier to compare.
How many incorporated cities are shown for Atkinson County?
The supplied county material identifies two incorporated cities: Pearson and Willacoochee. Axson and Kirkland are also useful community names for understanding the county, but they have a different municipal status. The city map intentionally emphasizes the two incorporated cities, while the general map provides more local place context.
How do the water and elevation maps complement each other?
They show that many lower areas follow river and creek corridors. The elevation map uses a local range of about 34 to 92 meters, and lower green terrain often aligns with waterways shown on the terrain-and-water map, especially toward the Satilla and Red Bluff Creek side. The maps are useful for geographic explanation, but they are not flood maps or survey-grade elevation products.
Map File Information
Atkinson County map files
- Included Files: Four high-resolution A3 JPG maps: general county map, city map, water map, and elevation map
- File Type: High-resolution A3 JPG files in one ZIP archive
- Intended Use: Printing, education, presentations, and map-based projects
Related Maps
Sources and reference material
Population and land-area context can be checked with U.S. Census Bureau QuickFacts. County creation, settlement history, rail development, and forest-industry background are covered by The New Georgia Encyclopedia county profile. Local planning material is available through the Georgia Department of Community Affairs comprehensive-plan record.
For water information, the package points to the USGS Red Bluff Creek monitoring location and the broader USGS National Hydrography program. Elevation-data background is available from the USGS 3D Elevation Program. These sources should be used when a project needs current or technical data beyond the county-scale reference maps on this page.
Green Map creates custom-edited map images using open geographic data sources such as geoBoundaries, Natural Earth, OpenStreetMap, and government open data. These maps are edited visual materials, not raw data files, and are provided for education, documents, presentations, and graphic reference.