Western Connecticut Planning Region stretches from the Long Island Sound shoreline around Greenwich, Stamford, and Norwalk northward through Danbury to the New Milford area. The region is unusually long for Connecticut, so one map has to cover two very different settings: a densely settled coastal corridor in the south and a more inland landscape of towns, lakes, streams, and rolling terrain to the north. This page includes a boundary-and-roads map, a city-connections map centered on Stamford, and a terrain-and-water map. After reviewing the maps on the page, you can download the same map set as high-resolution JPG files for printing or document work.
The name can be confusing if you are used to Connecticut’s former counties. Western Connecticut Planning Region is one of the state’s nine planning regions now recognized by the U.S. Census Bureau as county-equivalent geography. That means current Census products can use this planning-region boundary in places where users elsewhere in the country would normally see a county. The map therefore follows the modern Western Connecticut Planning Region rather than the old Fairfield County or Litchfield County lines.
Table of Contents
A north–south region from Long Island Sound to the New Milford area
The overall outline is easiest to understand from south to north. Greenwich and Stamford sit at the southwestern end near the New York line, while Norwalk lies farther east along the Sound. The boundary then reaches inland through communities such as Ridgefield, Bethel, Danbury, and Newtown before extending north through Brookfield and New Milford. This long shape explains why the region can feel coastal in one part and distinctly inland in another. It also makes the map useful for seeing how southwestern Connecticut connects to both New York and the interior of the state.
WestCOG, the regional council of governments, lists eighteen member municipalities: Bethel, Bridgewater, Brookfield, Danbury, Darien, Greenwich, New Canaan, New Fairfield, New Milford, Newtown, Norwalk, Redding, Ridgefield, Sherman, Stamford, Weston, Westport, and Wilton. Those places are not simply a string of coastal suburbs. They include shoreline cities, inland commuter communities, the Danbury area, and northern towns around major lakes and wooded hills. Grouping them within one planning region produces the distinctive boundary shown on the map.
This geography also matters when looking up statistics. The Census Bureau now publishes many county-level style tables for Western Connecticut Planning Region directly, so the modern name appears in demographic and economic products. A visitor comparing a map with current data should use the planning-region boundary rather than assume that an older county outline is still the active county-equivalent unit.
Roads and settlement around Danbury, Newtown, Stamford, and Norwalk
The general map combines the planning-region boundary with major places and roads. Danbury stands out in the central-western part of the region, with Newtown to the east and Brookfield and New Milford to the north. I-84 crosses the Danbury–Newtown area from west to east, while Route 7 provides an important north–south reference toward Brookfield and New Milford. Along the southern end, Greenwich, Stamford, and Norwalk form a tighter coastal chain. The western edge meets New York, so the map also makes the cross-state position of the region immediately clear.
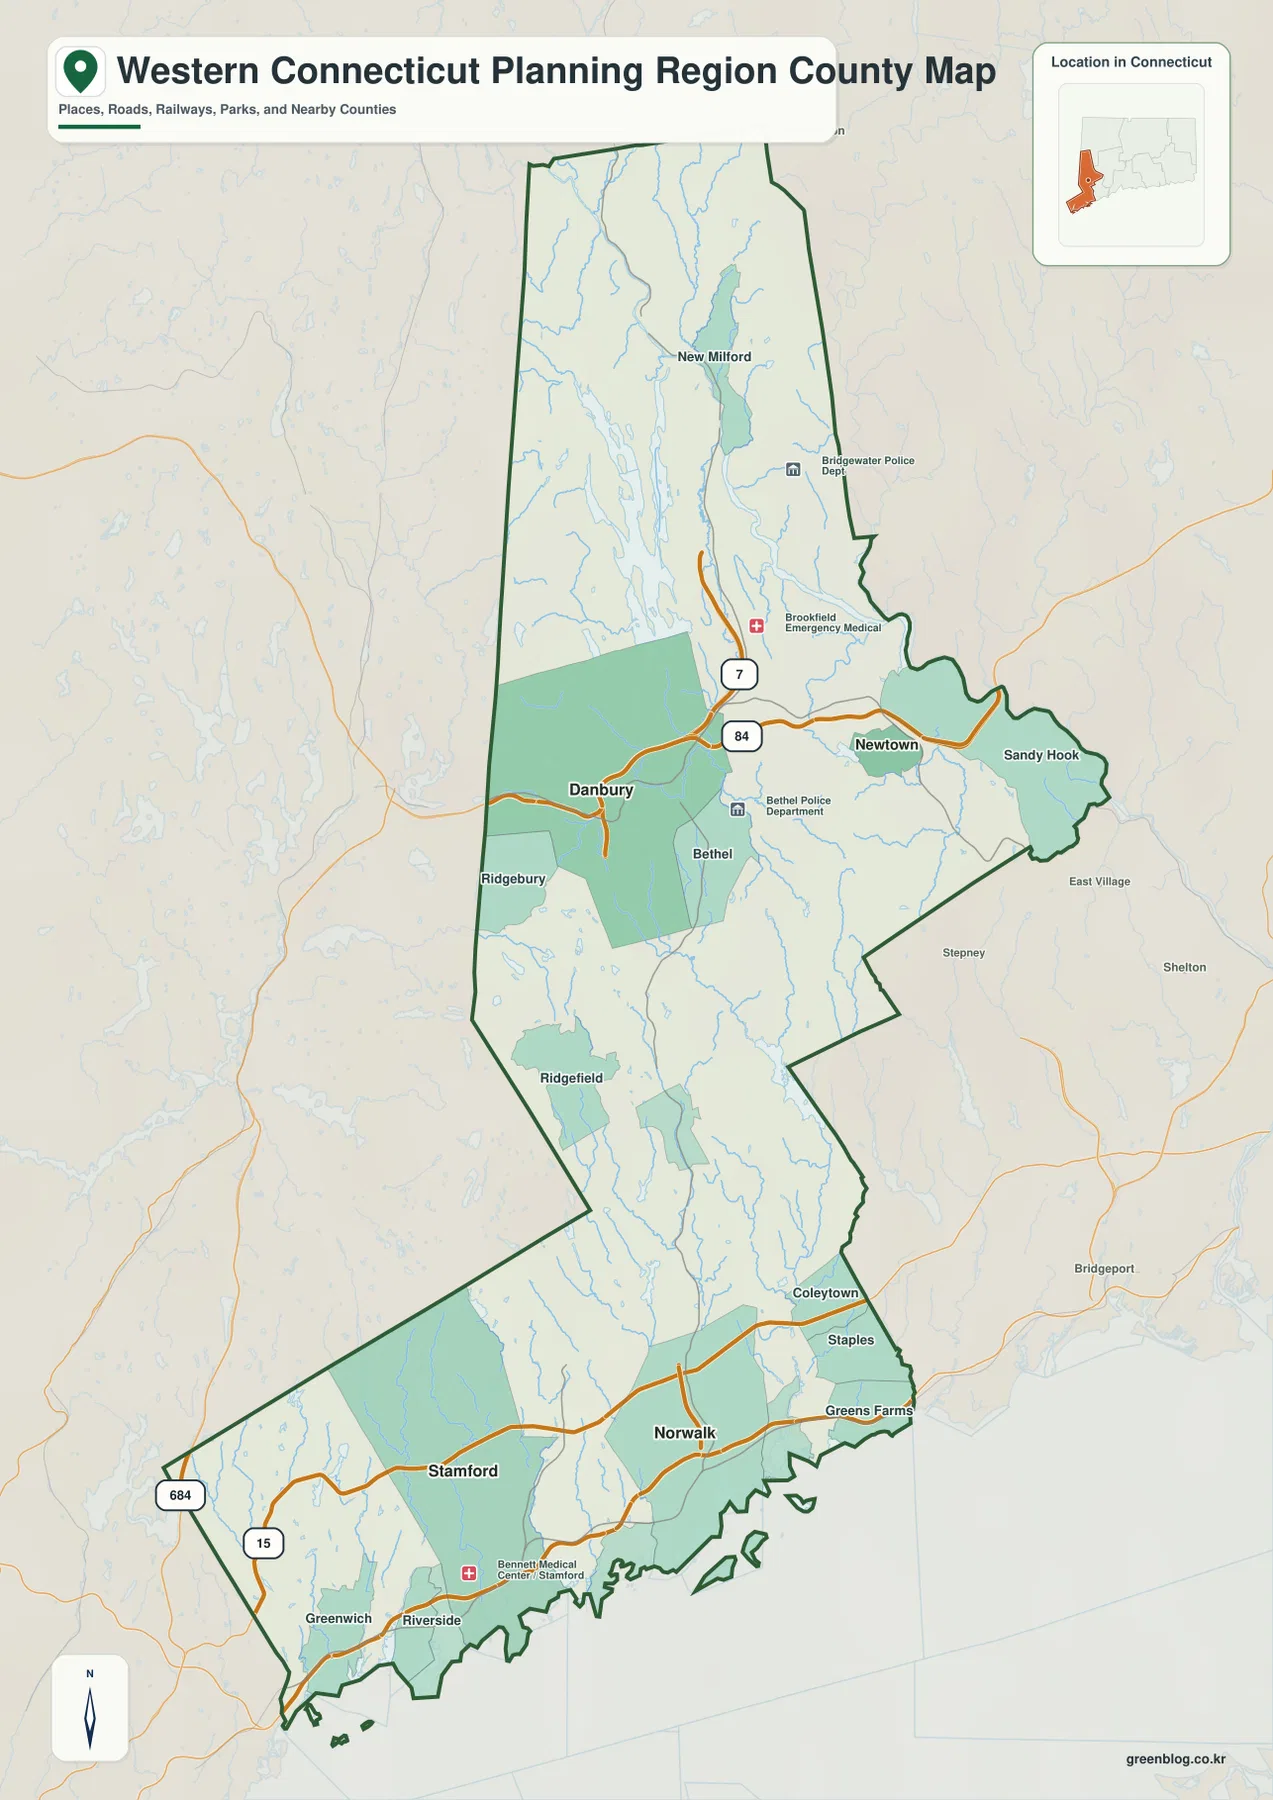
Danbury is a useful anchor when reading the inland half of the map. It is close to the New York side of the region, while Newtown extends the planning region eastward and New Milford carries it much farther north. In contrast, Stamford and Norwalk sit close to Long Island Sound and are surrounded by a denser road and settlement pattern. Seeing those places together helps explain why a single regional map must cover both the New York–oriented southwest corner of Connecticut and a broad inland section with a different settlement pattern.
For printed reference, the combination of roads and place names is often more helpful than an outline alone. Start with the coastal cities, locate Danbury in the middle portion, and then follow the region north to New Milford. Once those anchor points are clear, smaller places such as Bethel, Brookfield, Ridgefield, Sandy Hook, and Greenwich are easier to place. The map is designed for geographic orientation, not turn-by-turn navigation, but it gives enough road context to understand how the major communities relate to one another.
Stamford as a practical reference point for city connections
The city-connections map simplifies the region by using Stamford as a hub and highlighting Norwalk, Danbury, and Newtown. Norwalk appears close to Stamford along the southern part of the region, while Danbury and Newtown are much farther inland. This reduced view is useful when the full boundary map contains more detail than a presentation or classroom graphic needs. It lets the reader compare the direction and relative separation of several major centers without being distracted by every road and place label.
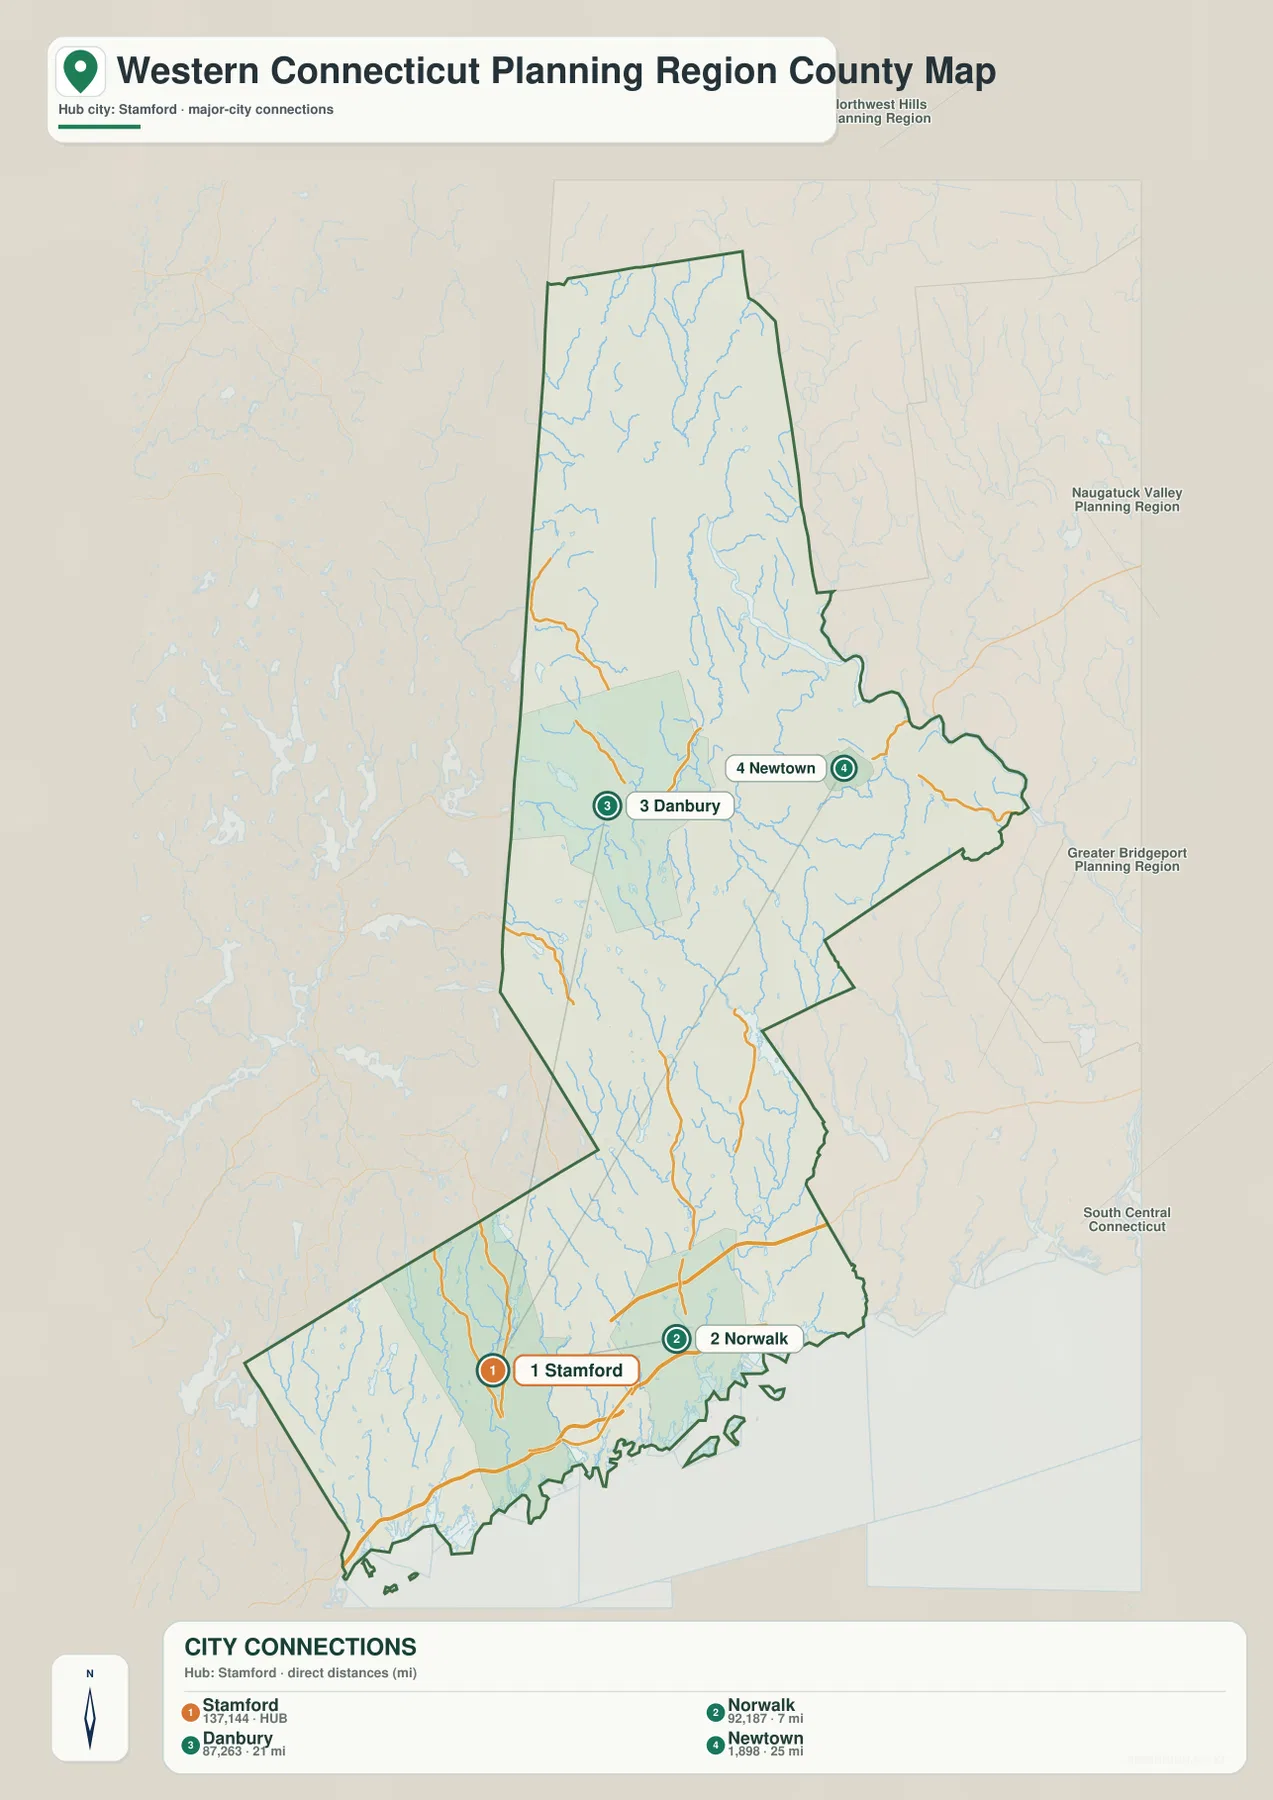
The distance labels on this map are straight-line distances between the mapped reference points. They are not driving distances and should not be used to estimate a road trip without another navigation source. Actual travel follows the road network, including corridors such as I-95 near the coast, Route 7, and I-84, and can be considerably different from a direct line. For geographic comparison, however, the straight-line connections clearly show that Stamford and Norwalk form a close southern pair while Danbury and Newtown occupy a separate inland zone.
This also prevents an overly simple view of the planning region as “the Stamford area.” Stamford is the largest southern reference point on the city map, but Danbury is a major inland center and Newtown covers a broad area to the east of it. When the city-connections map is read beside the full boundary map, the region looks less like one continuous city and more like several connected settlement areas stretching from the coast into western Connecticut’s interior.
Lake Candlewood and the river network leading toward the Sound
The terrain-and-water map changes the emphasis completely. Lake Candlewood is the largest labeled inland water body and provides a strong landmark in the northern half of the region. The Still River is marked nearby, the Aspetuck River appears farther north, and Limekiln Brook is labeled in the central section. Farther south, the Norwalk River, West Branch Saugatuck River, Saugatuck River, Five Mile River, and Rippowam River create a much denser set of named waterways approaching Long Island Sound.
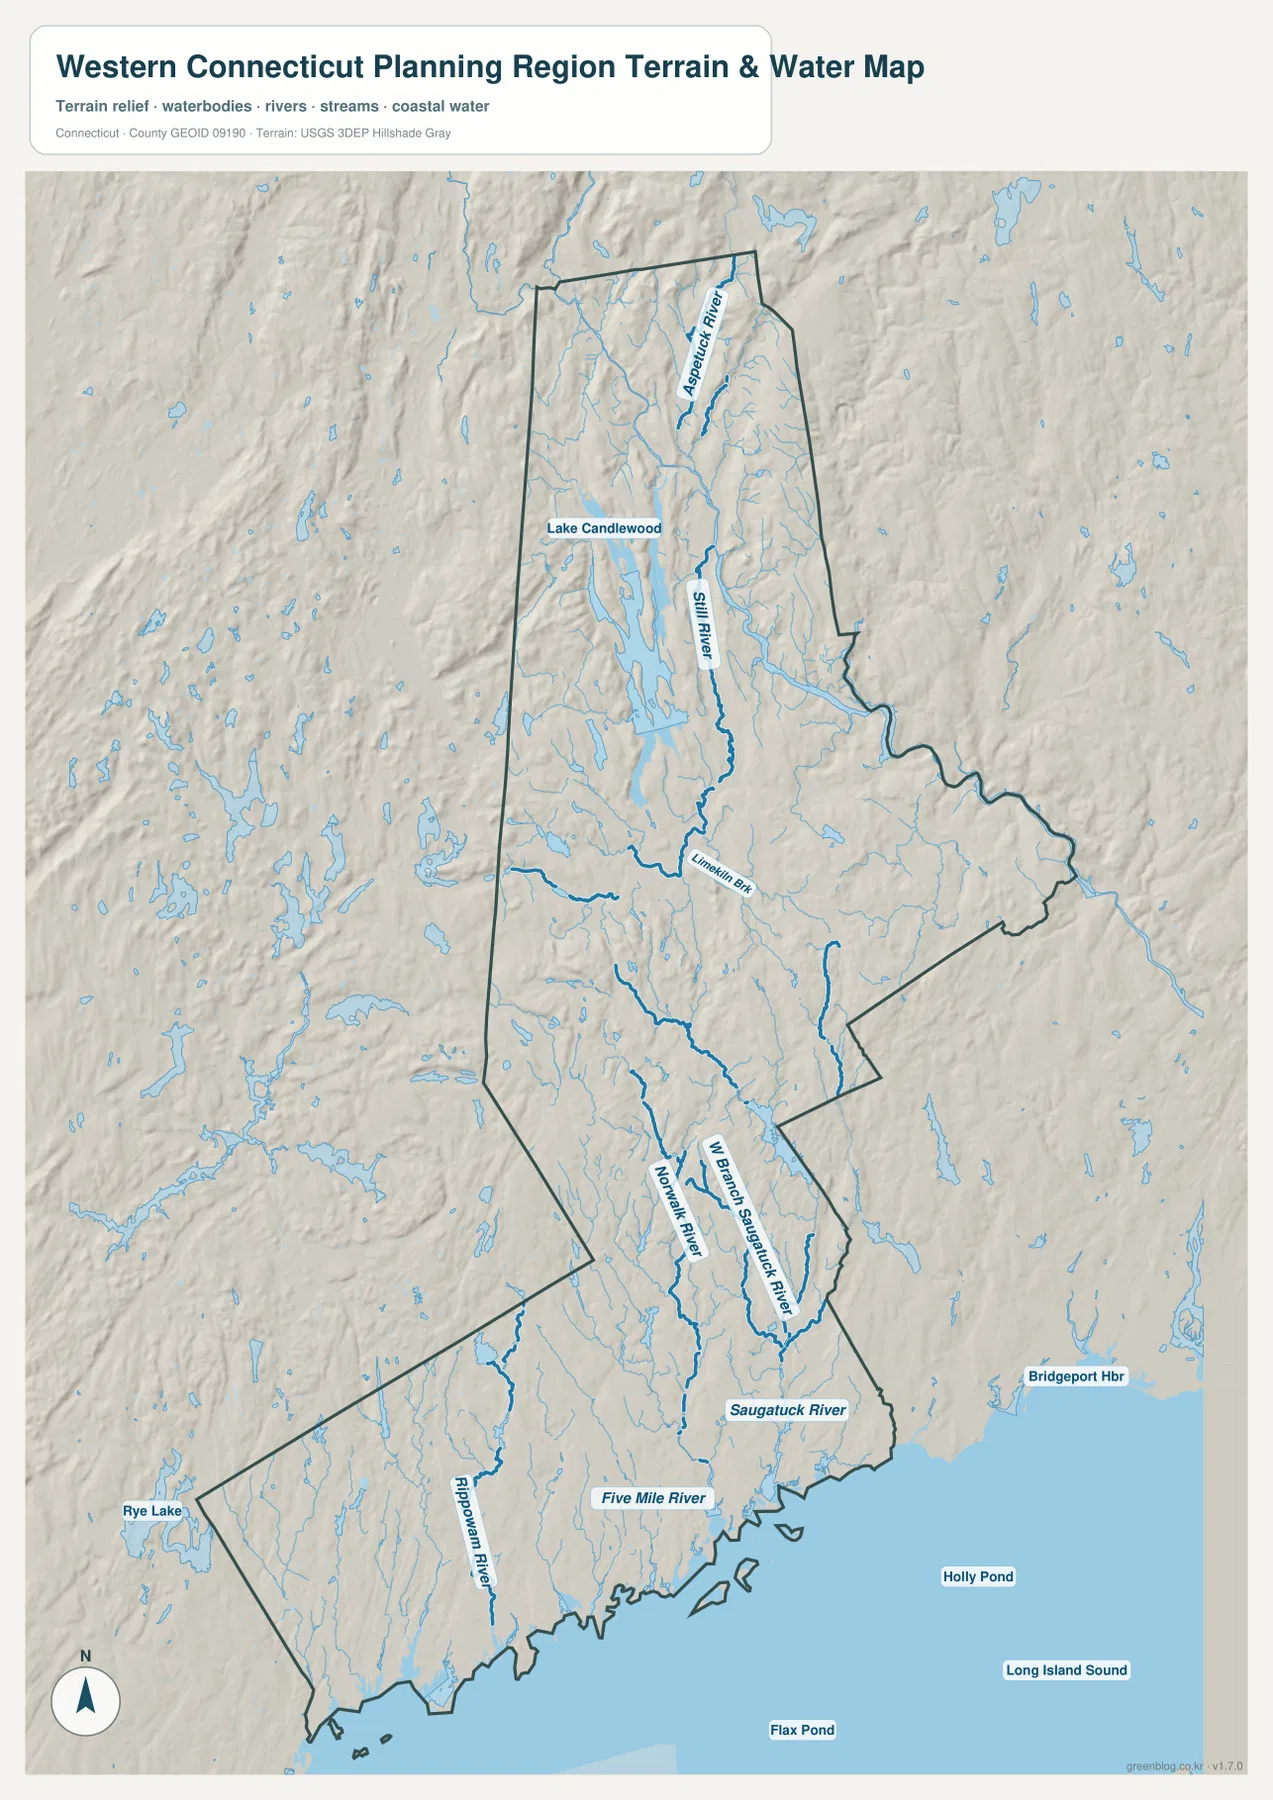
Relief shading adds another layer of context. The inland parts of the planning region show more broken, rolling terrain, with streams following lower corridors between higher ground. Near the coast, the map opens toward Long Island Sound and the drainage network becomes easier to relate to the shoreline. This is not an engineering elevation surface and it does not provide survey-grade heights, but it is effective for explaining why water routes and transportation corridors often occupy the same broad valleys.
Several southern waterways can be compared on one sheet. The Norwalk River and Saugatuck River systems are prominent east of the Stamford area, while the Rippowam River and Five Mile River are useful references closer to the southwestern shoreline. In the north, Lake Candlewood and the Still River provide a very different water setting. This contrast between large inland water bodies and many shorter coastal rivers is one of the most distinctive geographic features visible across the map set.
The water map should be treated as a regional reference map. It is not a flood-hazard map, a parcel-boundary product, or a navigation chart for boating. It shows the relative positions of rivers, streams, lakes, terrain, and coastal water so that a reader can understand the physical setting. Anyone making a regulatory, engineering, flood, or navigation decision should use the appropriate official specialist dataset instead.
Why the planning region appears as a county-equivalent
Connecticut’s eight traditional counties stopped functioning as general-purpose county governments decades ago. Beginning with the 2022 statistical geography changes, the Census Bureau generally uses the state’s nine councils of governments or planning regions as county-equivalent units. Western Connecticut Planning Region is identified within that system with state FIPS 09 and county-equivalent code 190. The change aligns federal statistical geography more closely with the regional organizations that Connecticut actually uses for planning and coordination.
The modern boundary crosses old county lines, which is why it should not be described as a renamed Fairfield County. Much of the southern and central part overlaps territory historically associated with Fairfield County, but New Milford and Bridgewater were historically in Litchfield County. The current planning region instead follows the eighteen WestCOG municipalities. That is why the map extends so far north while still reaching the Stamford and Greenwich shoreline at its southern end.
This distinction is especially important for people comparing older maps, historical records, and current Census tables. An older source may organize the same communities by Fairfield or Litchfield County, while a current Census profile may place them under Western Connecticut Planning Region. Both can be valid in their own time and purpose, but they are not interchangeable boundaries. Using the planning-region map alongside the source date helps avoid that confusion.
Choosing the map that fits the question
Use the general boundary map when the main task is to locate communities, roads, and the shape of the planning region. It is the strongest choice for a report that needs to show Stamford, Danbury, Newtown, New Milford, and the New York boundary together. The city-connections map is better when the goal is a simpler comparison among major centers. The terrain-and-water map is the most useful option for explaining Lake Candlewood, river systems, rolling inland terrain, and the relationship between the region and Long Island Sound.
Looking at all three maps together adds more value than repeating the same information three times. The road map explains how settlement is arranged, the city graphic reduces that arrangement to a few clear reference points, and the water map reveals a physical landscape that is easy to miss when roads dominate the page. A teacher might use the city map for a quick orientation exercise and then switch to the water map for a discussion of rivers and lakes. A local-history or planning presentation may prefer the full boundary map as the main figure.
The WebP images on this page are intended for quick viewing in a browser. The downloadable archive contains the corresponding high-resolution JPG files, which are better suited to printing, enlarging, or placing in documents and presentations. Checking the preview first helps you choose the right file before downloading the archive, especially if you only need one kind of geographic information.
Frequently Asked Questions
Is Western Connecticut Planning Region the same as Fairfield County?
No. The planning region includes many communities that were historically in Fairfield County, including Stamford, Norwalk, and Danbury, but it also includes New Milford and Bridgewater, which were historically in Litchfield County. Current Census county-equivalent geography follows the Western Connecticut Planning Region boundary rather than simply renaming one former county.
Are the city-connection distances driving distances?
No. The distance labels on the city-connections map are straight-line distances between the mapped points. Road travel follows the actual highway and street network, so a driving distance or travel time can be longer. Use a navigation service or a detailed road map for trip planning.
Can the water map be used for flood or boating decisions?
It should not be used for those decisions. The map is a regional reference showing Lake Candlewood, named rivers and streams, terrain relief, and Long Island Sound. Flood-risk analysis, regulatory boundaries, engineering work, and marine navigation require the appropriate official specialist maps and datasets.
Map File Information
The archive contains high-resolution JPG versions of the Western Connecticut Planning Region boundary-and-roads map, the Stamford-centered city-connections map, and the terrain-and-water map. Review the WebP previews above, then use the JPG files when you need larger print or document-ready images.
- Included Files: boundary/roads map, city-connections map, terrain/water map
Related Maps
Sources and references
For the current county-equivalent system, see the U.S. Census Bureau note on Connecticut county-equivalent changes and the Census profile for Western Connecticut Planning Region. The region’s municipal membership is documented by the Western Connecticut Council of Governments regional hazard-mitigation page. Waterway context can be checked against the USGS National Hydrography program.
Green Map creates custom-edited map images using open geographic data sources such as geoBoundaries, Natural Earth, OpenStreetMap, and government open data.
These maps are edited visual materials, not raw data files, and are provided for education, documents, presentations, and graphic reference.