You can download four high-resolution A3 JPG maps for Baldwin County, Georgia, from this page. The set is built around Milledgeville and separates the county boundary and main roads, the major-city pattern, named waterways, and elevation into different views. That makes it easier to choose one map for a simple location reference or combine several when a lesson, report, or local-history project needs more geographic context.
Baldwin County is a compact central-Georgia county whose map is strongly shaped by one city, a branching reservoir shore, numerous creeks, and rolling terrain. Milledgeville sits a little north of the county’s center and provides the clearest reference point for the road network. Lake Sinclair reaches into the northern side, while lower valleys and creek corridors run through the interior and southeast. The elevation map places the county between about 65 and 191 meters, so the relief is modest by mountain-region standards but still varied enough to explain the ridges and drainage lines visible on the other maps.
Table of Contents
Milledgeville, the County Boundary, and the Main Road Network
The county map is the best place to begin because it puts the major pieces on one page without crowding the image with every local street. Baldwin County is bordered by Jones County to the west, Putnam County to the north, Hancock County to the east and northeast, Washington County toward the east and southeast, and Wilkinson County on the southwest side. The northern boundary bends around the Lake Sinclair area, while several western and southern boundary segments are much straighter. Those different edge shapes help orient the county even before individual road numbers are read.
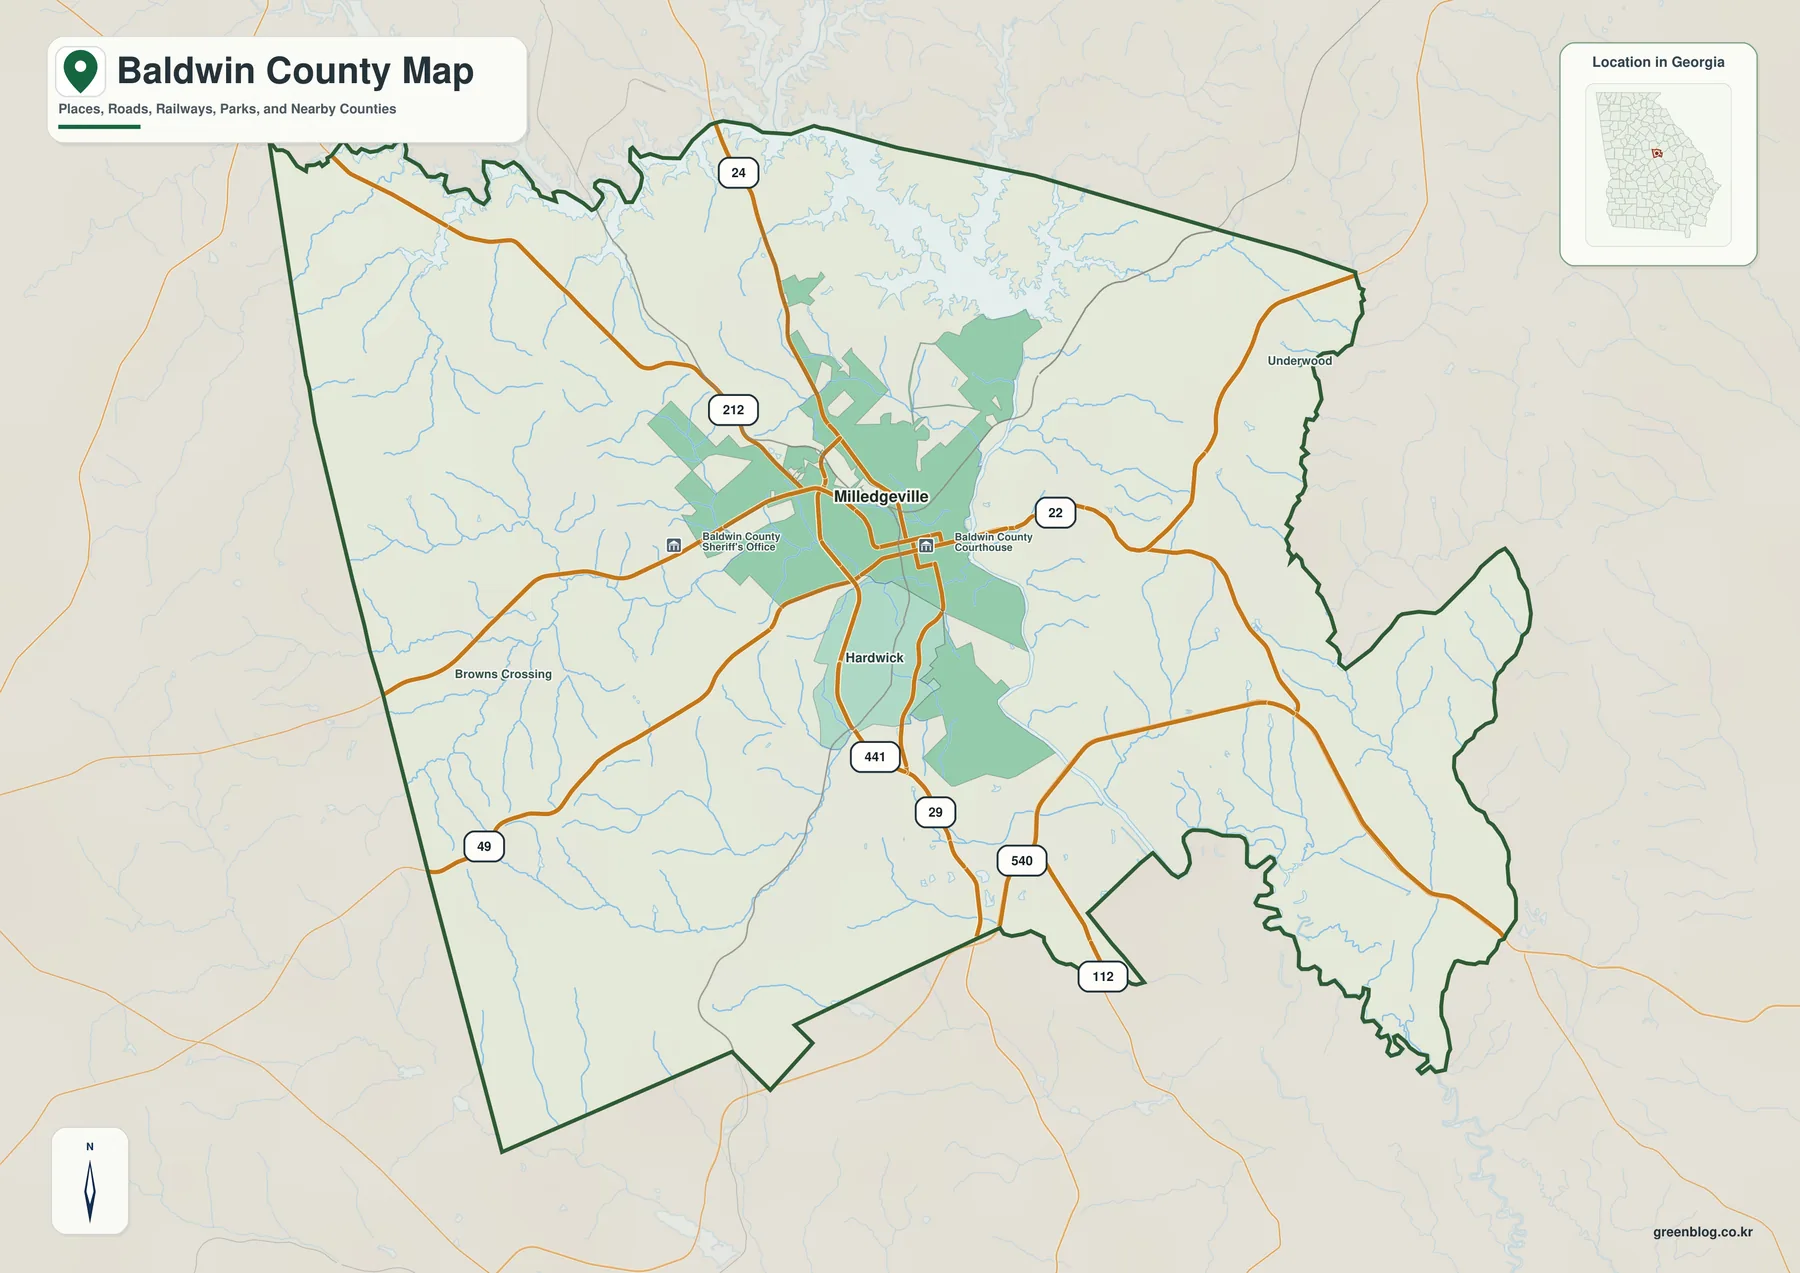
Milledgeville is the strongest label on the overview. The Baldwin County Courthouse and Sheriff’s Office are marked close to the city center, which makes the administrative core easy to identify. Hardwick appears to the south, Browns Crossing to the west, and Underwood toward the eastern side. The map is not intended to show every unincorporated settlement or every neighborhood, but these labels give enough reference points to distinguish the central city from the county’s outer areas.
US 441 supplies the most obvious north–south route. It enters from the north, passes through Milledgeville and Hardwick, and continues toward the southern part of the county. State Route 22 extends east from Milledgeville, Route 24 approaches from the north, Route 49 comes in from the southwest, and Route 212 reaches the city area from the northwest. Route 29 and SR 540 appear in the lower part of the county, and Route 112 is labeled near the southern and southeastern edge. The simplified network is useful for explaining direction and county access, although it should not replace a current navigation map for turn-by-turn travel.
The overview also shows many small blue stream lines crossing the road network. They are intentionally understated here because the main purpose is orientation, but they hint at how dissected the county is by drainage. A reader who only needs to place Milledgeville within Baldwin County can stop with this map. Anyone interested in why the terrain and roads look the way they do will get much more detail from the water and elevation views farther down the page.
Why the City Map Is Dominated by Milledgeville
The supplied city-distribution map is deliberately simple. It identifies Milledgeville as the county’s single ranked major city and prints 16,748 in the city index. That figure is the value shown on the map’s city index and should not be confused with the countywide 2020 population of 43,799 listed elsewhere on this page. The distinction matters because the city map is describing the selected urban center, not the entire population living inside Baldwin County.
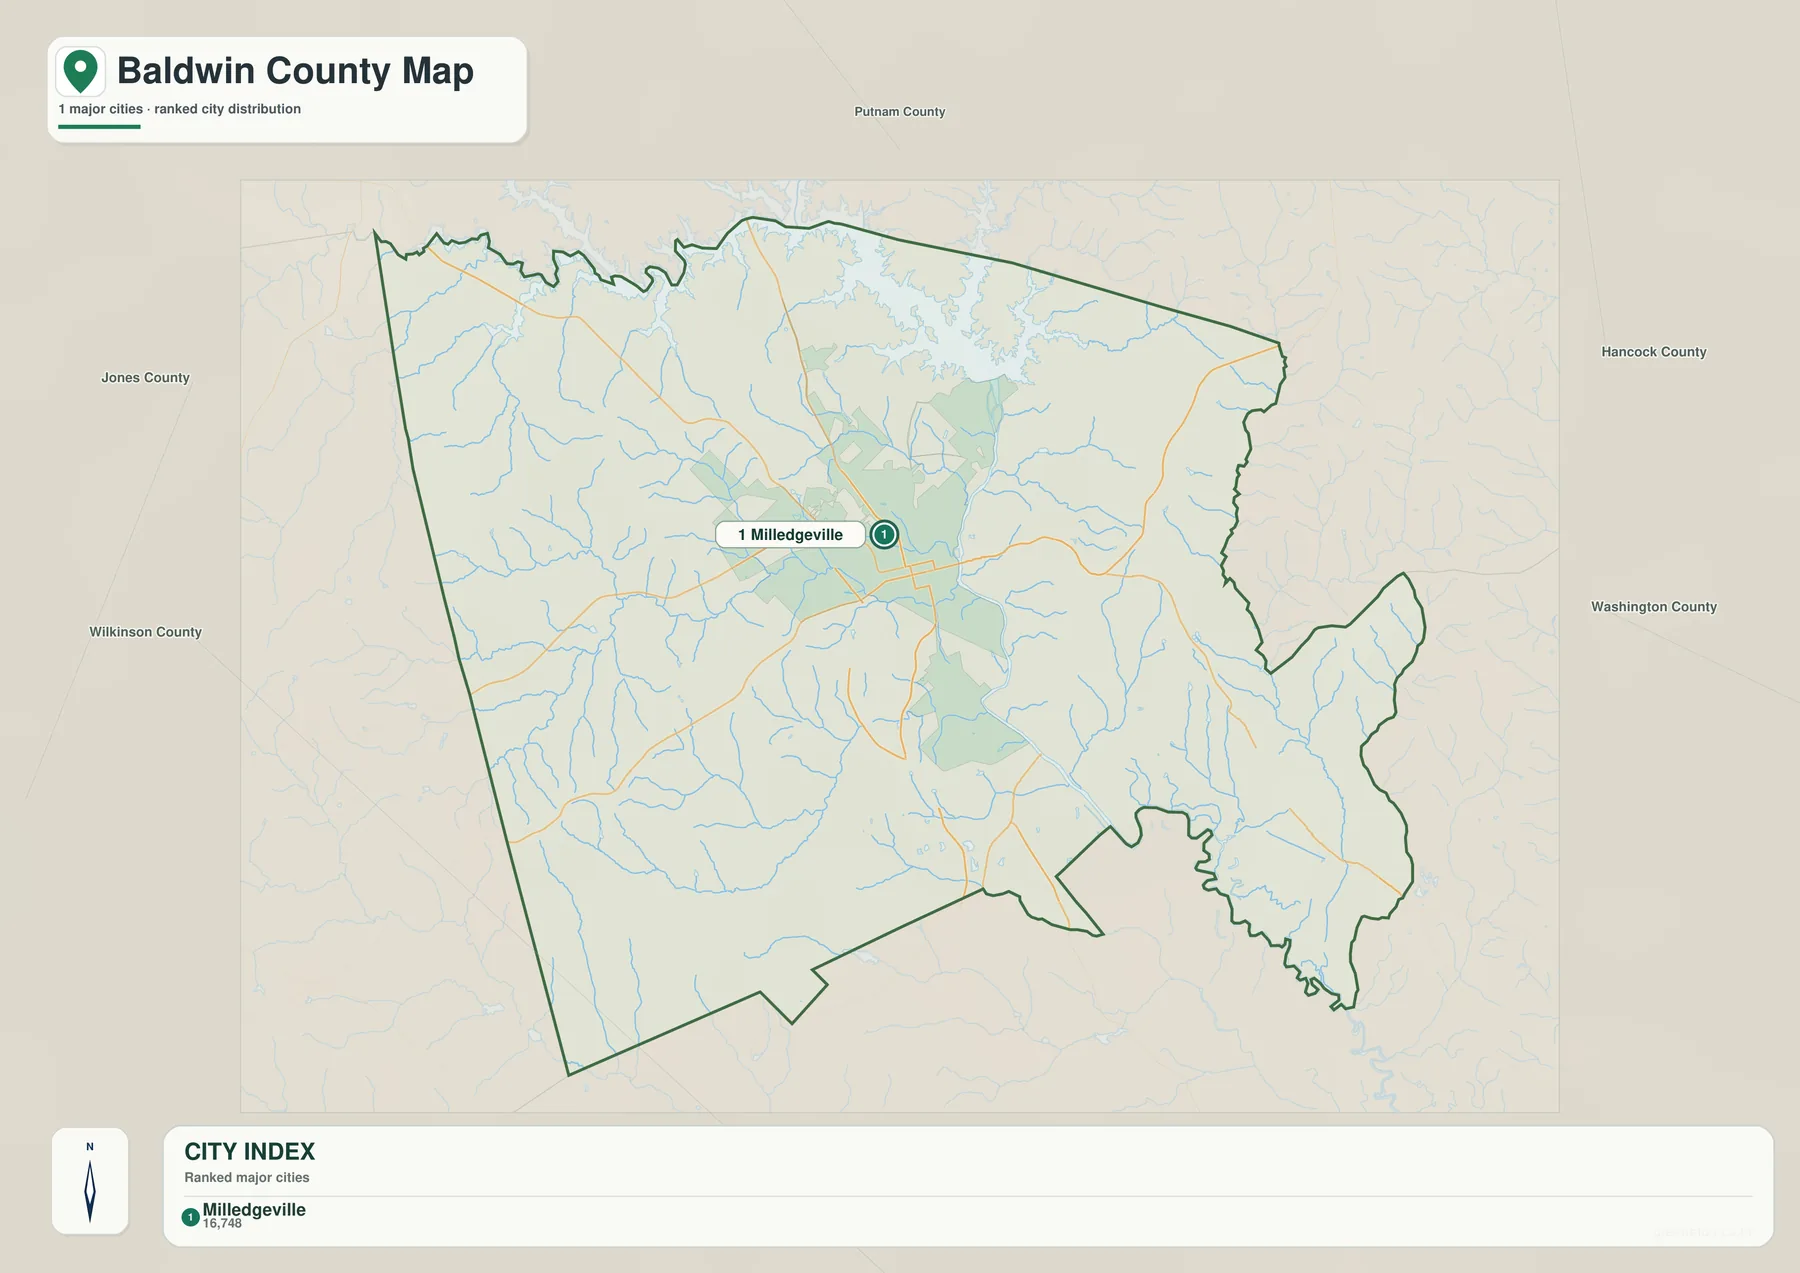
Because only one major city is plotted, this version does not use connector lines or city-to-city distance labels. Its value is the clean relationship between Milledgeville and the county boundary. The neighboring county names are placed outside the outline, so a viewer can quickly see that Jones County lies west, Putnam County north, Hancock County to the east and northeast, Washington County farther southeast, and Wilkinson County southwest. For a presentation slide or a short county profile, that uncluttered layout may be easier to use than a map filled with minor place names.
Milledgeville’s importance is also supported by the county background supplied with the package. Baldwin County was created in 1803, and Milledgeville served as Georgia’s state capital from 1807 until 1868. The Old Capitol and Old Governor’s Mansion remain close to the historic core. Georgia College & State University and Georgia Military College add major educational functions to the same urban area. These institutions are not all individually mapped on the city-distribution graphic, but they explain why one city serves as such a strong geographic and civic anchor for the county.
South of the city, Hardwick forms a recognizable continuation of the developed area, while the former Central State Hospital grounds occupy a large institutional landscape in that direction. The county overview also shows roads continuing toward the lower part of Baldwin County rather than a second urban center of comparable scale. For readers studying settlement rather than road detail, the city map therefore communicates a simple point: much of the county’s civic identity is concentrated around Milledgeville, while the rest of the county is more dispersed.
Lake Sinclair and the Creek Network Across Baldwin County
The water-and-terrain map changes the emphasis completely. Lake Sinclair occupies the northern part of the view with a deeply branching shoreline, and Lake Laurel is labeled farther south and east. Across the interior, the map names Tobler Creek, Sand Creek, Watson Creek, Fishing Creek, Black Creek, Town Creek, Little Black Creek, Little Camp Creek, Goose Creek, Camp Creek, and Turkey Creek. Gum Pond is marked in the southeast. These labels turn the faint stream network from the county overview into a readable system of named water features.
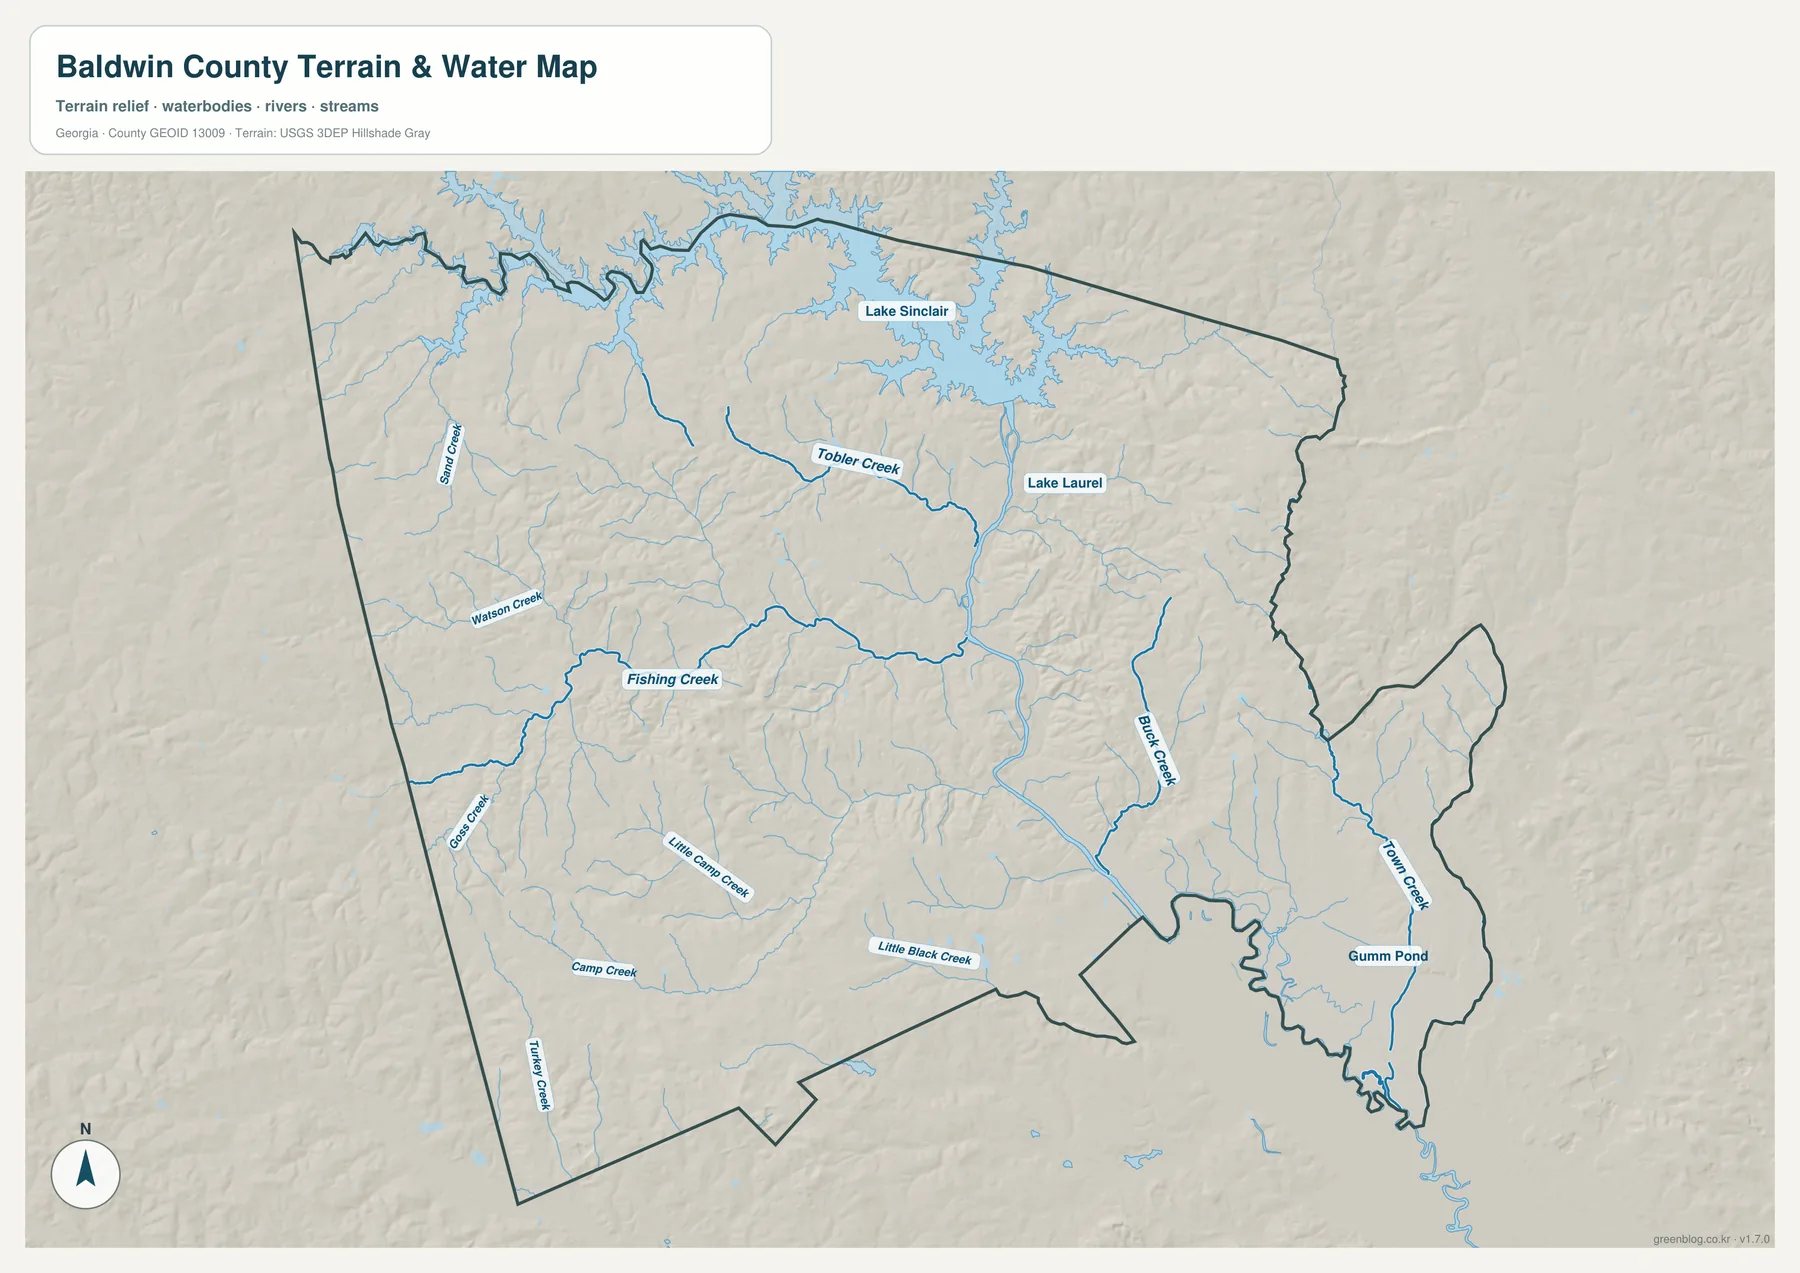
Lake Sinclair is the most visually distinctive water body. The information supplied with the county package describes the reservoir as having been created in 1953 and covering about 15,300 acres. On the map, its irregular coves reach into the northern boundary rather than forming a simple oval lake. That shoreline gives northern Baldwin County a different character from the inland south and is one reason a standard county outline alone does not fully describe the geography.
The creeks are important because they show that drainage is spread across the county rather than concentrated in one channel. Fishing Creek crosses a broad central-western area, Tobler Creek is prominent north of the center, Black Creek runs through the east-central and southeastern side, and Town Creek is labeled farther east. Smaller branches fill the spaces between them. When this map is compared with the elevation view, many of the blue lines align with lower green valleys, while higher ridges stand between the drainage corridors.
This is a county-scale water reference, not a flood-risk product. It does not show flood zones, water depth, current flow, boat access, property ownership, or legal water boundaries. A location beside Lake Sinclair or a named creek may require a current local road map, an official flood resource, or site-specific water information. The map is most useful for identifying where the major named water features sit relative to the county boundary and one another.
Elevation from 65 to 191 Meters: Ridges, Valleys, and Relief
The elevation map reports an actual county range of about 65 to 191 meters and a mean elevation of about 119 meters. That spread is large enough to reveal clear local relief even though Baldwin County is not a high-mountain landscape. Orange and brown tones mark relatively higher ground, especially across parts of the west, northwest, and eastern edge, while greener areas trace lower terrain through the central and southeastern drainage corridors.
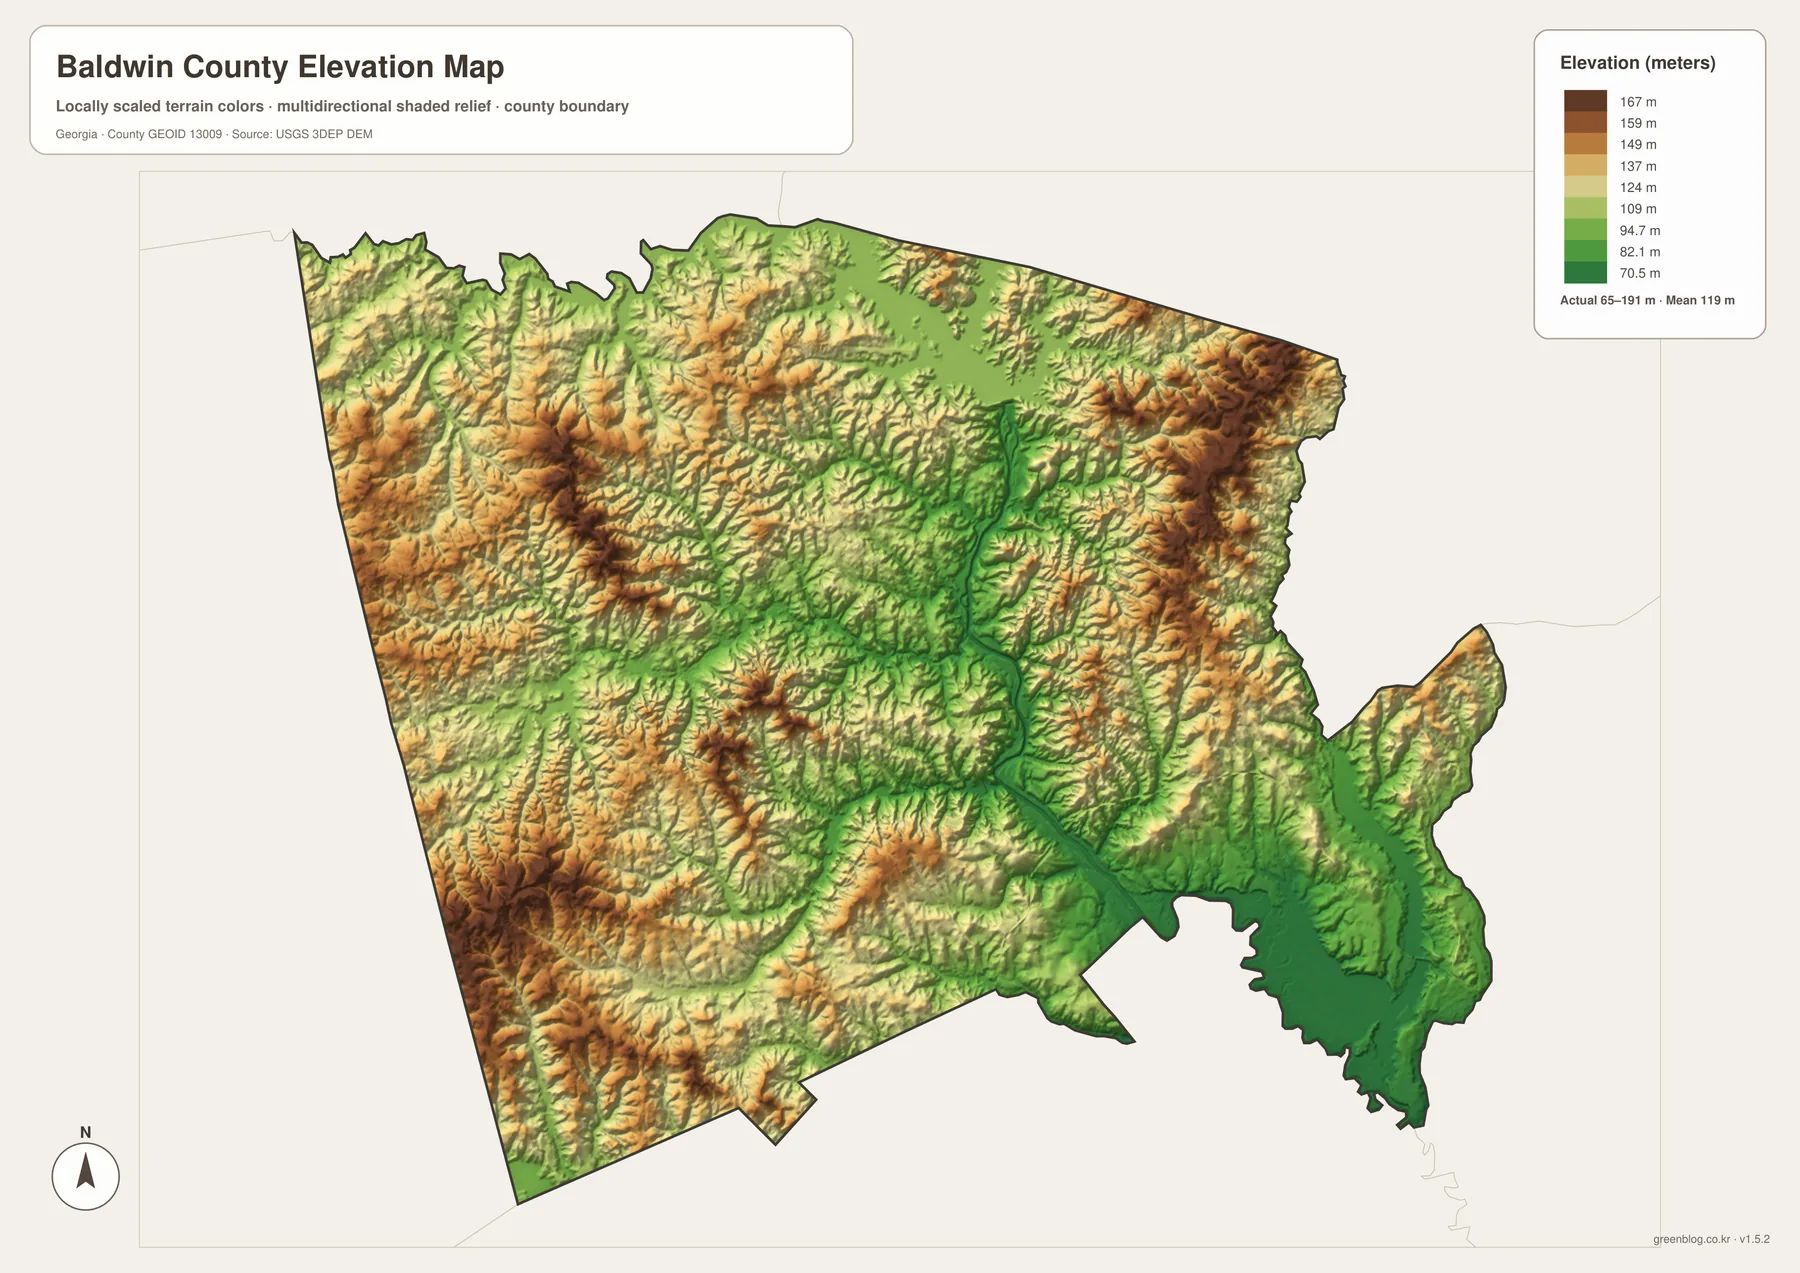
The shaded surface makes the county’s numerous short ridges and valleys much easier to see than on the road map. Western Baldwin County contains many narrow, closely spaced rises. Similar higher ground appears along parts of the eastern side. In contrast, lower green corridors cut through the interior and converge toward the southeast. The pattern explains why the county water map contains so many separate creek names: each drainage occupies a valley between surrounding uplands.
Lake Sinclair also makes more sense when viewed against the relief. The northern reservoir arms extend into valleys that were already cut into the landscape, so the shoreline follows branching low ground. Farther south, the terrain becomes a mix of broader low areas and isolated ridges rather than one continuous slope. Pairing the elevation and water maps is therefore useful for a physical-geography lesson because one shows the height differences and the other shows the water features occupying many of the lower corridors.
The elevation colors should be read as a generalized county surface. They are appropriate for comparing higher and lower parts of Baldwin County, but they are not survey-grade measurements for a building site, drainage design, road engineering, or property decision. Anyone who needs exact point elevations should consult source elevation data such as the USGS 3D Elevation Program or obtain a professional survey.
County Facts That Help Explain the Maps
| State | Georgia |
|---|---|
| County seat | Milledgeville |
| Created | 1803 |
| 2020 population | 43,799 |
| Land area | 258.70 square miles |
| 2020 density | 169.3 people per square mile |
| FIPS code | 13009 |
| Download set | Four high-resolution A3 JPG maps in one ZIP |
The current county material cites a 2020 population of 43,799, 258.70 square miles of land, and a density of 169.3 people per square mile. Baldwin County was established in 1803 and was named for Abraham Baldwin, a Georgia statesman and signer of the U.S. Constitution. These facts provide useful background, but the maps make the county’s internal arrangement easier to understand: a concentrated civic center around Milledgeville, a reservoir-shaped north, a dense creek network, and rolling terrain across the interior.
The Fall Line context described in the supplied article is also relevant. Milledgeville developed at the Oconee River crossing near the transition between Georgia’s Piedmont and Atlantic Coastal Plain. That broad transition helps explain why rolling uplands and lower southern terrain can occur within a relatively small county. The elevation map gives a direct visual version of that contrast, while the water map shows the drainage that follows the lower ground.
History, transportation, and natural geography overlap closely here. Milledgeville’s former role as the state capital explains the concentration of historic civic sites. US 441 and several state routes continue to converge near the city, reinforcing its central position. Lake Sinclair adds a large recreation and residential shoreline to the north, while creeks and ridges dominate much of the remaining county. A reader can therefore use the four maps to move from a simple political outline to a more complete picture without forcing every type of information onto one crowded image.
Choosing the Right Map for a Lesson, Report, or Reference
For a basic location page, start with the county overview. It is the only version that combines Milledgeville, selected communities, major highways, public-building labels, streams, and the county outline in one view. If the topic is settlement, the city map removes much of that detail and places Milledgeville against the neighboring counties. A water-focused project is better served by the named-creek map, while the elevation version is the strongest choice for discussing ridges, valleys, and the relationship between relief and drainage.
- County orientation: use the boundary and road map to place Milledgeville and the main travel directions.
- Settlement pattern: use the city map when the point is Milledgeville’s dominance within the county rather than local street detail.
- Water features: use the terrain-and-water map for Lake Sinclair, Lake Laurel, Gum Pond, and the named creek network.
- Physical relief: use the elevation map to compare the approximately 65–191 m range and the distribution of ridges and lower valleys.
Two-map combinations can be especially effective. The county map plus the city map works well for a history or civics presentation centered on Milledgeville. The water map plus the elevation map is better for environmental or physical-geography material because the lower valleys can be compared directly with the creek network. If all four are used in one project, give each image a distinct caption and purpose so the reader sees new information on every page rather than four versions of the same description.
Frequently Asked Questions
Where is Milledgeville on the Baldwin County maps?
Milledgeville appears slightly north of the county’s center and is the clearest urban label on the map set. US 441 and several state routes meet near the city, and the county overview also marks the courthouse and sheriff’s office nearby. Lake Sinclair is generally to the north and northeast, while Hardwick lies south of the city.
Can the water map be used as a flood-risk map?
No. It is a county-scale reference showing named lakes, ponds, and streams over terrain. It does not contain flood-zone boundaries, predicted water depth, current conditions, parcel data, or site-specific risk. Use an official flood resource for those questions.
Is the elevation map accurate enough for surveying or engineering?
No. The map is intended to compare broad relief across Baldwin County and shows an approximate actual range of 65–191 meters. Exact design elevations, construction decisions, property surveys, and engineering work require the original elevation data or professional field measurements.
Related Maps
Sources and References
- U.S. Census Bureau QuickFacts — Baldwin County population, area, density, and FIPS
- New Georgia Encyclopedia — Baldwin County history and county background
- Georgia Department of Community Affairs — Baldwin County and Milledgeville comprehensive planning
- USGS National Hydrography — water-feature reference data
- USGS 3D Elevation Program — elevation reference data
- Explore Georgia — Lake Sinclair overview
Green Map creates custom-edited map images using open geographic data sources such as geoBoundaries, Natural Earth, OpenStreetMap, and government open data. These maps are edited visual materials, not raw data files, and are provided for education, documents, presentations, and graphic reference.