Baker County in southwest Georgia is easiest to understand by starting at Newton, the county seat pressed against the Flint River side of the eastern boundary. This page pairs that location story with four different map views: a county-and-road map, a city distribution map, a terrain-and-water map, and an elevation map. The original files are also available as one ZIP download containing four high-resolution A3 JPGs, so the maps can be used for printing, classroom work, reports, or offline reference without relying on the smaller web previews.
The maps show a county with very little urban concentration but a surprisingly detailed network of roads, creeks, ponds, and low relief. Georgia Routes 37, 91, and 200 come together around Newton, while route shields 53 and 253 appear farther south. The water layer names several small creeks and ponds across the western and central portions of the county, and the elevation surface reports an actual range of about 30 to 77 meters with a mean near 51 meters. Those numbers are modest, yet the shaded surface makes the low corridors beside streams and the relatively higher western ground much easier to see.
Table of Contents
Newton, the Flint River edge, and the county road pattern
The general county map makes Newton the clearest reference point. The city sits almost on the irregular eastern boundary, where the existing county material identifies the Flint River as the major boundary feature between Baker and Mitchell counties. Georgia 37 reaches Newton from the west and northwest, Georgia 91 runs north from the area, and Georgia 200 approaches from the west. Together they make the small county seat a practical road junction even though most of Baker County remains rural. The southern part of the map also shows route shields 53 and 253, giving another north-south reference for the long southern extension of the county.
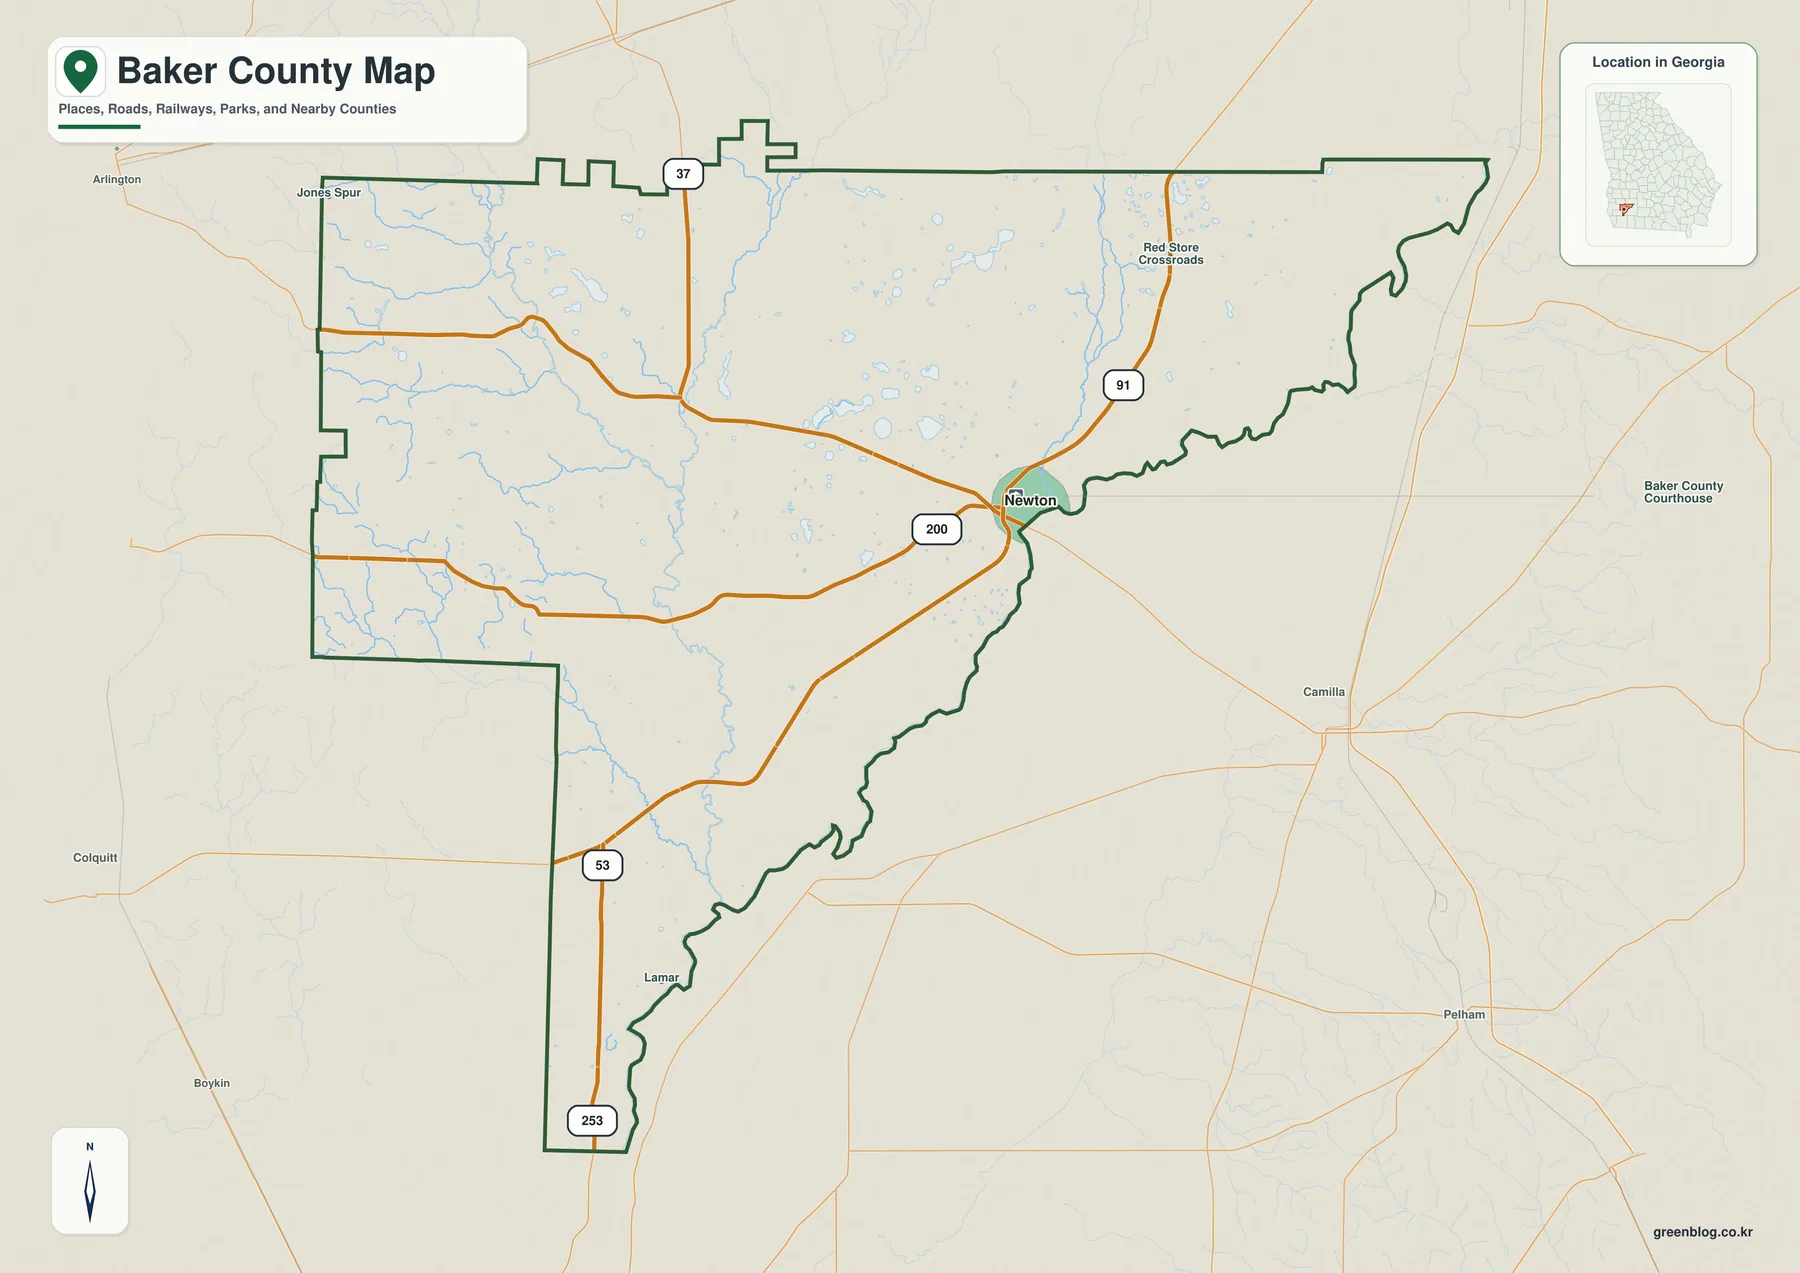
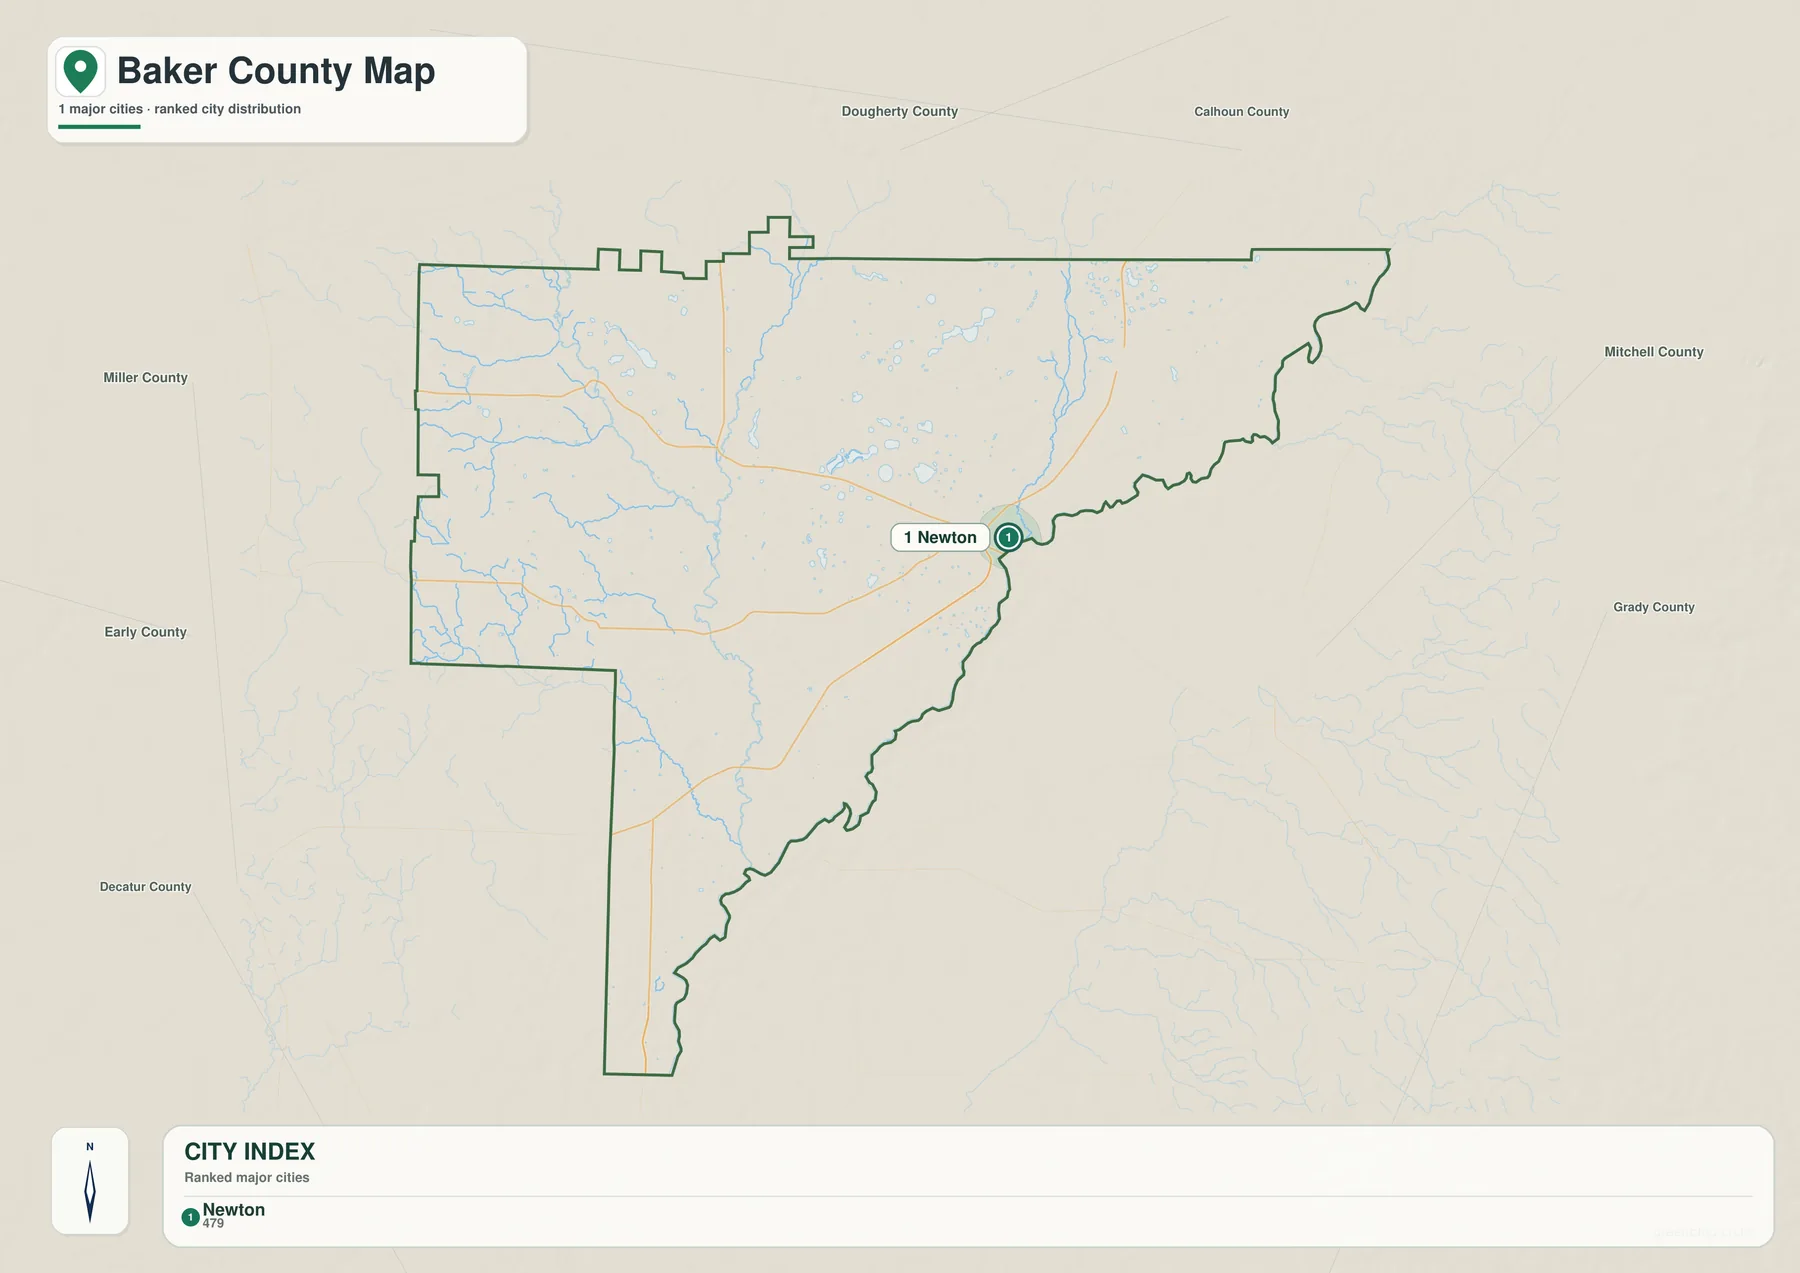
The surrounding-county context helps explain why Newton can feel visually off-center. Baker County borders Dougherty County to the northeast, Mitchell County on the east, Decatur County toward the southwest, Early and Miller counties on the west, and Calhoun County on the northwest according to the supplied county material. On the broader city view, those names surround a large, lightly settled outline with Newton placed on the river side rather than in the geometric middle. This is useful when comparing Baker County with counties built around a central city grid: here, the river crossing and historic boundary changes matter more than a compact urban core.
The current shape also reflects nineteenth-century county formation. The supplied article material states that Georgia created Baker County from Early County in 1825 and named it for Revolutionary War figure Colonel John Baker. The original jurisdiction was considerably larger. Later divisions created all or parts of Calhoun, Dougherty, Miller, and Mitchell counties, leaving Newton much closer to today’s eastern edge than it had been when it became the county seat in 1831. That background turns the unusual map position from an oddity into a visible result of administrative history.
One major city marker across a broad rural county
The city distribution map reduces Baker County’s settlement pattern to a single ranked major-city marker: Newton. The city index at the bottom of the supplied preview lists Newton alone, while most of the county polygon stretches west and south without another comparable city label. That does not mean the landscape is empty. It means the county has a very small incorporated urban footprint, with farms, timberland, private holdings, roads, and smaller communities occupying most of the area outside the seat. The existing county material also identifies Newton as Baker County’s only incorporated city.
Why Newton matters more than its size suggests
Newton combines county government, a Flint River crossing, and several road connections in one small place. That combination is why it stands out so strongly on both the city map and the general map. The city view tells you where the dominant settlement marker is; the road map explains why that marker carries so much geographic weight. When the two are read together, Baker County looks less like a county missing towns and more like a wide rural jurisdiction organized around one small seat on its eastern side.
The river has also shaped Newton’s civic history. The supplied county article notes that floods damaged the old courthouse in 1925, 1929, and 1994, and that another flood affected parts of Newton in 1998. Baker County later converted a 1930s school building into a courthouse. Those events should not be read as a flood-hazard layer—the maps on this page do not show flood zones—but they explain why the relationship between the town and the river is more than a boundary detail. Anyone evaluating present-day flood risk for a property should use current official flood information rather than this county reference map.
Creeks and ponds across the western and central lowlands
The terrain-and-water map adds detail that the road map intentionally leaves quiet. In the northwest, Caney Creek and Mill Creek are labeled near the upper boundary, with Alligator Creek farther south. Chickasawhatchee Creek runs through the north-central area, while Cooleewahee Creek appears on the eastern side of the interior. Farther south and west, Little Cypress Creek and Big Cypress Creek provide additional named drainage lines. Instead of one dominant internal river, the map shows many smaller channels dividing the broad lowland landscape.
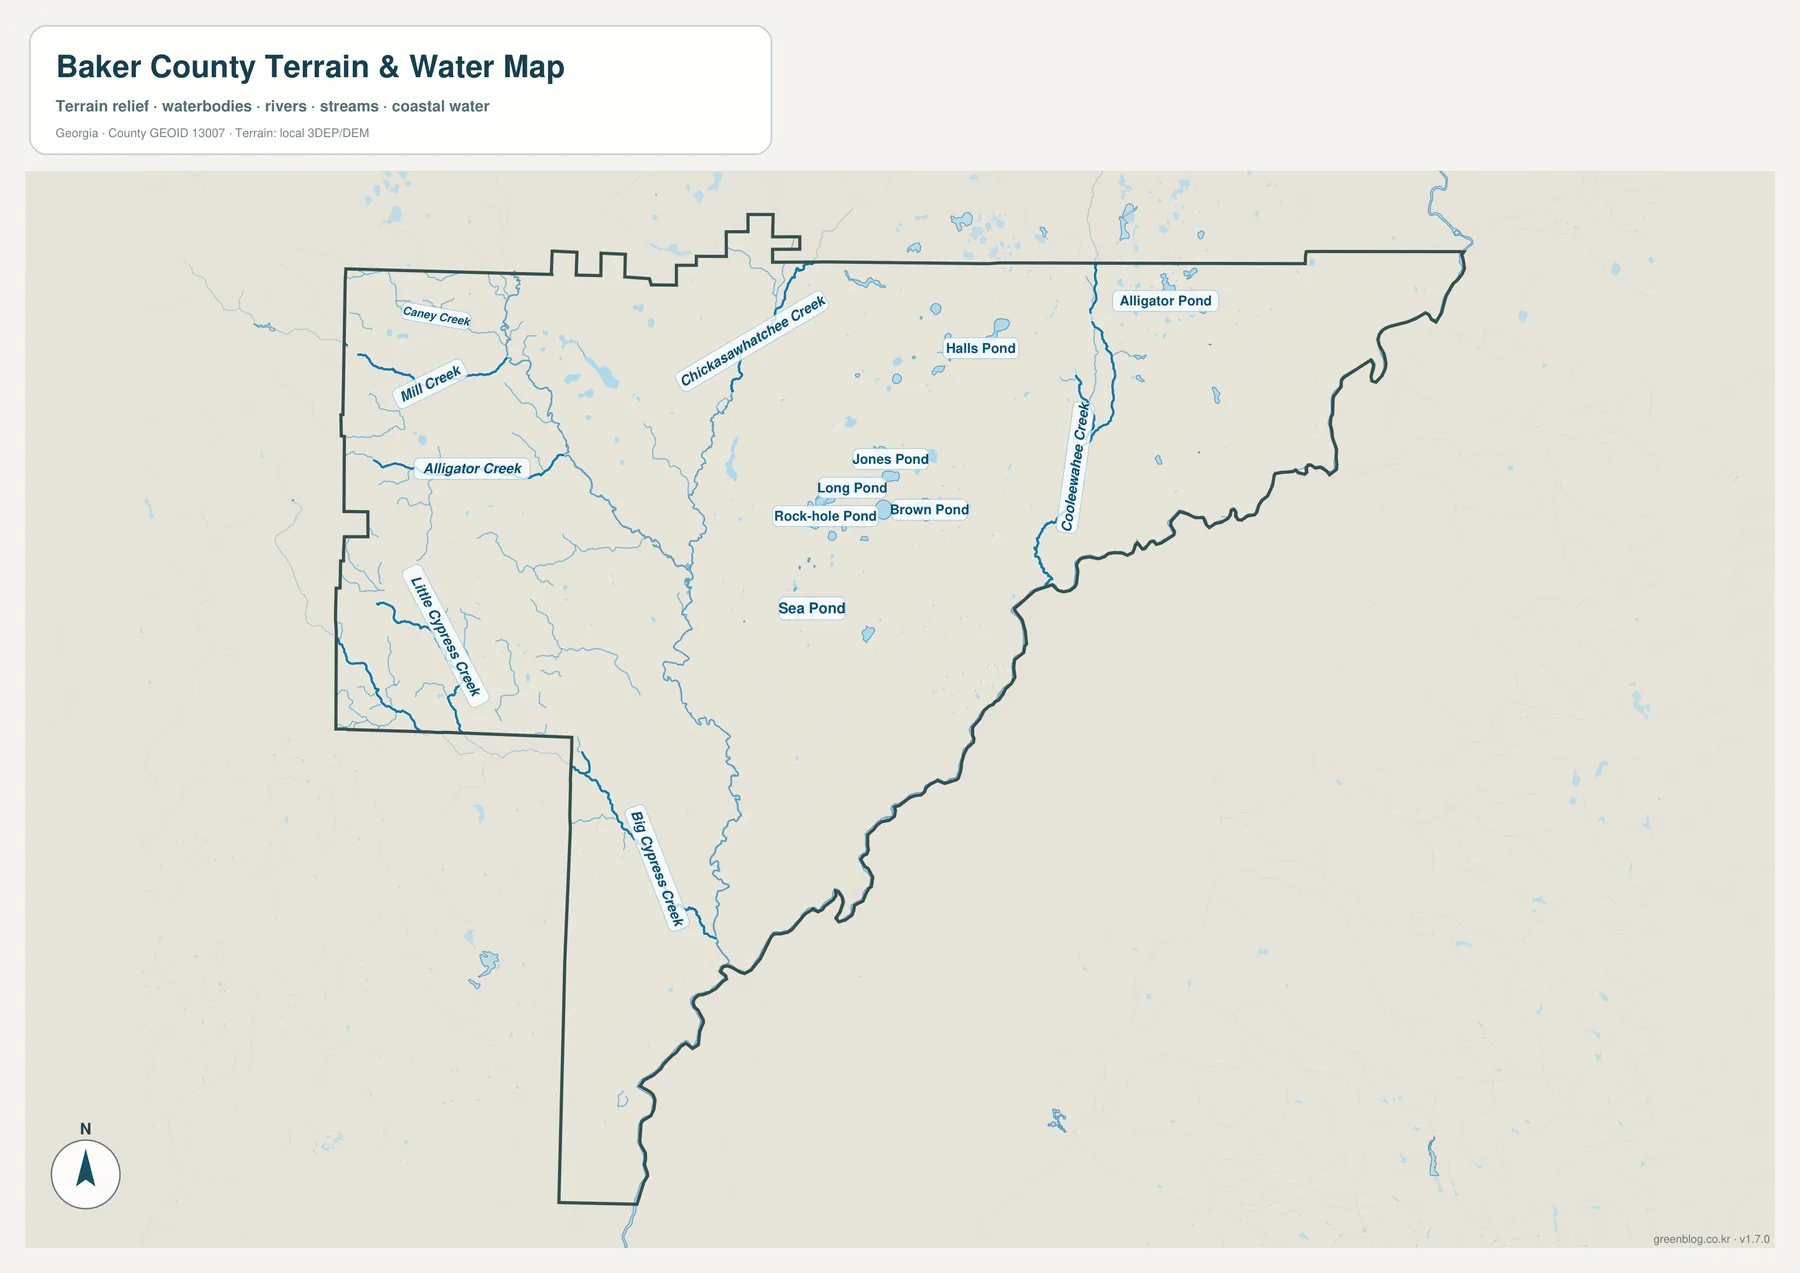
Several named ponds are clustered around the center and northeast of the county. Halls Pond lies north of the central cluster, while Jones Pond, Long Pond, Brown Pond, and Rock-hole Pond appear relatively close together. Sea Pond sits farther south, and Alligator Pond is labeled toward the northeast. These water bodies are useful reference points because they make the map more specific than a generalized “wet rural county” description. At the same time, the layer is a county-scale water reference, not a legal wetland map, property map, navigation chart, or flood-risk product.
The existing county material places Baker County within the larger Apalachicola–Chattahoochee–Flint system, with the eastern portion tied to the Lower Flint and the western portion associated with Ichawaynochaway Creek drainage. It also highlights the Jones Center at Ichauway southwest of Newton, where a roughly 29,000-acre research property includes longleaf pine, wetlands, streams, and Flint River frontage. The supplied water preview does not draw the research-property boundary, so it should not be used to locate Ichauway parcels. It does, however, show the kind of creek-and-pond landscape that makes water ecology an important part of Baker County’s geography.
A 30–77 meter elevation range across gentle terrain
The elevation map confirms that Baker County is low and gently rolling rather than mountainous. Its legend reports an actual county range of about 30 to 77 meters and a mean elevation near 51 meters. Brown and tan shades are more common along parts of the western and northwestern side, while green shades follow lower ground near the eastern boundary and several stream corridors. The locally scaled colors make small differences visible, so a shift from brown to green should not be mistaken for the kind of steep elevation change seen in a mountain county.
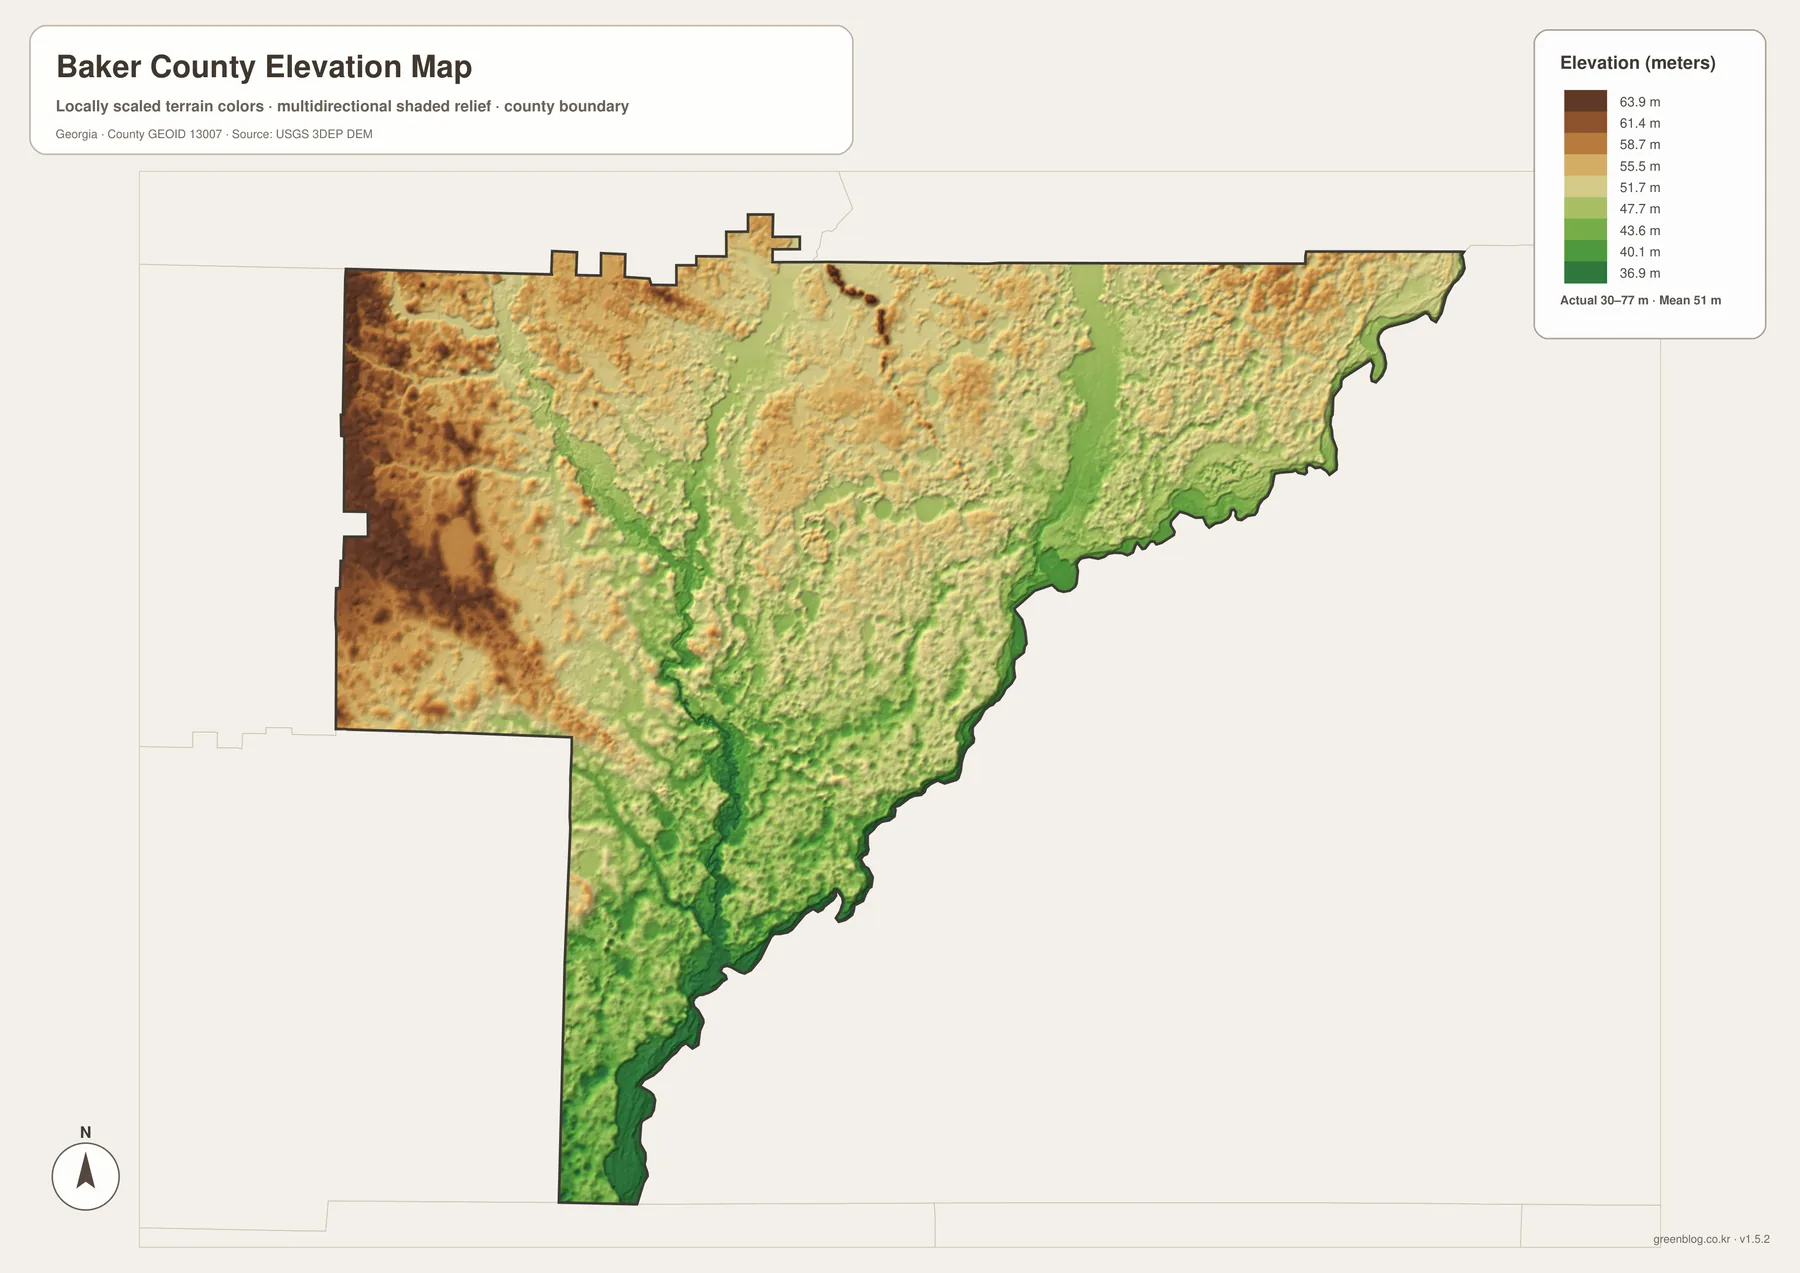
Reading the elevation and water maps together is especially useful. The greener low strips often align with creeks, while broader tan areas sit above those drainage corridors. This makes it easier to see how a county that appears almost flat at regional scale still contains enough local relief to guide small streams and wet depressions. The relationship is descriptive rather than engineering-grade: the map is intended to explain county terrain, not to provide a surveyed height for a road, building site, farm field, or bridge.
For exact elevation work, the underlying source should be checked at a finer scale. The supplied map identifies USGS 3DEP DEM data as its elevation source, and the source section below links to the broader USGS 3D Elevation Program. That is the right path when a project requires current, detailed elevation information. On this page, the shaded map is best used for comparing the relatively higher west with the lower river-and-creek corridors and for explaining why drainage features remain important in such a low-relief county.
Choosing the right map for print, class, or reference work
The four maps answer different practical questions without forcing every detail onto one crowded image. Use the county map when you need the outline, Newton, and road orientation. Use the city map when the topic is settlement concentration and the unusual position of the county seat. The water map is the clearest choice for named creeks and ponds, while the elevation map is better for comparing the low stream corridors with slightly higher ground. Moving between them makes the county easier to explain because each map keeps one type of information visually dominant.
- Boundary and road context: compare Newton with Georgia 37, 91, and 200 and use the southern route shields as additional orientation points.
- Settlement pattern: show how the single major-city marker for Newton sits against a much larger rural county outline.
- Water features: locate Chickasawhatchee Creek, Cooleewahee Creek, the Cypress Creek branches, and the named ponds without treating the map as a flood or property product.
- Terrain comparison: use the 30–77 meter elevation surface to distinguish relatively higher western ground from lower stream and river corridors.
A classroom presentation can start with the county map, then switch to the city layer to discuss why Newton appears so isolated. A physical-geography lesson may work better in the opposite order: begin with the water and elevation maps, then add roads and settlement to show how people occupy a low, creek-cut landscape. A local-history project can use the boundary map to explain how nineteenth-century county divisions left Newton close to the eastern edge. For a printed handout, selecting only the one or two map types that match the topic usually produces a clearer result than trying to place all four on a single page.
Frequently Asked Questions
Why is Newton so close to Baker County’s eastern boundary?
The supplied county history explains that Newton became the seat in 1831 when Baker County covered a larger area. Later county divisions created or contributed to Calhoun, Dougherty, Miller, and Mitchell counties, leaving Newton much closer to the modern eastern edge. The general map also shows why the location still works as a county center: major roads converge there beside the Flint River boundary.
Why does the water map label so many small creeks and ponds?
The purpose of this layer is to make Baker County’s internal water features visible at county scale. Chickasawhatchee Creek, Cooleewahee Creek, the Cypress Creek branches, and several named ponds are distributed across the interior, while the Flint River remains the major eastern boundary feature in the broader county geography. The map is useful for orientation and environmental context, but it does not define flood zones, wetlands, ownership, or navigable waters.
Can the elevation map be used for surveying or site design?
No. The elevation preview generalizes the county at a broad scale and uses locally scaled colors to make a modest 30–77 meter range easier to see. It is suitable for comparing low creek corridors with somewhat higher ground, not for determining a precise site elevation, construction grade, flood level, or engineering measurement. Detailed work should use current source elevation data and appropriate survey information.
Map File Information
Baker County A3 map files
- Included Files: Map files described on this page
- File Type: ZIP archive
- Intended Use: Printing, education, presentations, and map-based projects
Related Maps
Sources and further reference
For county population and general statistics, see the U.S. Census Bureau QuickFacts page for Baker County. Historical background on county formation and Newton is available from the New Georgia Encyclopedia county profile. Local planning records can be checked through the Georgia Department of Community Affairs comprehensive plan, and ecosystem context for the Ichauway property is available from the Jones Center at Ichauway.
For the types of public data behind county mapping, the U.S. Census Bureau TIGER/Line Shapefiles provide boundary and road geography, USGS National Hydrography covers water features, and the USGS 3D Elevation Program provides elevation data. The maps on this page are designed for county-scale orientation; property, flood, navigation, survey, or engineering decisions should rely on the most current authoritative source for that specific purpose.
Green Map creates custom-edited map images using open geographic data sources such as geoBoundaries, Natural Earth, OpenStreetMap, and government open data. These maps are edited visual materials, not raw data files, and are provided for education, documents, presentations, and graphic reference.