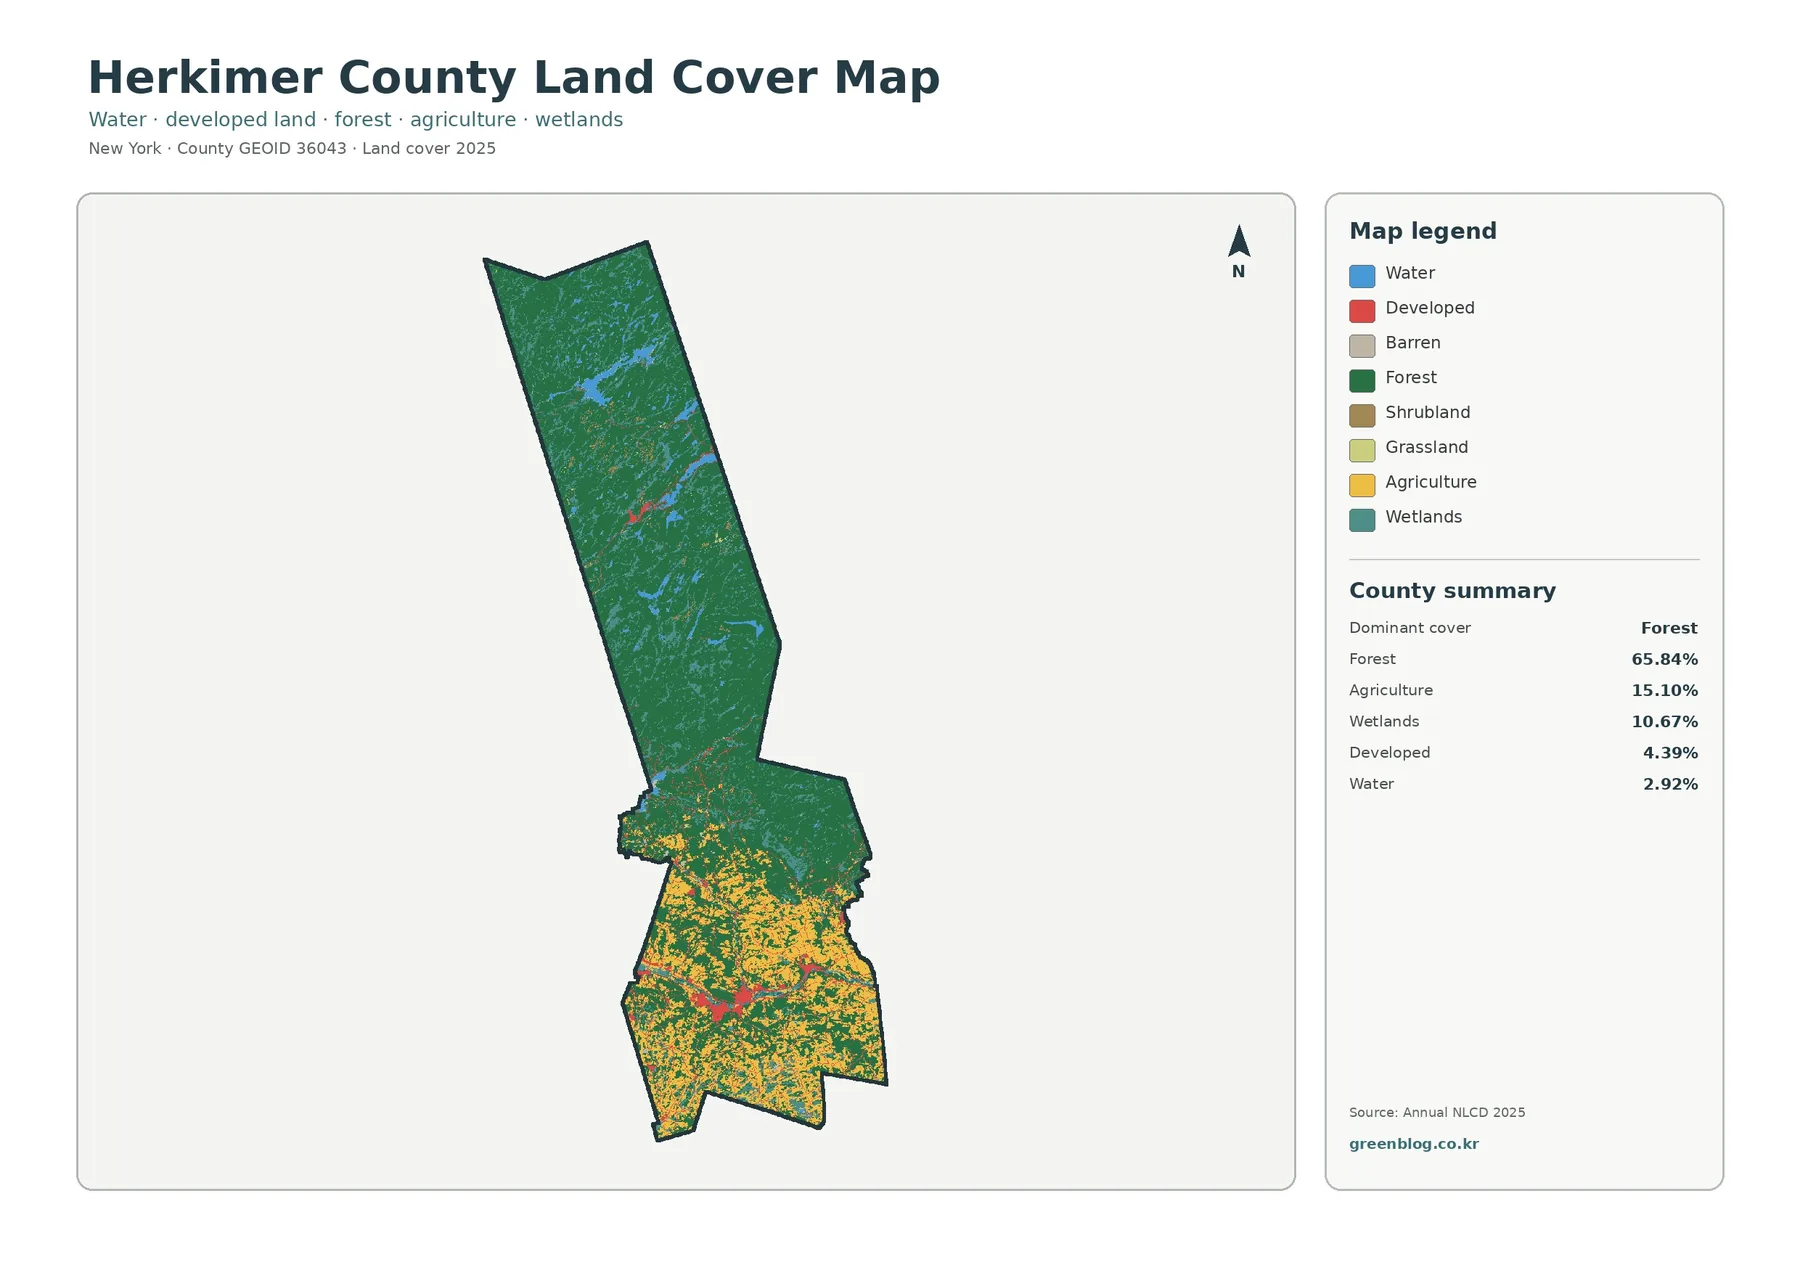
The Herkimer County New York Land Cover Map set makes the county’s north-to-south contrast easy to see. Forest covers 65.84% of the county in the 2025 summary and dominates much of the long northern section, while farmland and developed land become far more common toward the south. Wetlands and water also break up the northern forest in many places.
Four views are included: general land cover, forest and farmland, impervious surface, and mapped land-cover differences from 1985 to 2025. The WebP images on this page are designed for quick viewing, while the four original JPG maps are available together in one ZIP download for printing, classwork, presentations, and side-by-side reference.
Table of Contents
A county with two very different land-cover settings
Herkimer County stretches a long distance from north to south, and the land-cover pattern changes noticeably along that length. In the upper part of the county, broad forest cover forms the main visual field, with water and wetlands scattered through it. Farther south, yellow agricultural areas become much more frequent. Developed land remains a small share of the county overall, but it is easier to pick out in the southern part because it appears among the farms and other open areas rather than inside an almost continuous forest setting.
The 2025 summary lists forest at 65.84%, agriculture at 15.10%, wetlands at 10.67%, developed land at 4.39%, and water at 2.92%. Those percentages are useful, but the map adds an important second layer of information: the classes are not distributed evenly. Most of the agricultural cover sits in the southern portion, while the north contains much larger blocks of forest, wetlands, and water. Reading both the totals and the location of each class gives a more accurate picture of the county.
Forest dominates the north while farming expands in the south
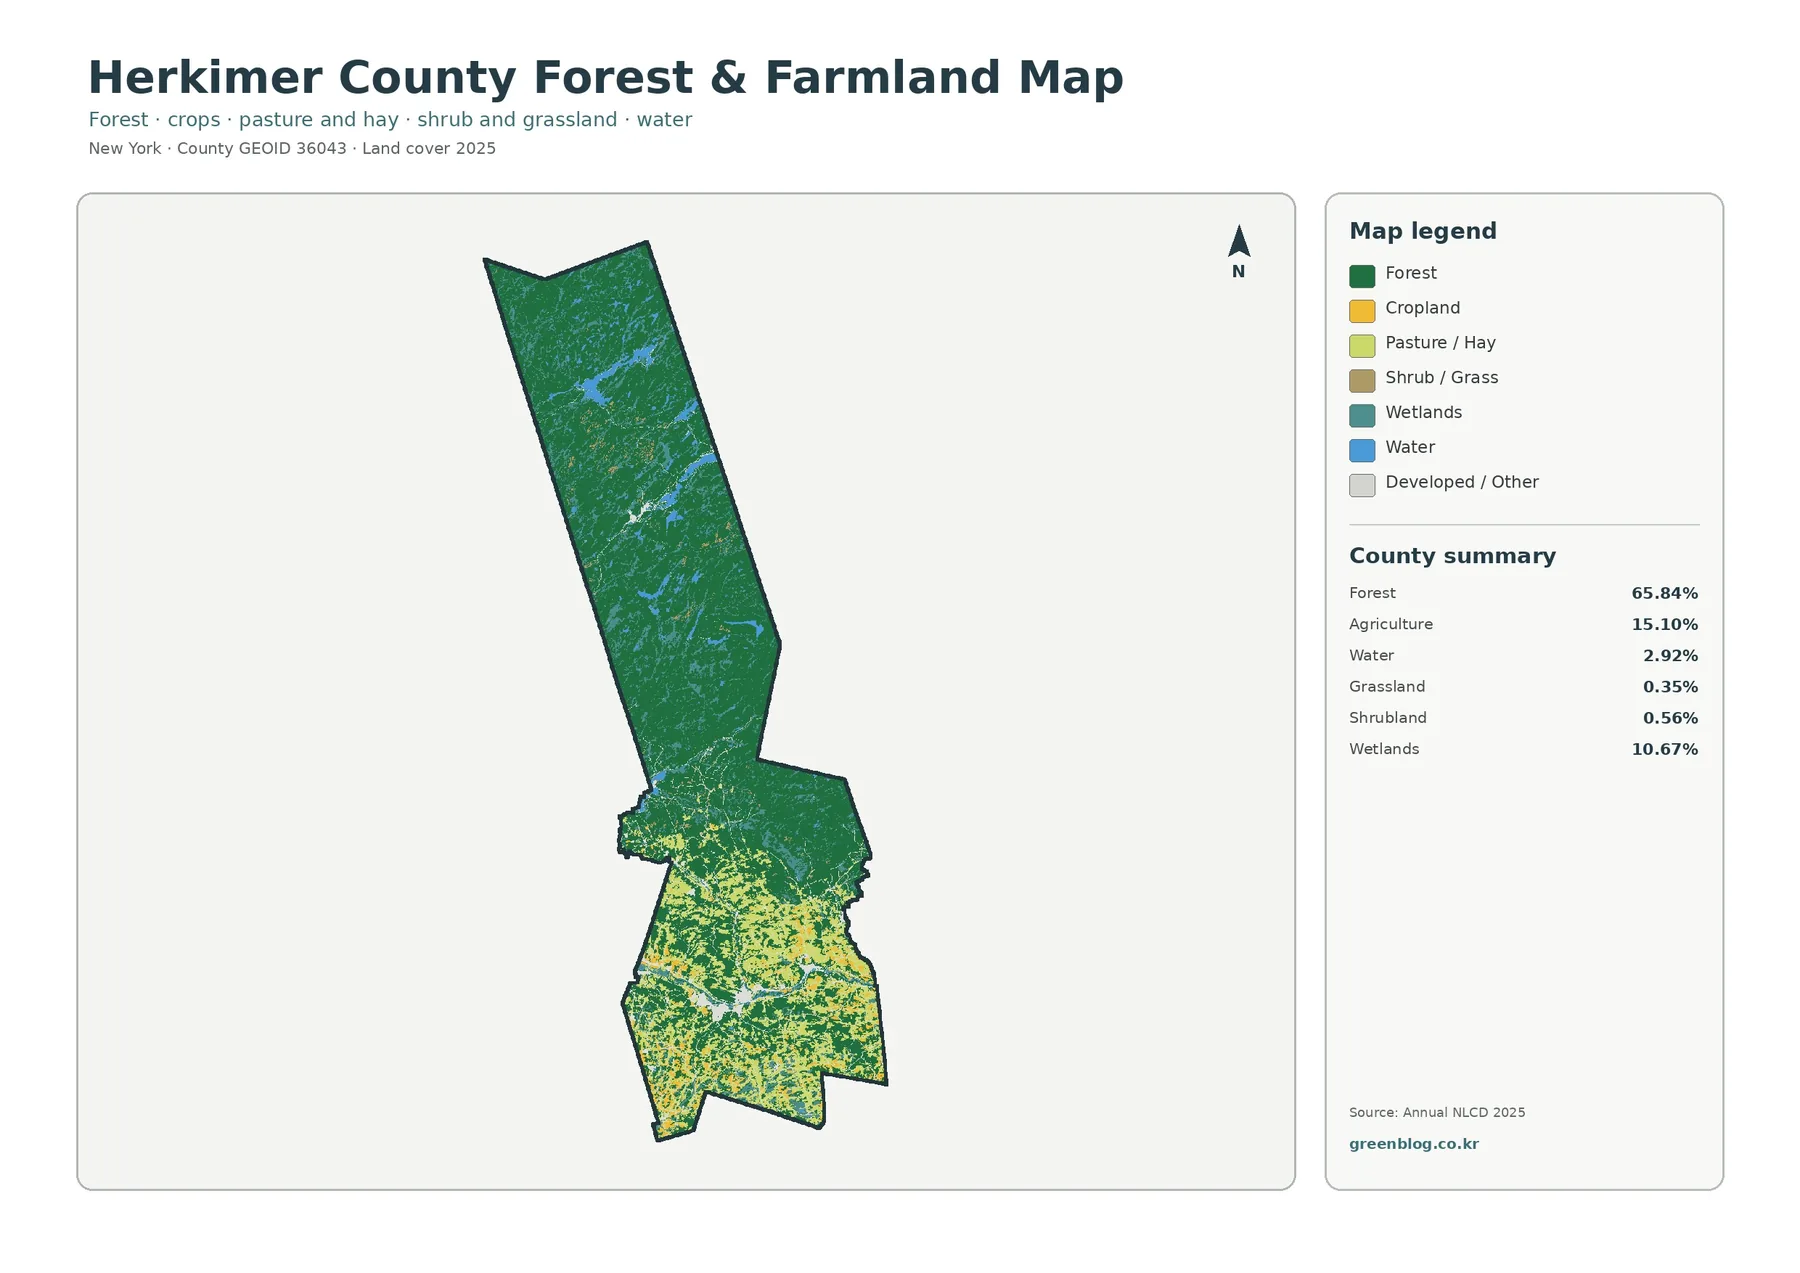
On the forest-and-farmland view, the county’s main contrast becomes especially clear. Dark green forest occupies most of the northern section, where cropland and pasture are comparatively limited. In the south, agricultural cover spreads across many more patches and often sits directly beside remaining forest. The countywide agriculture figure is 15.10%, yet its concentration in one part of the county makes farming much more visually prominent there than the total percentage alone might suggest.
Wetlands account for 10.67%, a substantial share that is easy to overlook if attention stays only on forest and farmland. Many wetland areas appear within the forested northern landscape, and water makes up another 2.92%. Although open water occupies a much smaller percentage, blue shapes and narrow features stand out strongly against the green background. Together, these classes show that the north is not simply one unbroken block of forest.
Grassland is listed at 0.35% and shrubland at 0.56% on the forest-and-farmland map. Their shares are small, so they do not control the overall appearance, but they help explain some of the lighter patches between larger forest and agricultural areas. This is one reason a simplified forest-and-farm view can be useful: it keeps the main pattern obvious while still leaving smaller natural cover types visible in the legend.
Impervious surfaces reveal a compact development pattern
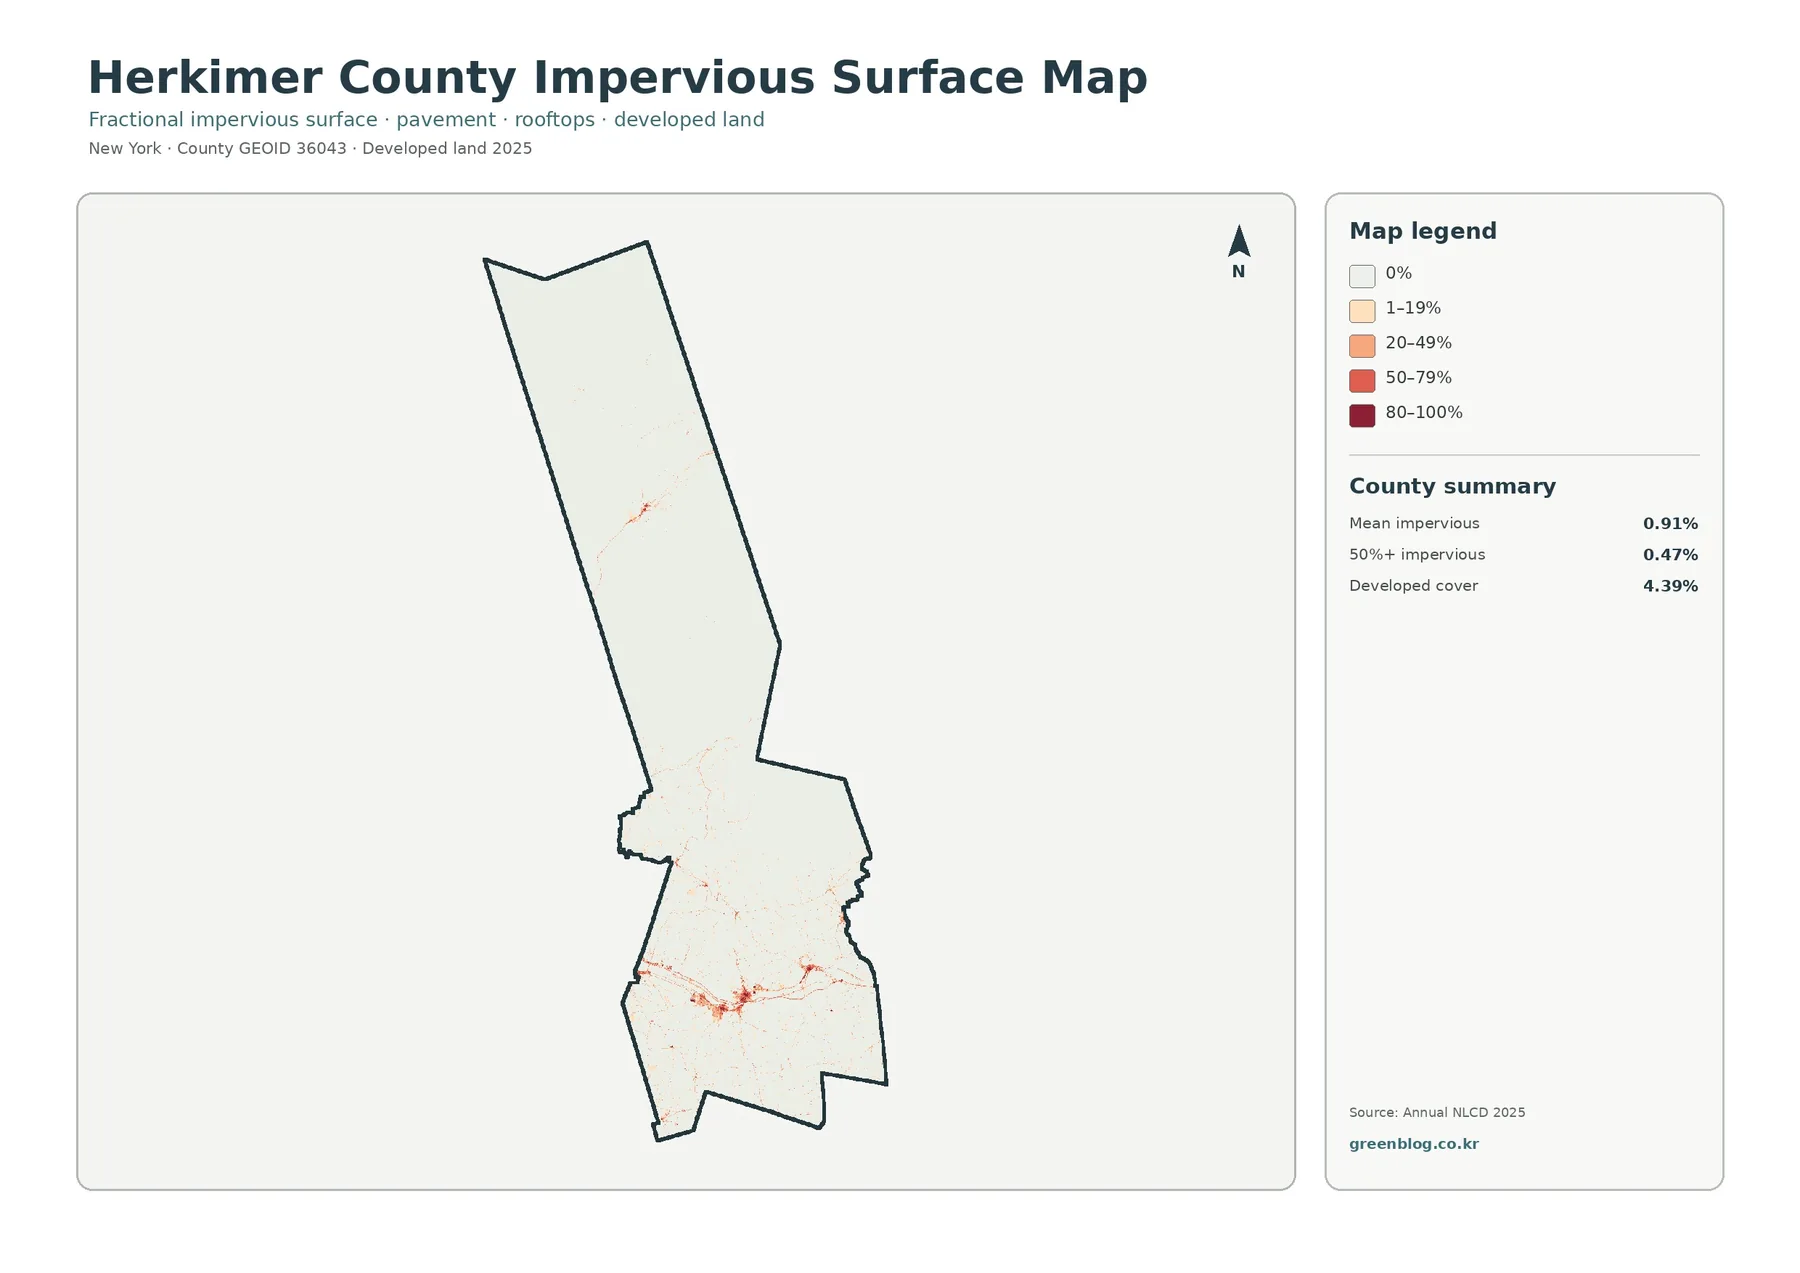
Developed cover makes up 4.39% of the county, so it can look minor on the general land-cover map. The impervious-surface view is better suited to seeing where harder surfaces are concentrated. Impervious surface means pavement, rooftops, parking areas, and similar surfaces where rain does not soak into the ground easily. Instead of showing only a single developed-land class, this map groups cells by the percentage of impervious cover.
Herkimer County has a mean impervious value of 0.91%, while areas with at least 50% impervious cover account for 0.47%. Most of the long northern section is nearly blank on this map, which indicates very low impervious coverage at this scale. More colored lines and clusters appear in the south, including one especially noticeable east-west concentration. Smaller patches also occur farther north, but they are sparse compared with the southern pattern.
This map is useful when the general developed-land class is too broad for the question at hand. A viewer comparing natural cover with built surfaces can quickly separate places dominated by forest or farmland from places where pavement and rooftops form a larger share of the mapped cell. It should not be treated as a parcel map, however. A colored cell does not provide the exact outline of an individual road, building, parking lot, or property.
What the 1985–2025 difference map actually means
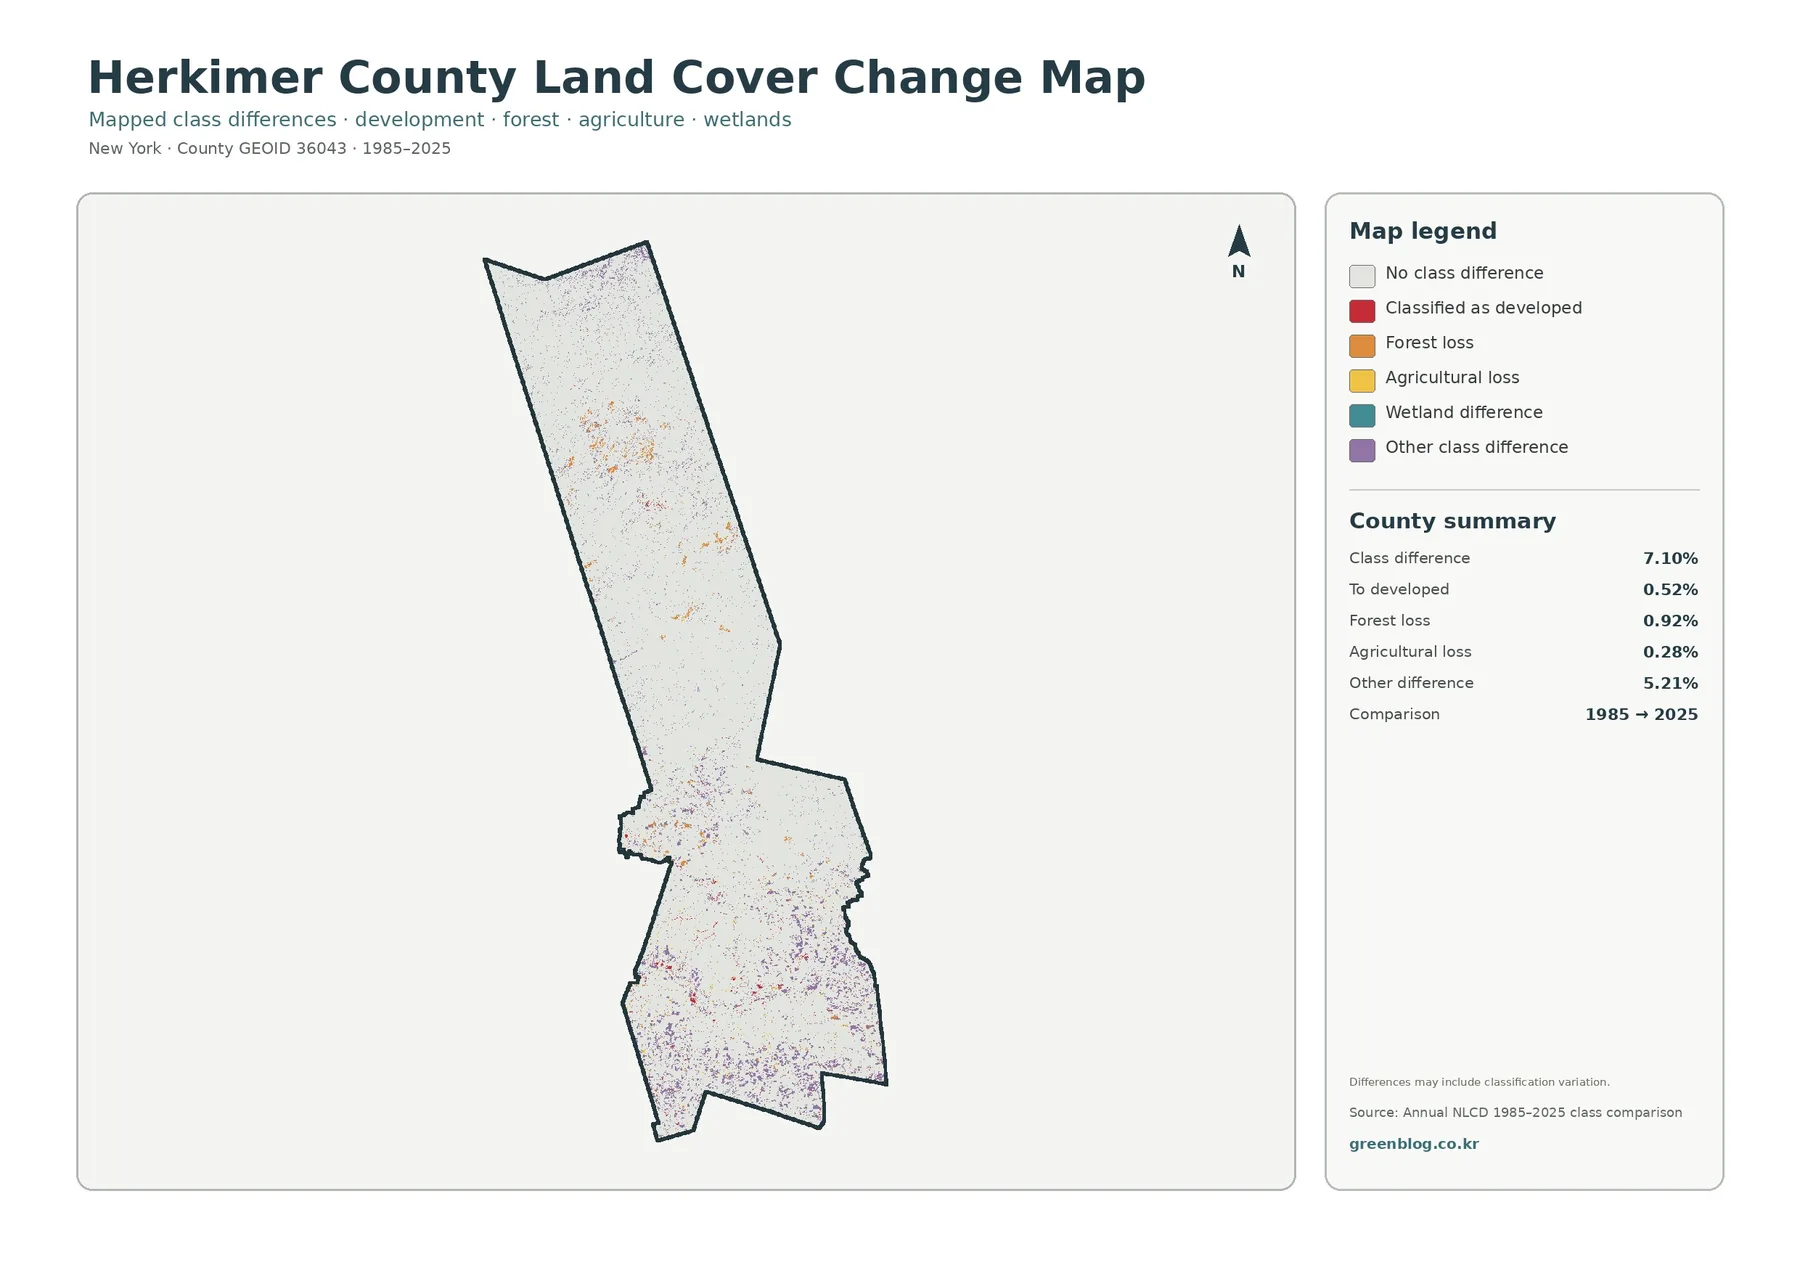
The change view compares mapped land-cover classes from 1985 and 2025. A class difference is shown across 7.10% of the county. The summary identifies 0.52% as classified to developed, 0.92% as forest loss, 0.28% as agricultural loss, and 5.21% as other class differences. Colored marks occur in both northern and southern parts of the county, although the south contains denser areas of several difference categories.
That 7.10% figure should not be read as proof that exactly 7.10% of the county physically changed in a simple, one-directional way. The map itself notes that differences may include classification variation. Annual land-cover products classify raster cells, which are grid squares used to represent the surface. A cell may contain more than one real-world cover type, and differences in imagery or classification can affect how a cell is labeled from one period to another.
For practical use, the difference map works best as a screening layer. It can point to areas worth comparing more closely, especially when a cluster of colored cells appears in a place that matters to a local study. Confirming why a specific site changed would require additional imagery, local records, or field information. The map is therefore strong for finding patterns, but it is not a substitute for a site history.
How the four maps complement one another
Start with the general land-cover map when you need a quick overview. It keeps water, developed land, forest, agriculture, wetlands, and smaller classes together, so the countywide arrangement is visible at once. The forest-and-farmland map is more focused. By simplifying the emphasis, it makes the northern forest and southern agricultural concentration easier to compare without the developed-land colors drawing as much attention.
For questions about built surfaces, switch to the impervious map. Its stepped percentages reveal concentrations that can be difficult to judge from a single developed-land category. The difference map answers a different question again: instead of describing only the present landscape, it shows where the mapped class in 1985 does not match the class in 2025. Using the four views together prevents one map from being asked to do a job it was not designed to do.
A simple classroom exercise illustrates the value of comparison. First, identify a large forest block on the general map. Then check the same area on the forest-and-farmland view, followed by the impervious map. A place that remains dark green and nearly blank on the impervious layer represents a very different mapped setting from a southern area where agriculture, developed cover, and impervious cells appear close together. The exercise uses visual evidence without requiring advanced GIS software.
Useful ways to work with the JPG map set
The maps can serve as reference material for lessons, presentations, regional comparisons, and printed handouts. When printing, it can be helpful to keep the four sheets together so the same part of the county can be checked across different themes. A student might compare where agriculture appears with where impervious cover is present. A researcher preparing an initial overview could use the change map to identify locations that deserve a closer look in another dataset.
These maps are not zoning, ownership, legal land-use, or parcel maps. Land cover describes what the surface is classified as—forest, agricultural cover, water, wetlands, developed land, and related classes. It does not tell you what a parcel is legally permitted to be used for or who owns it. Anyone making property, construction, or regulatory decisions should use the appropriate official local records rather than relying on a land-cover image.
Download the four Herkimer County JPG maps
The download contains four original JPG files: the general land-cover map, forest-and-farmland map, impervious/developed-land map, and the 1985–2025 land-cover difference map. They are packaged in one ZIP so the complete set can be saved and compared offline.
Use the JPG files when you need a larger image than the page preview, especially for print layouts or presentations. If you compare them with land-cover products from another year or provider, check the class definitions and dates first. Similar colors or class names do not always mean two datasets were produced with exactly the same method.
Reading the maps without over-interpreting them
Raster-based land-cover maps generalize the landscape into cells. Boundaries between forest, farmland, wetlands, and developed land can therefore look more regular or more abrupt than they do on the ground. Narrow roads, small buildings, stream edges, and mixed vegetation may also be simplified. The maps are best for county-scale patterns rather than exact site boundaries.
Scale matters as well. A feature that looks tiny on a countywide map may still cover a meaningful area locally, while a large colored patch may contain internal variation that cannot be seen at this zoom level. The percentages provide a useful summary, but they should be paired with the visual distribution rather than used alone. In Herkimer County, the 15.10% agriculture figure is a good example because most of that cover is concentrated in the southern part instead of being spread evenly from north to south.
Frequently Asked Questions
What is the dominant land-cover class in Herkimer County?
Forest is the dominant class at 65.84% in the 2025 summary. It is especially extensive across the northern portion of the county.
Where is most of the agricultural land shown?
Agriculture accounts for 15.10% and is concentrated mainly in the southern part of the county. The northern section is much more strongly dominated by forest, wetlands, and water.
What does the impervious-surface map measure?
It shows the share of mapped cells covered by hard surfaces such as pavement and rooftops. Herkimer County’s mean impervious value is 0.91%, and 0.47% of the county is shown at 50% or greater impervious cover.
Does the 7.10% class difference mean all of that land was physically transformed?
No. The comparison marks differences between the 1985 and 2025 classifications, and the map notes that classification variation may be included. It should be used to locate possible change areas rather than as proof of a specific cause.
What files are included in the download?
The ZIP contains the four original JPG maps used for this page. The images displayed in the article are WebP previews for easier browsing.
Map File Information
Herkimer County Land Cover Map Files
- Included Files: Use only the versions confirmed in the article and supplied images
- File Type: Use the confirmed download contents
- Intended Use: Printing, education, presentations, and map-based projects
Related Maps
- Albany County Land Cover Map
- Allegany County New York Land Cover Map
- Bronx County New York Land Cover Map
Sources and reference data
- MRLC Annual NLCD Data – access to Annual NLCD land-cover products and related datasets.
- USGS Annual NLCD Land Cover Classification – definitions and background for land-cover classes.
- U.S. Census Bureau TIGER/Line Shapefiles – reference source for county boundaries and geographic files.
Green Map creates custom-edited map images using open geographic data sources such as geoBoundaries, Natural Earth, OpenStreetMap, and government open data.
These maps are edited visual materials, not raw data files, and are provided for education, documents, presentations, and graphic reference.