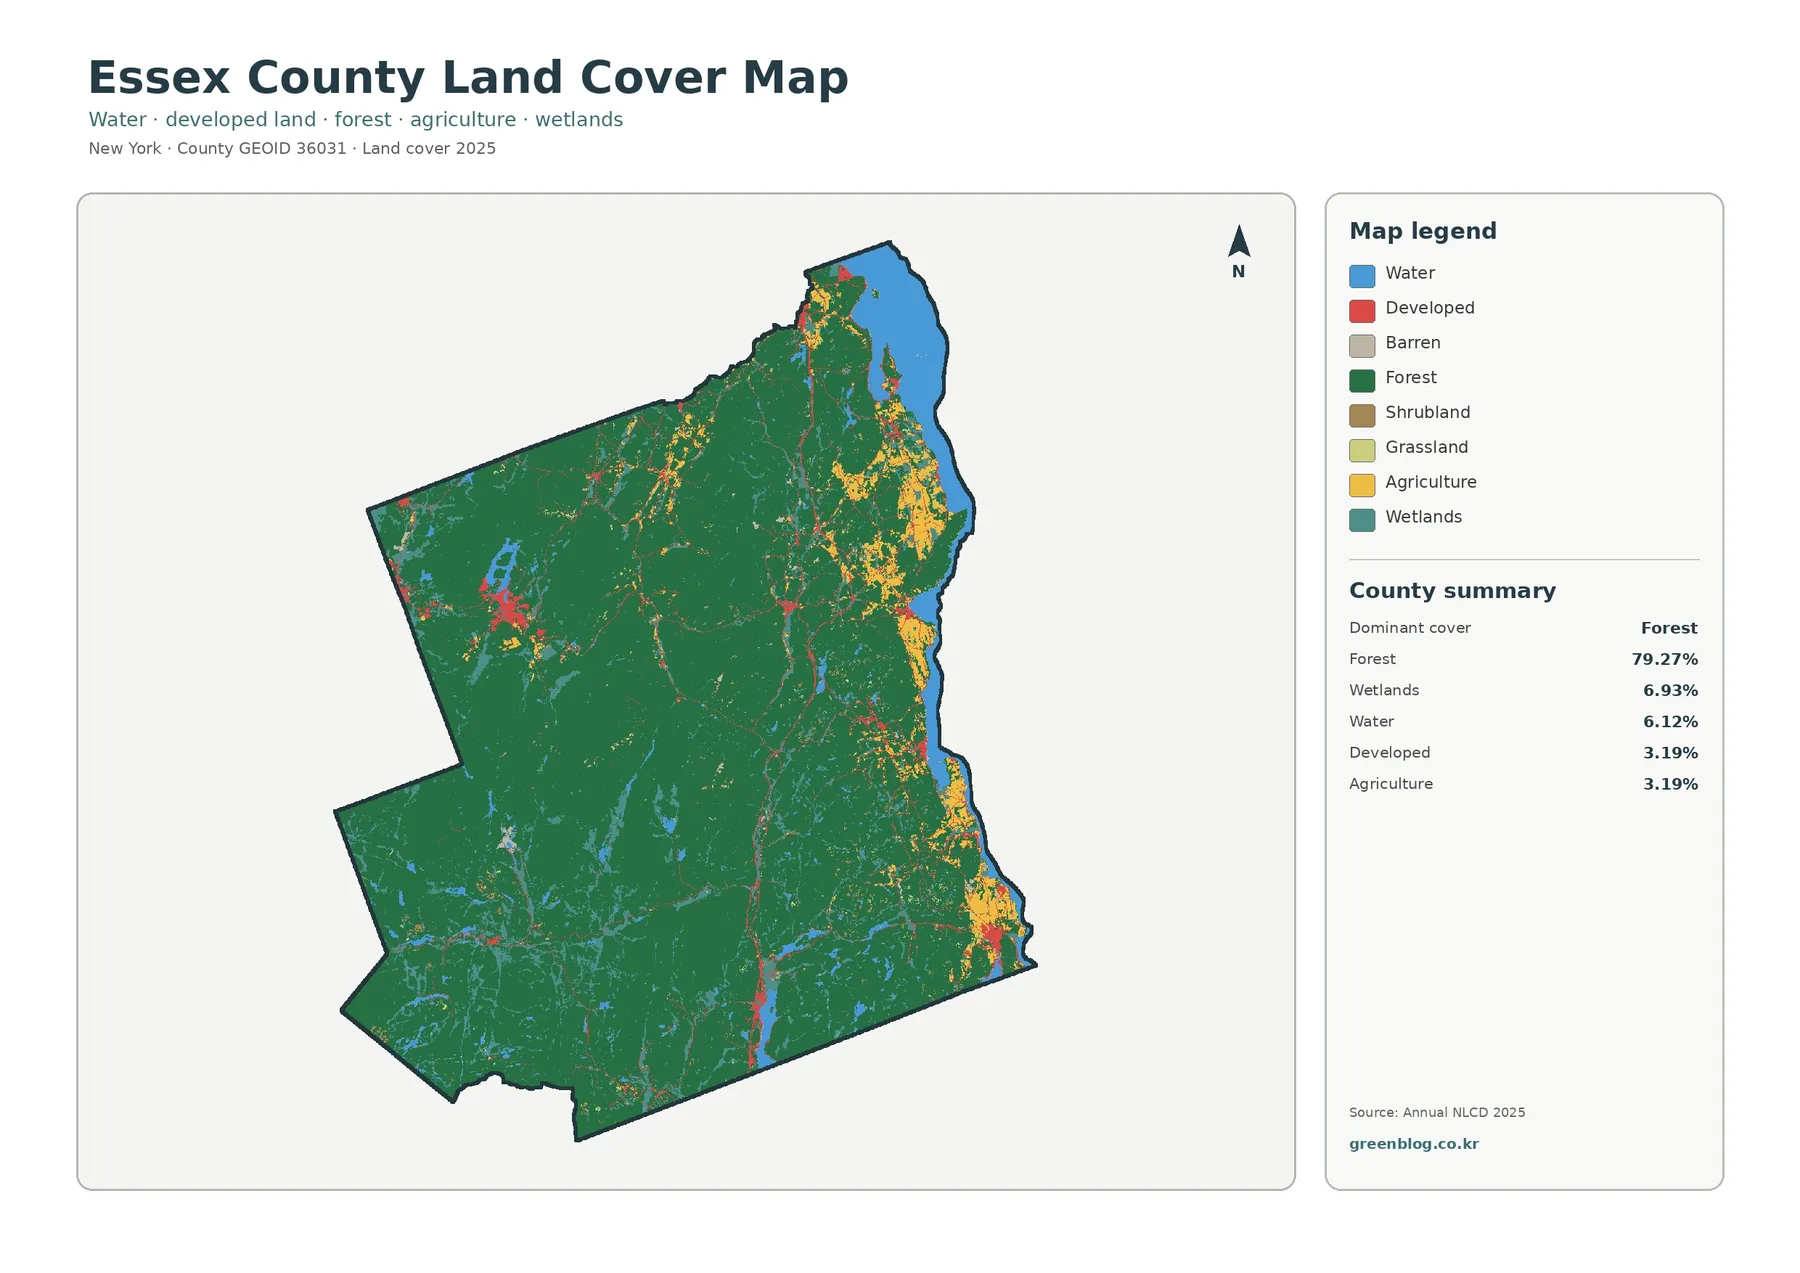
Essex County is one of the most strongly forested counties in New York, and the 2025 land-cover map makes that clear at first glance. Forest covers 79.27% of the mapped county. Wetlands account for 6.93% and water for 6.12%. Developed land and agriculture are both listed at 3.19%. The county therefore looks very different from a metropolitan landscape where developed classes dominate.
The pattern is not uniform from west to east. Much of the interior lies within the Adirondack landscape, where forest forms large continuous areas around lakes and wetlands. Along the Lake Champlain side of the county, agricultural cover and small developed areas become more frequent. The eastern edge therefore reads as a distinct shoreland and settlement zone beside a heavily wooded interior.
Four maps are included here because each answers a different question. The general land-cover map shows the full mix of forest, water, wetlands, agriculture, and development. A second map strips the view down to forest and rural cover. The impervious map focuses on pavement, rooftops, and other hard surfaces. The historical comparison marks cells whose mapped class differs between 1985 and 2025.
Land cover is not the same as zoning, ownership, or legal land use. It describes the surface that remote-sensing data classify at a given time. These maps are useful for countywide context, environmental education, and presentation graphics, but they are not parcel surveys. Fine roads, narrow shorelines, and small clearings can also be generalized by raster data.
Table of Contents
Forest sets the countywide pattern
The general map is dominated by green because nearly four-fifths of Essex County is classified as forest. Large wooded blocks cover the west, center, south, and much of the north. The interior is interrupted by lakes, wetlands, narrow road corridors, and scattered developed places rather than by broad urban zones.
The eastern side changes character as the county approaches Lake Champlain. Yellow agricultural classes become much more visible, particularly in the northeast and along portions of the eastern edge. Small developed areas also appear more often there. The contrast between the eastern shorelands and the interior forest is one of the clearest geographic patterns in the set.
Water is a significant part of the map at 6.12%. Lake Champlain forms the large blue edge on the east, while inland lakes and waterways are scattered through the Adirondack interior. Wetlands occupy 6.93%, appearing as numerous smaller patches in and around wooded and aquatic areas.
Developed land covers only 3.19%. Instead of forming a large continuous footprint, it appears in small clusters and along transportation routes. That distribution becomes easier to interpret on the impervious-surface map, which measures hard surfaces directly.
The rural map highlights the Lake Champlain side
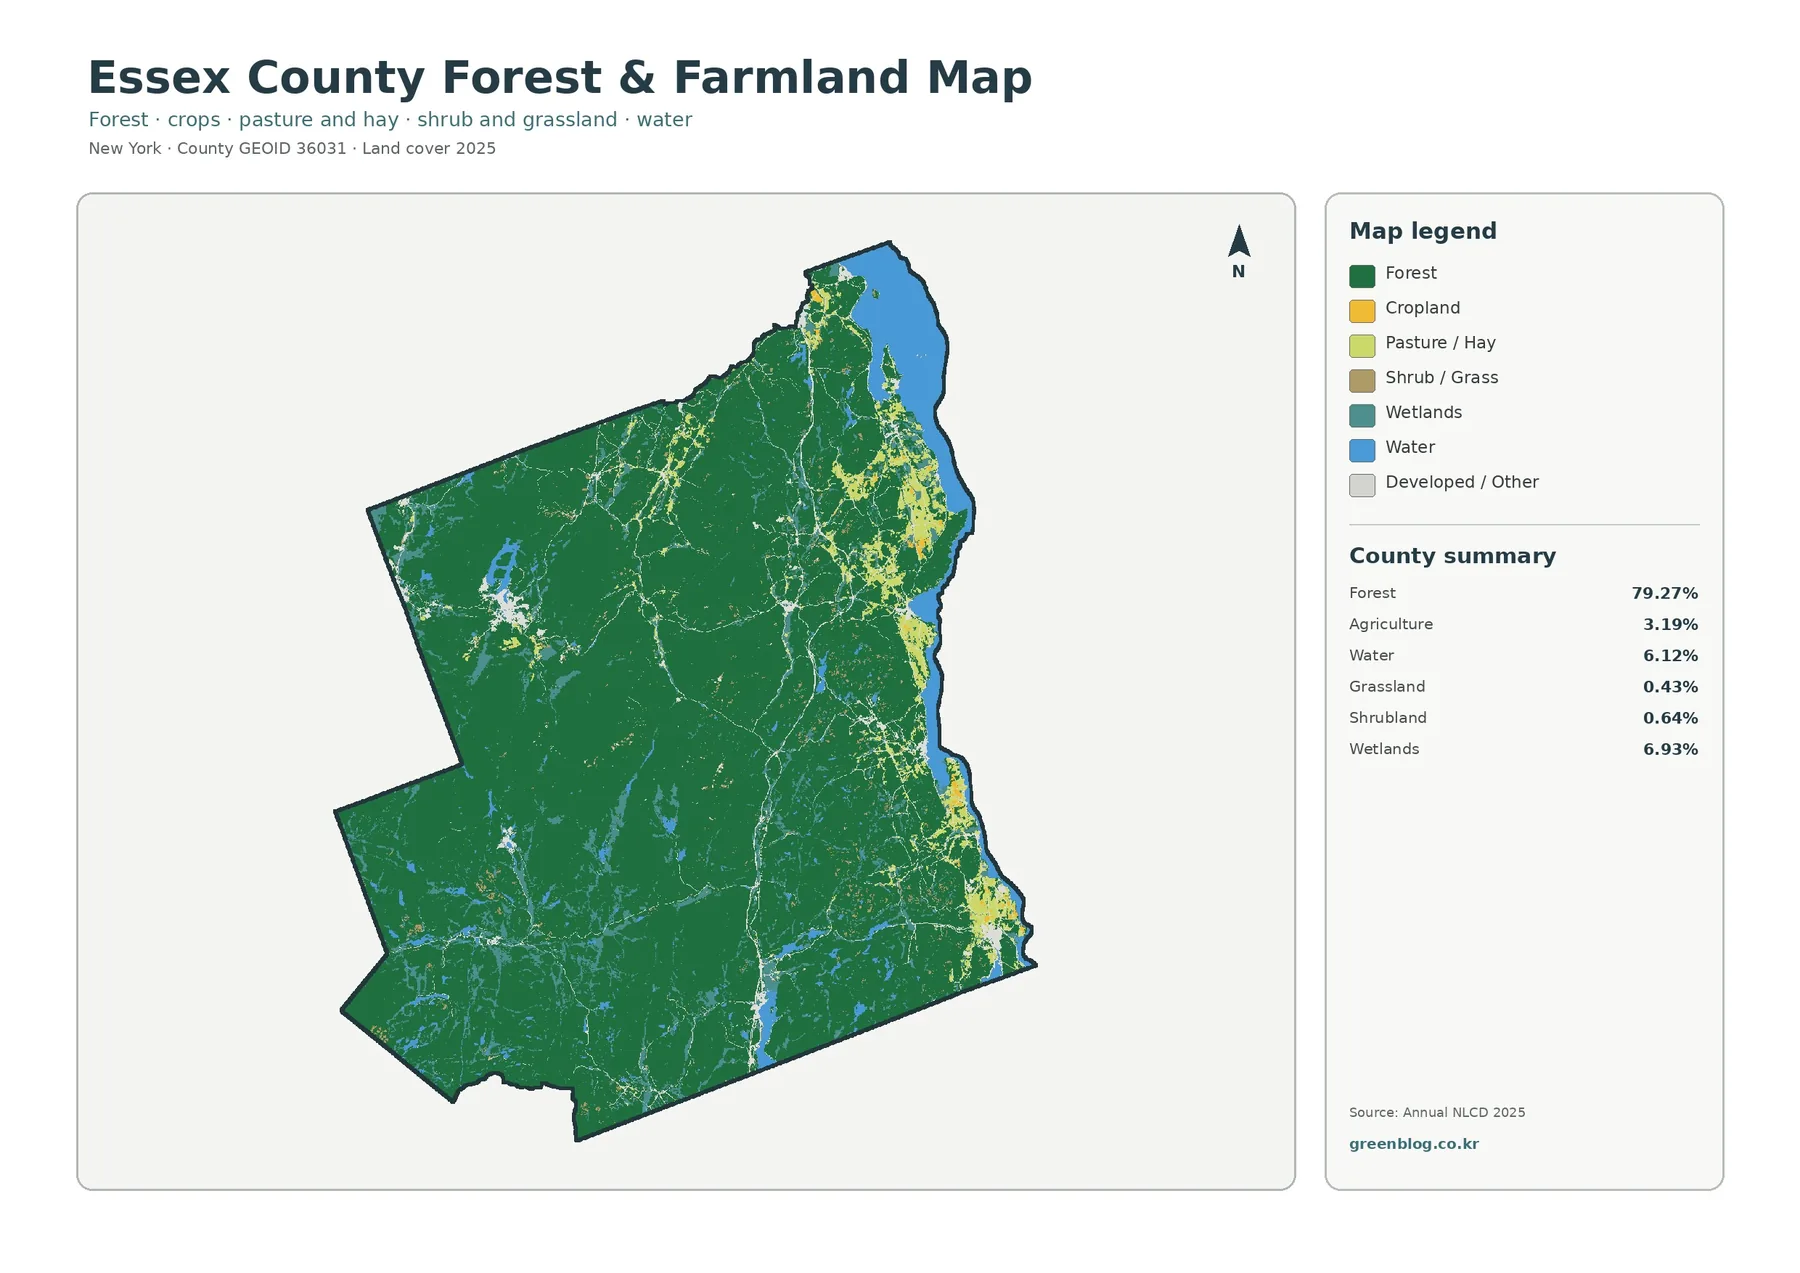
A forest-and-farmland view makes the county’s east-west difference even easier to read. Forest remains dominant at 79.27%. Agriculture is only 3.19% countywide, yet it is spatially concentrated enough to stand out along the Lake Champlain side and in parts of the northeast.
Large sections of the western and central county contain almost no mapped cropland. Forest fills those areas, broken by water, wetlands, and a few light-colored developed or other surfaces. Moving toward the east, cropland and pasture or hay become more frequent. The agricultural pattern is still fragmented, but it clearly occupies a different part of the county from the largest forest blocks.
The legend separates cropland from pasture or hay and also identifies shrub or grass cover. That distinction matters because open land is not automatically agricultural. Wetlands and water are retained as separate categories, so readers can see how farmed areas sit beside shorelands, streams, and wet environments.
This map can support classroom comparisons of rural landscapes, or it can provide background for discussions about forest conservation and agricultural land. It does not identify individual farms, crop types, or property ownership. Those questions require local agricultural or parcel data.
Impervious cover remains sparse and corridor-based
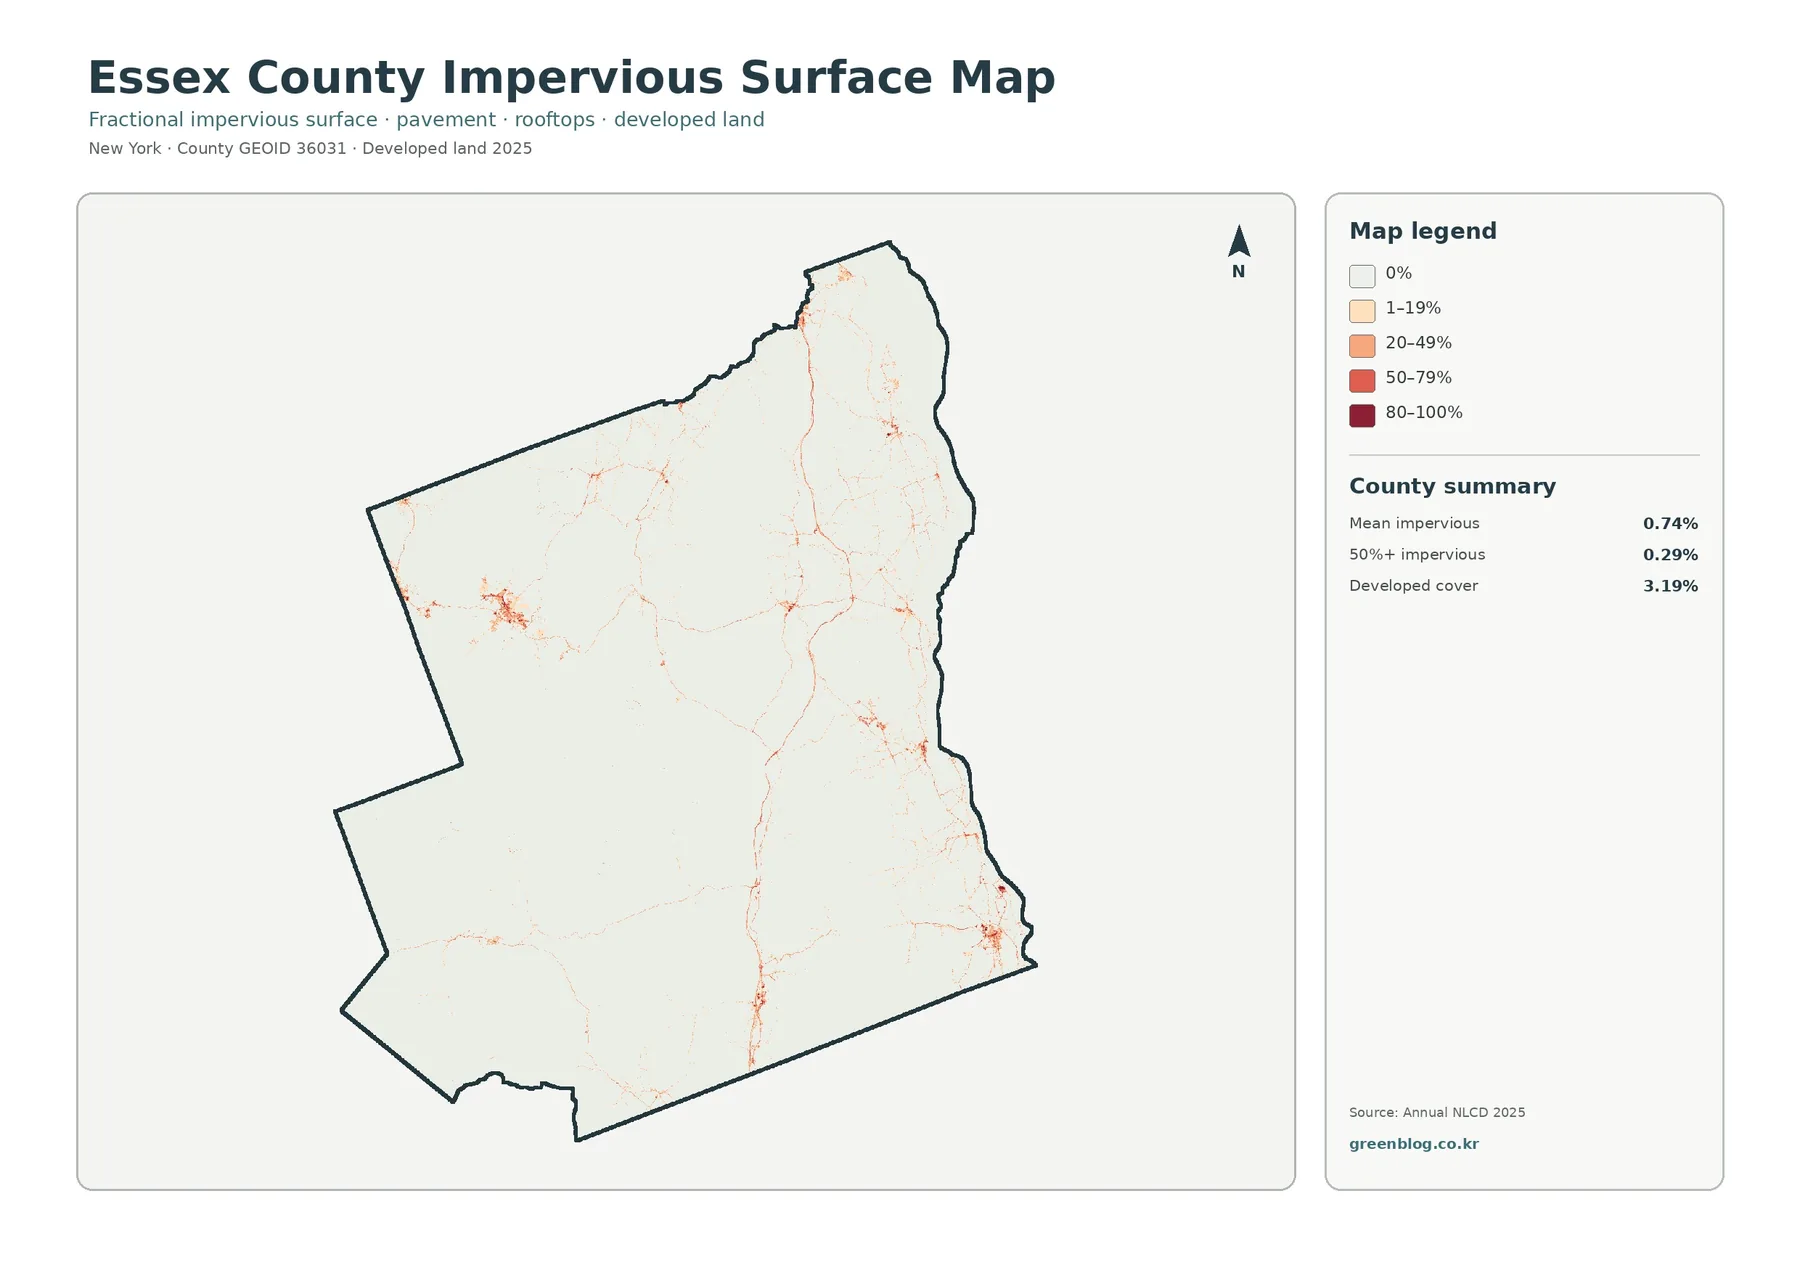
Impervious surface is the share of ground covered by materials such as pavement, parking lots, and rooftops that do not readily absorb water. Essex County has a mean impervious value of 0.74%. Only 0.29% of the county is mapped at 50% impervious or greater. Those numbers are much smaller than the 3.19% developed-land share because a developed class can include lawns, trees, and other permeable surfaces.
Most of the impervious map is very pale. Thin lines follow major roads, and a few small clusters appear where settlement is denser. Some of the more visible concentrations occur along the eastern side and near several interior communities, but none forms a metropolitan-scale block.
The low countywide average fits the broader land-cover picture. A place with nearly 80% forest and more than 12% combined water and wetlands naturally has limited room for dense hard-surface cover. Even so, the road network is easy to trace because linear impervious features can stand out against a largely undeveloped background.
Impervious data can provide context for runoff and watershed discussions. Higher hard-surface coverage may change how rainfall reaches nearby streams, but this map alone cannot determine flood risk or water quality. Terrain, soils, drainage systems, rainfall, and stream conditions all need separate analysis.
Change is scattered rather than concentrated in one zone
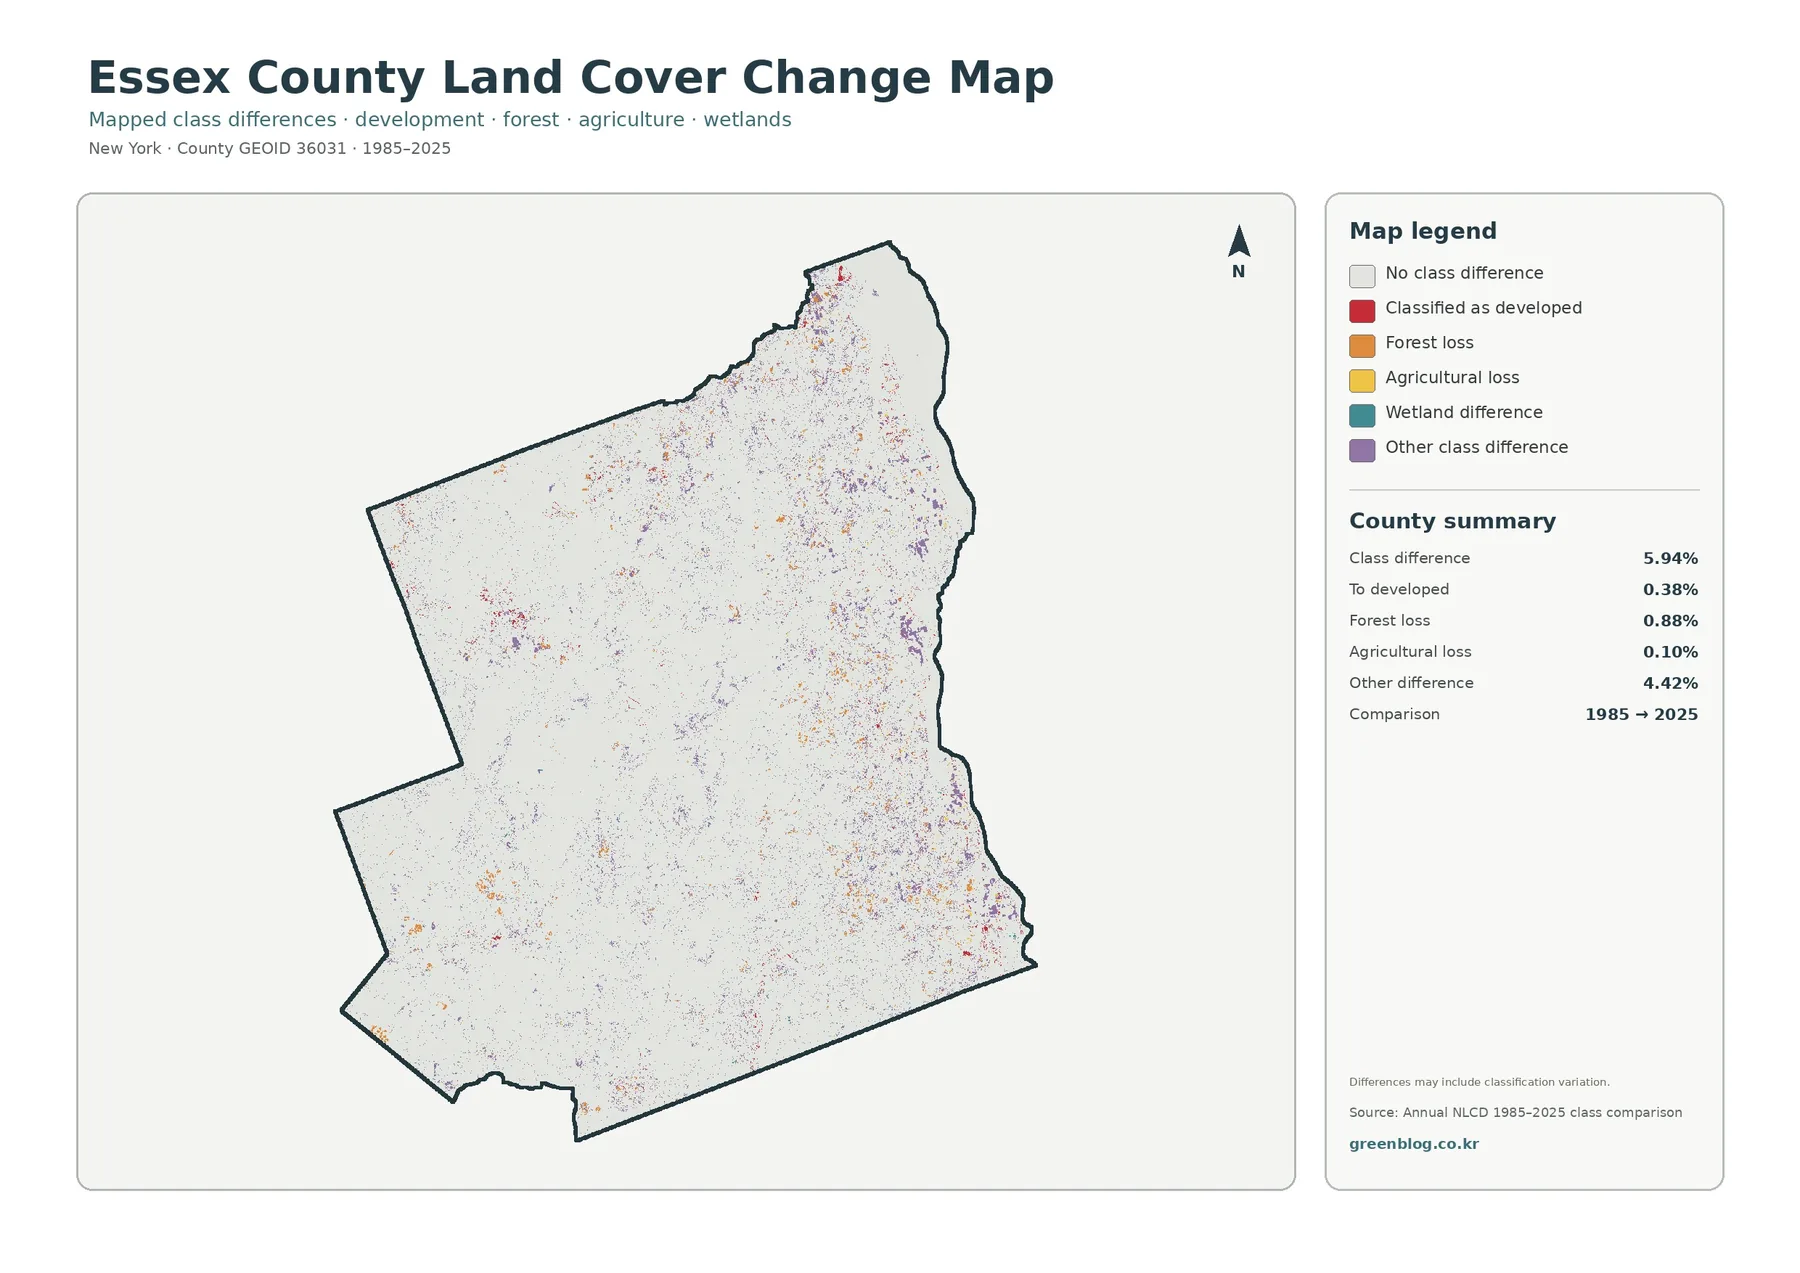
The change map compares the 1985 and 2025 class assignments. The overall class difference is 5.94%. Cells classified to developed account for 0.38%, forest loss for 0.88%, and agricultural loss for 0.10%. Other class differences make up 4.42%, the largest single part of the summary.
Colored change cells are dispersed across the county. They appear in the north, east, southeast, and in smaller patches through the interior. The map does not show one dominant growth front or one large continuous area of forest loss. Instead, many differences are small and separated from one another.
Some red developed-change cells sit near existing roads and settlement areas. That spatial relationship is worth noting, but it does not prove the cause of every change. The map records a difference between two classifications, not a complete history of individual construction projects.
The same caution applies to forest-loss and other-difference categories. Seasonal imagery, mixed pixels, and classification methods can create differences between years. A site that matters for conservation, planning, or research should be checked against historical aerial imagery or local records before a specific explanation is assigned.
What becomes clearer when the maps are compared
The general map is the best starting point because it establishes the countywide balance. Forest dominates, while water and wetlands form a substantial secondary component. Agriculture and development are small by percentage but important because they are concentrated in particular locations.
The forest-and-farmland map then sharpens the distinction between the Adirondack interior and the Lake Champlain side. Once the developed classes are muted, the eastern agricultural pattern becomes easier to follow. The same locations can be checked on the general map to see how farming, water, wetlands, and settlement sit beside one another.
The impervious map adds density to the discussion of development. A place can be mapped as developed without being heavily paved. In Essex County, most developed areas have much lower hard-surface intensity than a dense urban center. The road network is often more visible than large built-up blocks.
Finally, the change layer adds a historical comparison. Readers can locate a changed cell, return to the 2025 map, and see what cover surrounds it today. That sequence keeps the analysis grounded in location instead of relying on one countywide percentage.
Ways to use the map set
Essex County is a useful classroom example because the county combines a heavily forested interior with a major lake shore and pockets of agriculture. Students can compare east and west, identify where wetlands cluster, and discuss why developed land and impervious surface are different measurements.
Environmental presentations can use the general map to introduce forests, wetlands, and water in one view. The forest map can then isolate the rural pattern, while the change layer can identify places that deserve a closer historical look. None of these layers should be treated as a substitute for habitat surveys or field work.
For regional planning context, the maps can help explain why development in Essex County appears as small communities and corridors rather than a continuous urban field. The impervious map is especially useful for showing the limited extent of high-intensity hard surfaces.
Report writers and designers can use the four JPG files as a consistent graphic set. Each map uses the same county boundary and related layout, so they can be placed in separate pages or slides without changing the visual frame. The WebP versions are optimized for the article itself.
Limits to keep in mind
Land-cover products are raster datasets. Raster data divide the landscape into grid cells and assign each cell a representative class or value. Narrow roads, small buildings, thin shorelines, and small clearings may therefore be generalized or combined with nearby surfaces.
A mixed pixel occurs when more than one surface type falls within the same cell. Forest edges, wetland boundaries, and low-density developed areas are common places for this to happen. A sharp color boundary on the map should not be interpreted as an exact legal or ecological boundary.
The date of the data also matters. The current-cover maps use the supplied 2025 classification, while the historical layer compares 1985 with 2025. Construction, forest disturbance, vegetation recovery, or agricultural change after the observation year may not appear until a later dataset is produced.
Download the map files
The downloadable ZIP contains four JPG maps for Essex County: current land cover, forest and farmland, impervious surface and developed land, and the 1985–2025 land-cover comparison. Keeping the four files together makes it easier to build a classroom handout, report, or presentation with a consistent visual format.
Frequently Asked Questions
What is the dominant land cover in Essex County?
Forest is the dominant 2025 class at 79.27%. Wetlands account for 6.93% and water for 6.12%. Developed land and agriculture are each listed at 3.19%.
Why is developed land 3.19% while mean impervious cover is only 0.74%?
Developed land is a broad class that can include lawns, trees, and other permeable surfaces. Impervious cover measures hard surfaces such as pavement and rooftops, so it represents a smaller portion of the county.
Does the 5.94% class difference mean that all of that area truly changed land use?
No. It means the mapped class differs between 1985 and 2025 at those cells. Real land-cover change can contribute, but image conditions, mixed pixels, and classification variation can also create differences.
Map File Information
Essex County Land Cover Map Files
- Included Files: Use only the versions confirmed in the article and supplied images
- File Type: Use the confirmed download contents
- Intended Use: Printing, education, presentations, and map-based projects
Related Maps
- Albany County Land Cover Map
- Bronx County New York Land Cover Map
- Cattaraugus County New York Land Cover Map
Sources and references
- MRLC Annual NLCD Data — official access to Annual NLCD products and supporting data.
- USGS Annual NLCD Land Cover Classification — descriptions of the land-cover classes used in Annual NLCD.
- U.S. Census Bureau TIGER/Line Shapefiles — official county boundary and geographic identifier files.
Green Map creates custom-edited map images using open geographic data sources such as geoBoundaries, Natural Earth, OpenStreetMap, and government open data.
These maps are edited visual materials, not raw data files, and are provided for education, documents, presentations, and graphic reference.