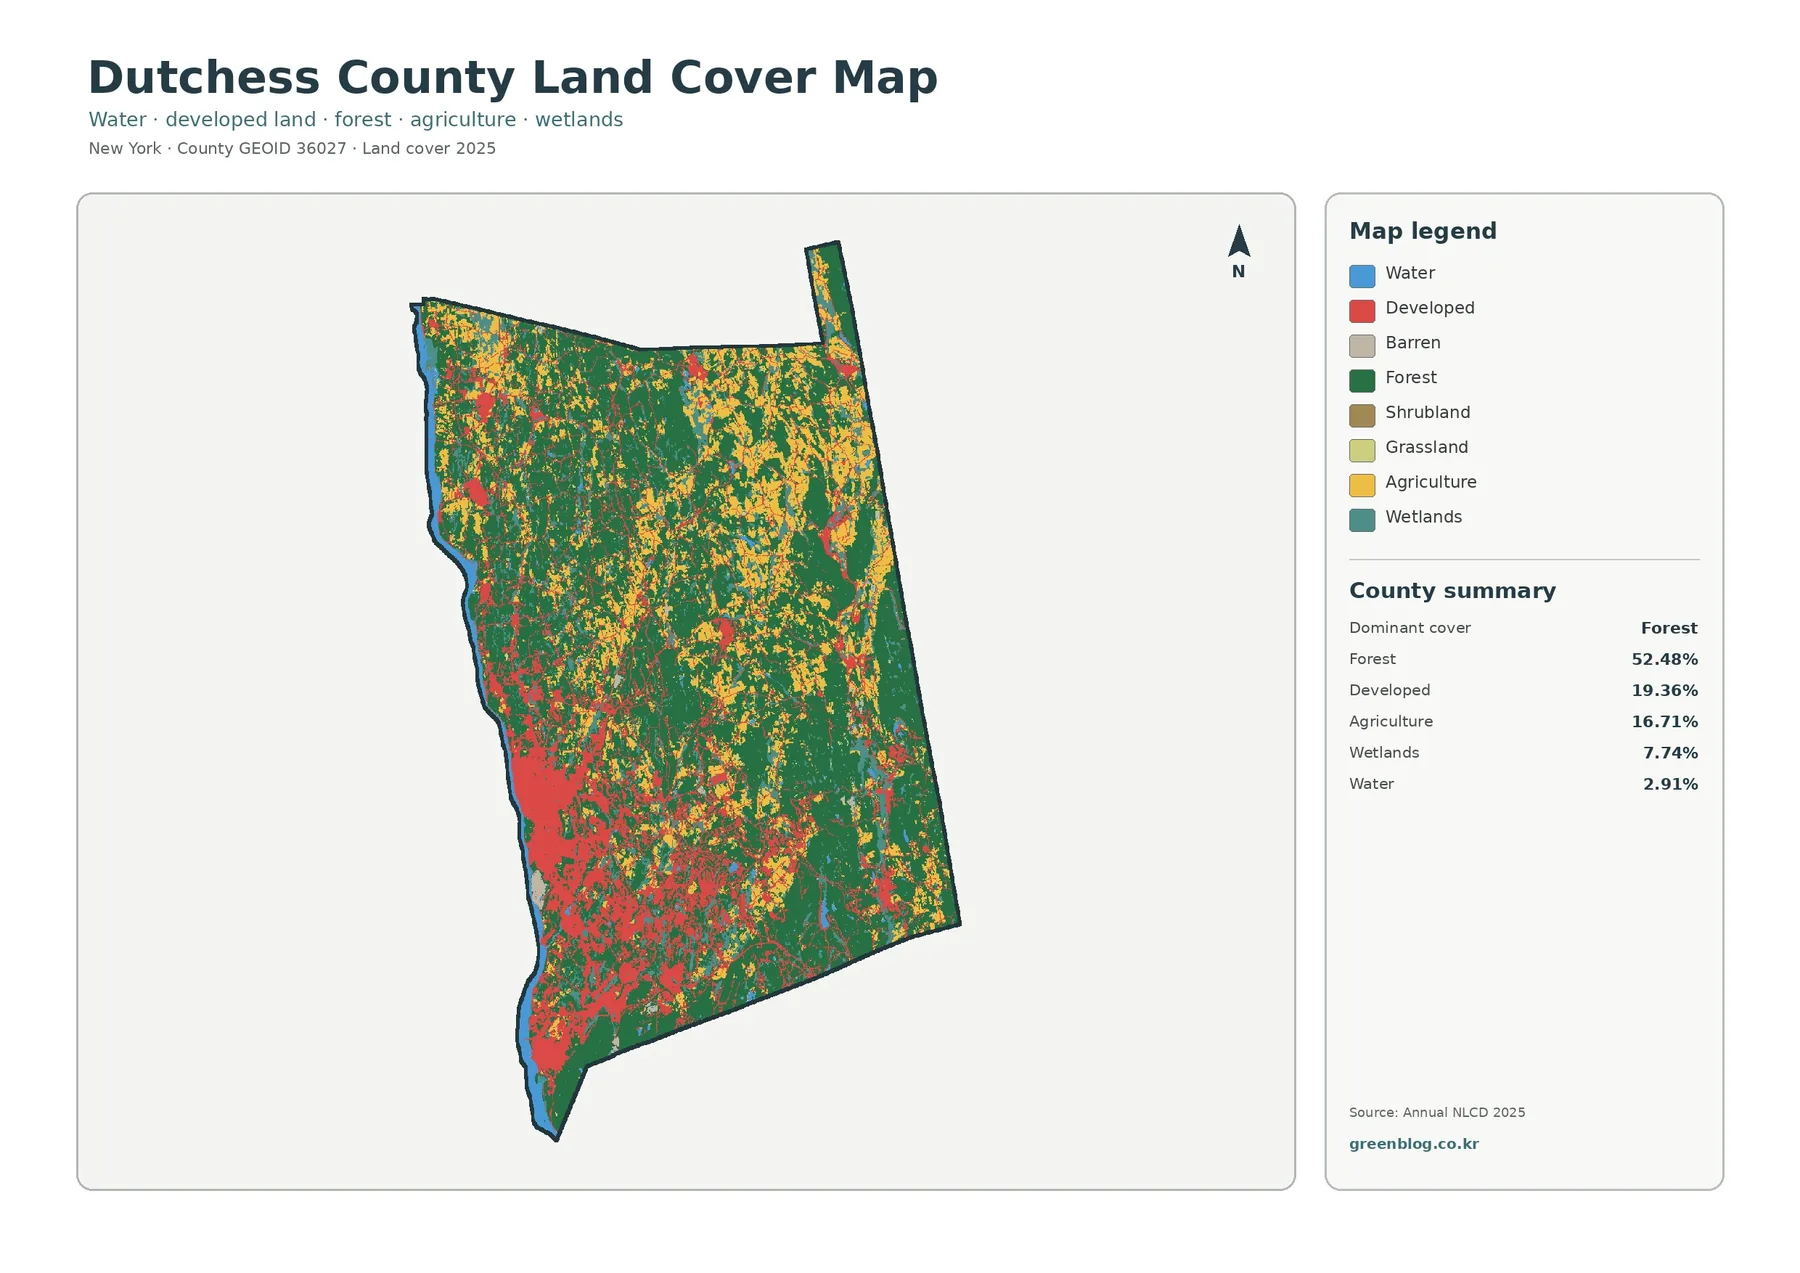
Dutchess County combines several landscapes within a relatively compact part of the Hudson Valley. The 2025 classification places forest first at 52.48%, followed by developed land at 19.36% and agriculture at 16.71%. Wetlands account for 7.74% and water for 2.91%. Those percentages are useful, but the geography matters just as much: development is far more conspicuous along the western and southwestern side of the county, while larger forest and agricultural areas occupy much of the interior and east.
The four graphics on this page are designed for different kinds of reading. One gives the full 2025 land-cover picture. Another removes much of the visual emphasis on development so forest and farmland can be compared more easily. A third focuses on impervious surfaces such as pavement and rooftops. The final map marks cells whose class differs between 1985 and 2025. Taken together, they separate present-day cover, rural structure, hard-surface intensity, and long-term mapped change.
Land cover is not the same as zoning or legal land use. These classes describe the surface observed in remotely sensed data. A forest cell does not identify ownership, and a developed cell does not define a municipal zoning district. The maps work well for county-scale interpretation, education, and presentation graphics, but they should not be used as parcel surveys.
Table of Contents
A county split between a developed west and a greener interior
The general land-cover view immediately shows a strong contrast. Dense patches of developed land line portions of the Hudson River side and spread through the southwest. Farther east, forest becomes more continuous, although it is repeatedly broken by agricultural land, wetlands, water, and smaller settlements. The center of the county acts as a transition rather than a sharp dividing line.
Forest is the largest single class at 52.48%. It forms broad blocks through the center, southeast, and eastern side, with additional wooded areas in the north. Agriculture, at 16.71%, is especially noticeable across the northern and eastern sections. Fields appear as clusters and irregular patches rather than one uninterrupted farming belt. This pattern helps distinguish Dutchess County from a heavily urban county where developed cover would dominate most of the map.
Wetlands are also unusually visible in the county image. At 7.74%, they appear in numerous teal patches, particularly in the eastern and northeastern parts of the map. Water at 2.91% includes the Hudson River along the western edge and smaller inland features. These areas interrupt forest and farmland and are important context for anyone using the maps for habitat or watershed discussion.
The apparent precision of the boundaries should not be mistaken for parcel-level accuracy. Raster mapping divides the landscape into cells. A cell near a forest edge might also contain a road, lawn, or field. The classification assigns a category to the cell, which can simplify narrow features and create mixed pixels along transitions.
Forest and farmland across the eastern Hudson Valley
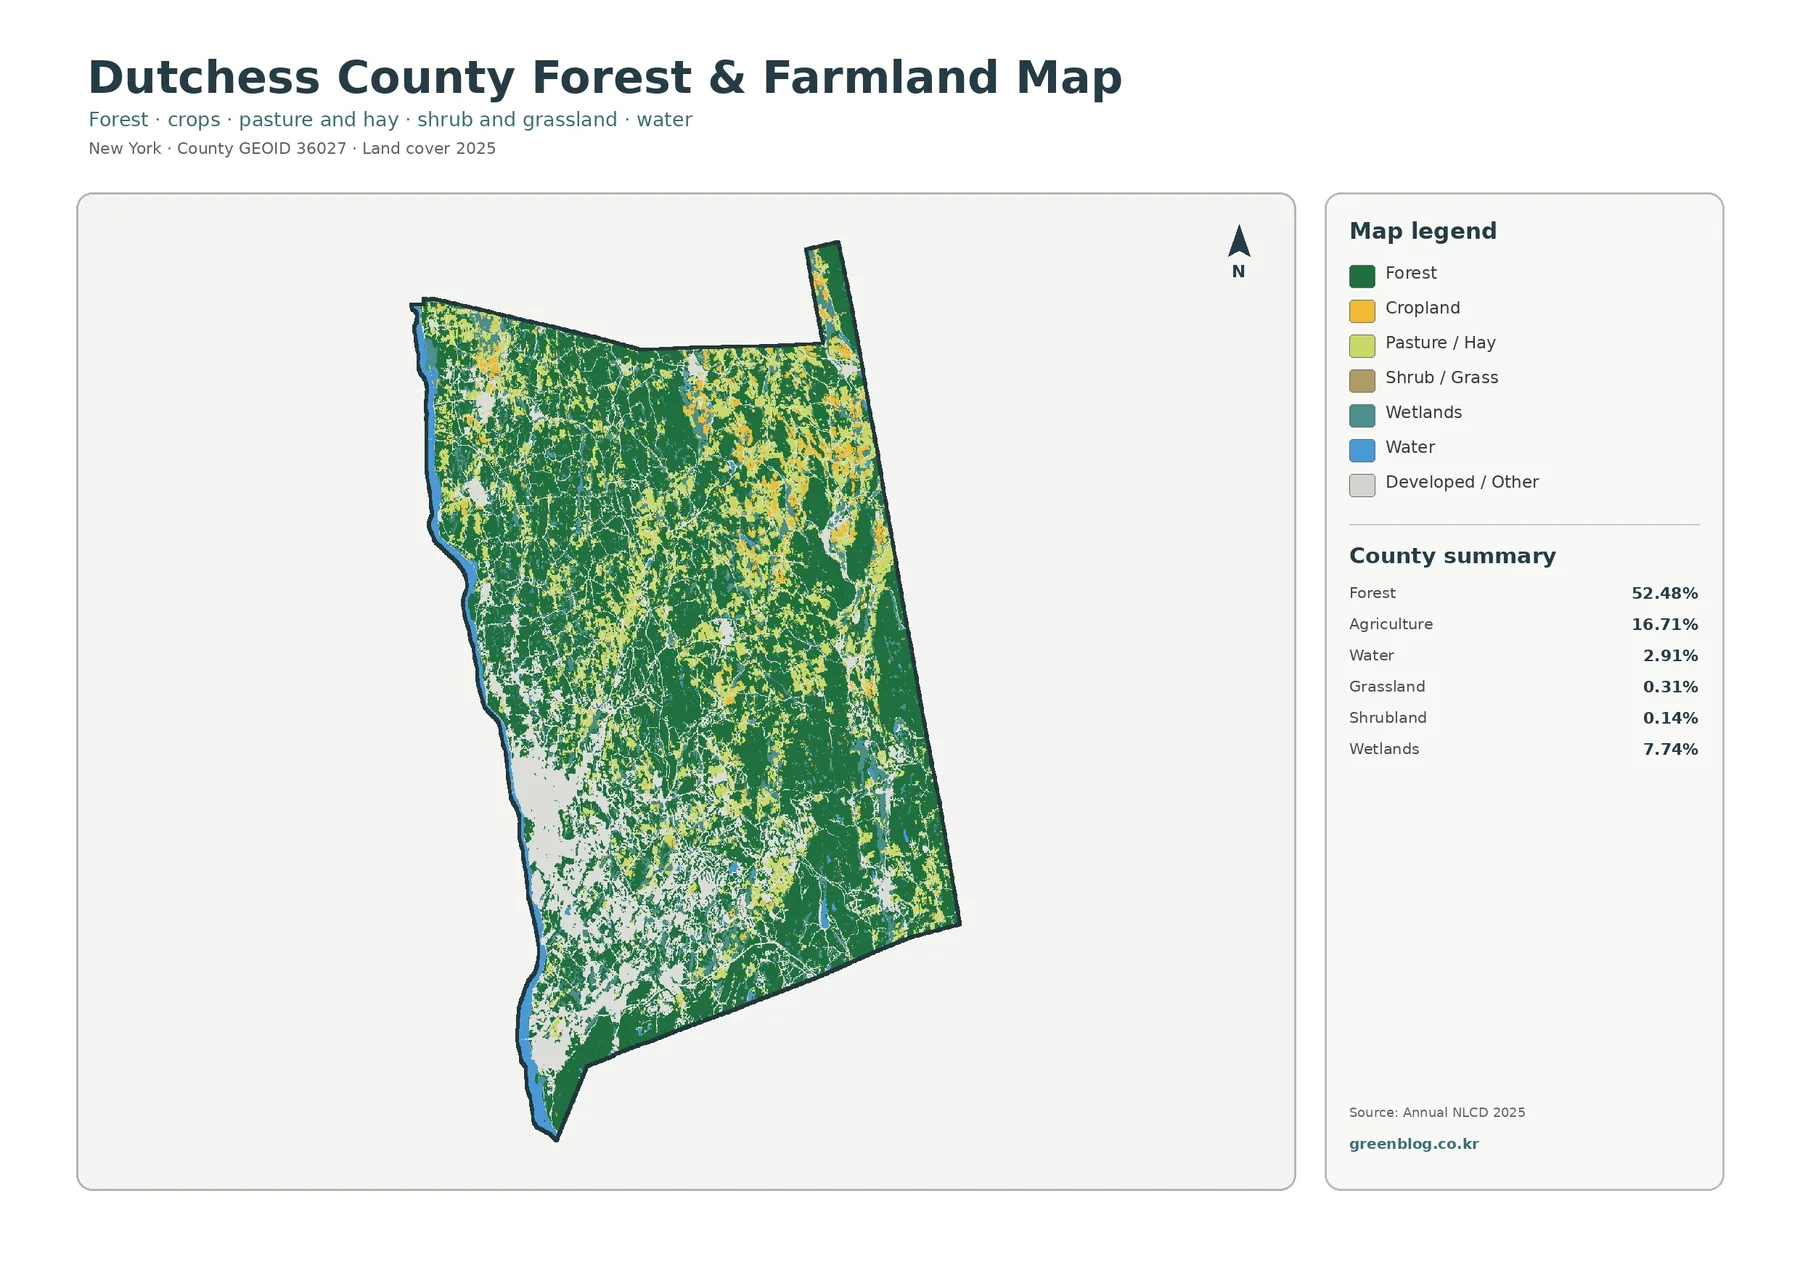
The forest-and-farmland map changes the emphasis. With developed and other land shown neutrally, the relationship between wooded land and agriculture is much easier to follow. Forest remains dominant at 52.48%, but the 16.71% agricultural share becomes visually prominent across the north and east.
Large green areas occupy much of the interior, yet farming is woven through them in many places. The eastern half contains repeated yellow and light-green patches representing cropland and pasture or hay. In the north, these agricultural areas are broad enough to create a clear rural pattern. Toward the southwest, gray developed or other cover becomes more extensive and fragments the forest-farm mosaic.
The map also separates cropland from pasture or hay and distinguishes shrub or grass cover. That matters because open land should not automatically be labeled farmland. A yellow field and a muted shrub or grass patch can look similar at first glance, but they represent different classifications. The graphic therefore provides a better starting point for agricultural discussion than the all-purpose map.
Dutchess County maintains planning and agricultural resources that can add context beyond this image. Those materials are useful when the question moves from broad land cover to working farms, conservation programs, or local planning. The map itself does not identify farm ownership, crop type, parcel boundaries, or whether a property participates in an agricultural district.
Impervious surfaces concentrate along the western and southern corridor
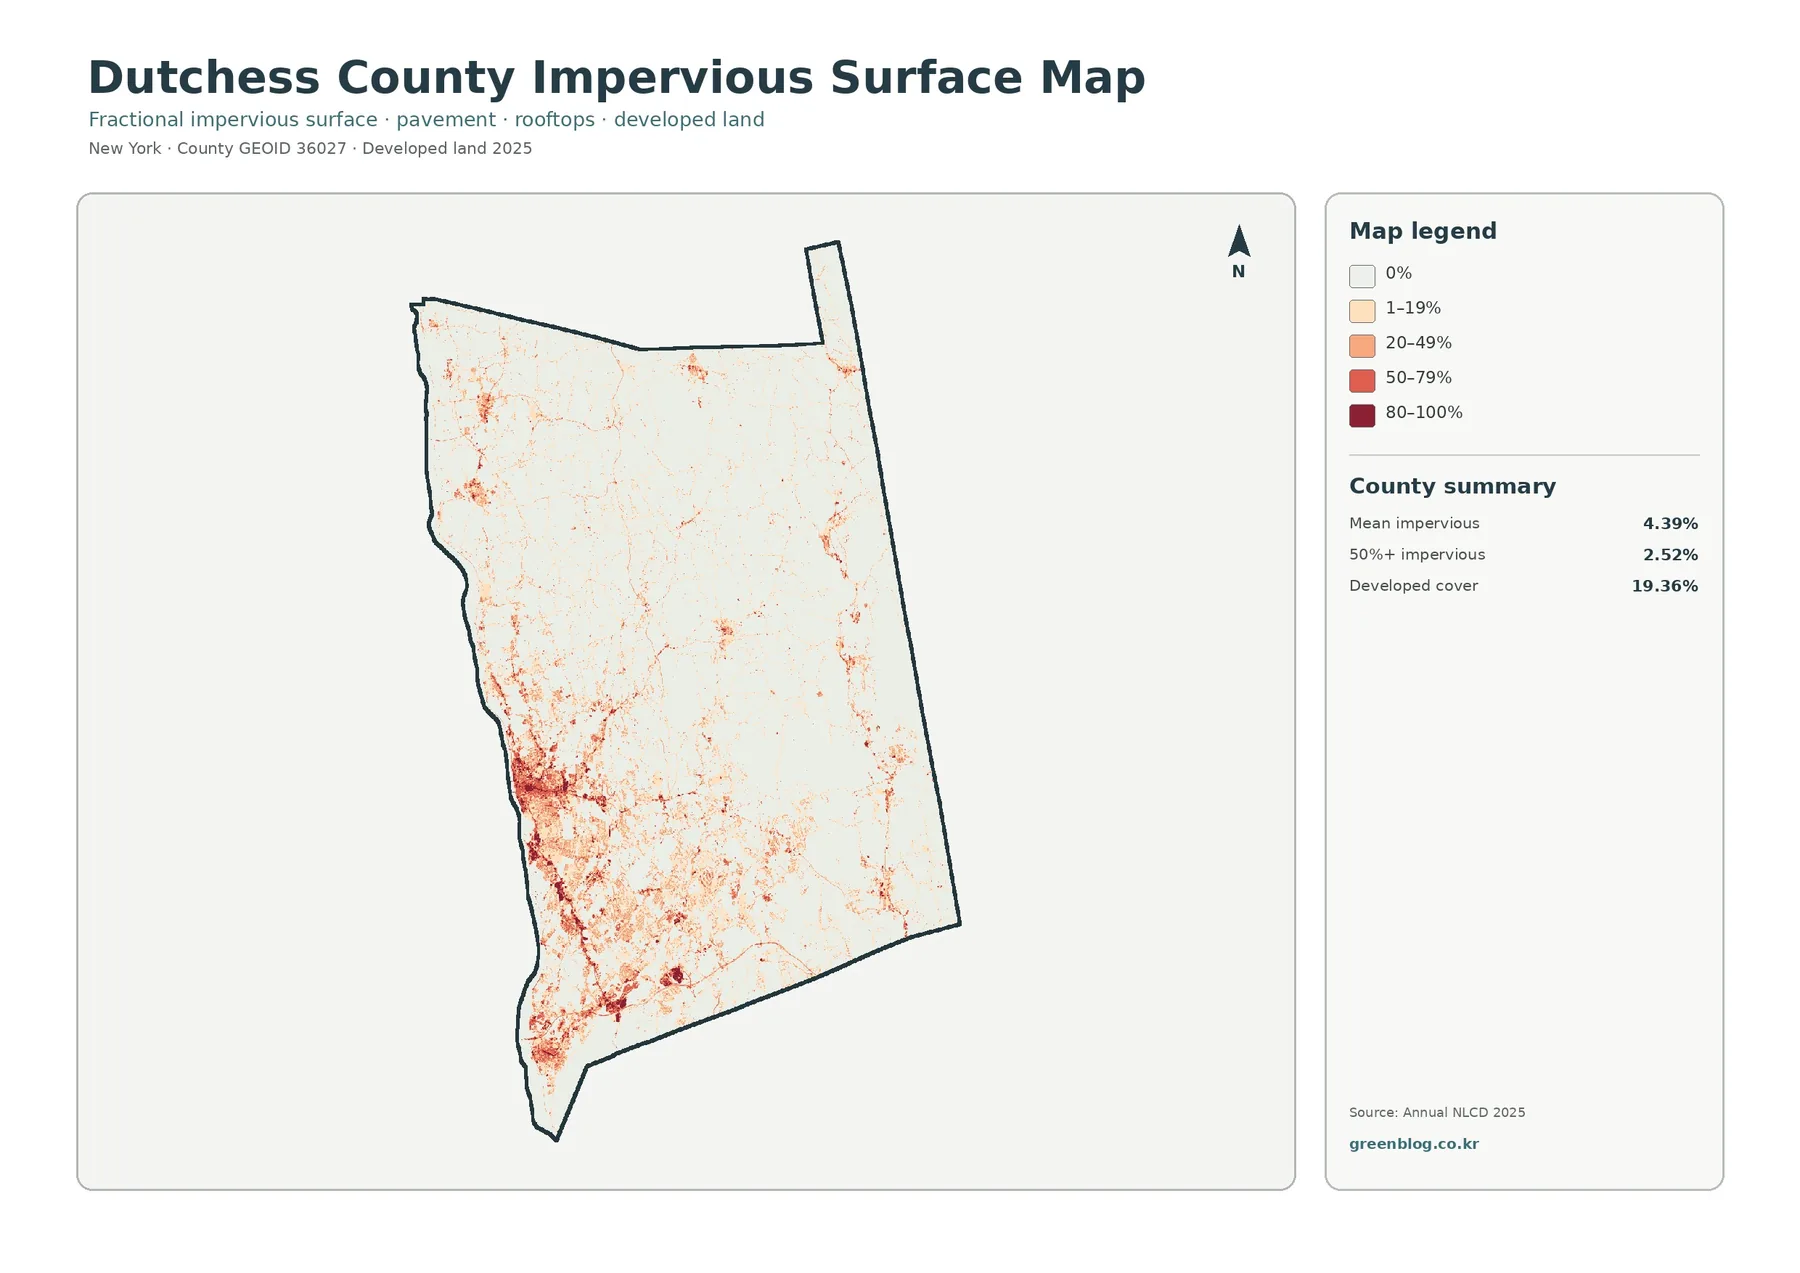
Impervious surface refers to ground covered by materials that resist infiltration, including pavement, parking areas, and rooftops. Dutchess County has a mapped mean impervious value of 4.39%. Areas at 50% impervious or greater cover 2.52% of the county. The developed-cover share is much larger at 19.36%, which illustrates why developed land and impervious surface should not be treated as interchangeable measures.
The highest intensities stand out in the west and southwest. Deep red clusters occur near the Hudson-side developed belt and continue through southern population centers. Thin linear traces extend away from those clusters, consistent with the road-and-settlement network visible in the pattern. Smaller concentrations appear farther north and east, but they are more isolated.
Low-density development can include lawns, trees, gardens, and other surfaces that still absorb water. That is why a developed class can occupy a substantial area while the average impervious percentage remains much lower. Conversely, a narrow road may be easy to miss on the general land-cover map but become more visible on an impervious layer.
This distinction is useful for introductory stormwater or watershed analysis. Hard surfaces can affect how rainfall moves across the ground, so locating concentrated impervious cover helps identify areas worth studying further. It does not, however, establish flood risk or drainage capacity. Those questions require additional information about terrain, soils, channels, rainfall, and infrastructure.
Mapped differences from 1985 to 2025
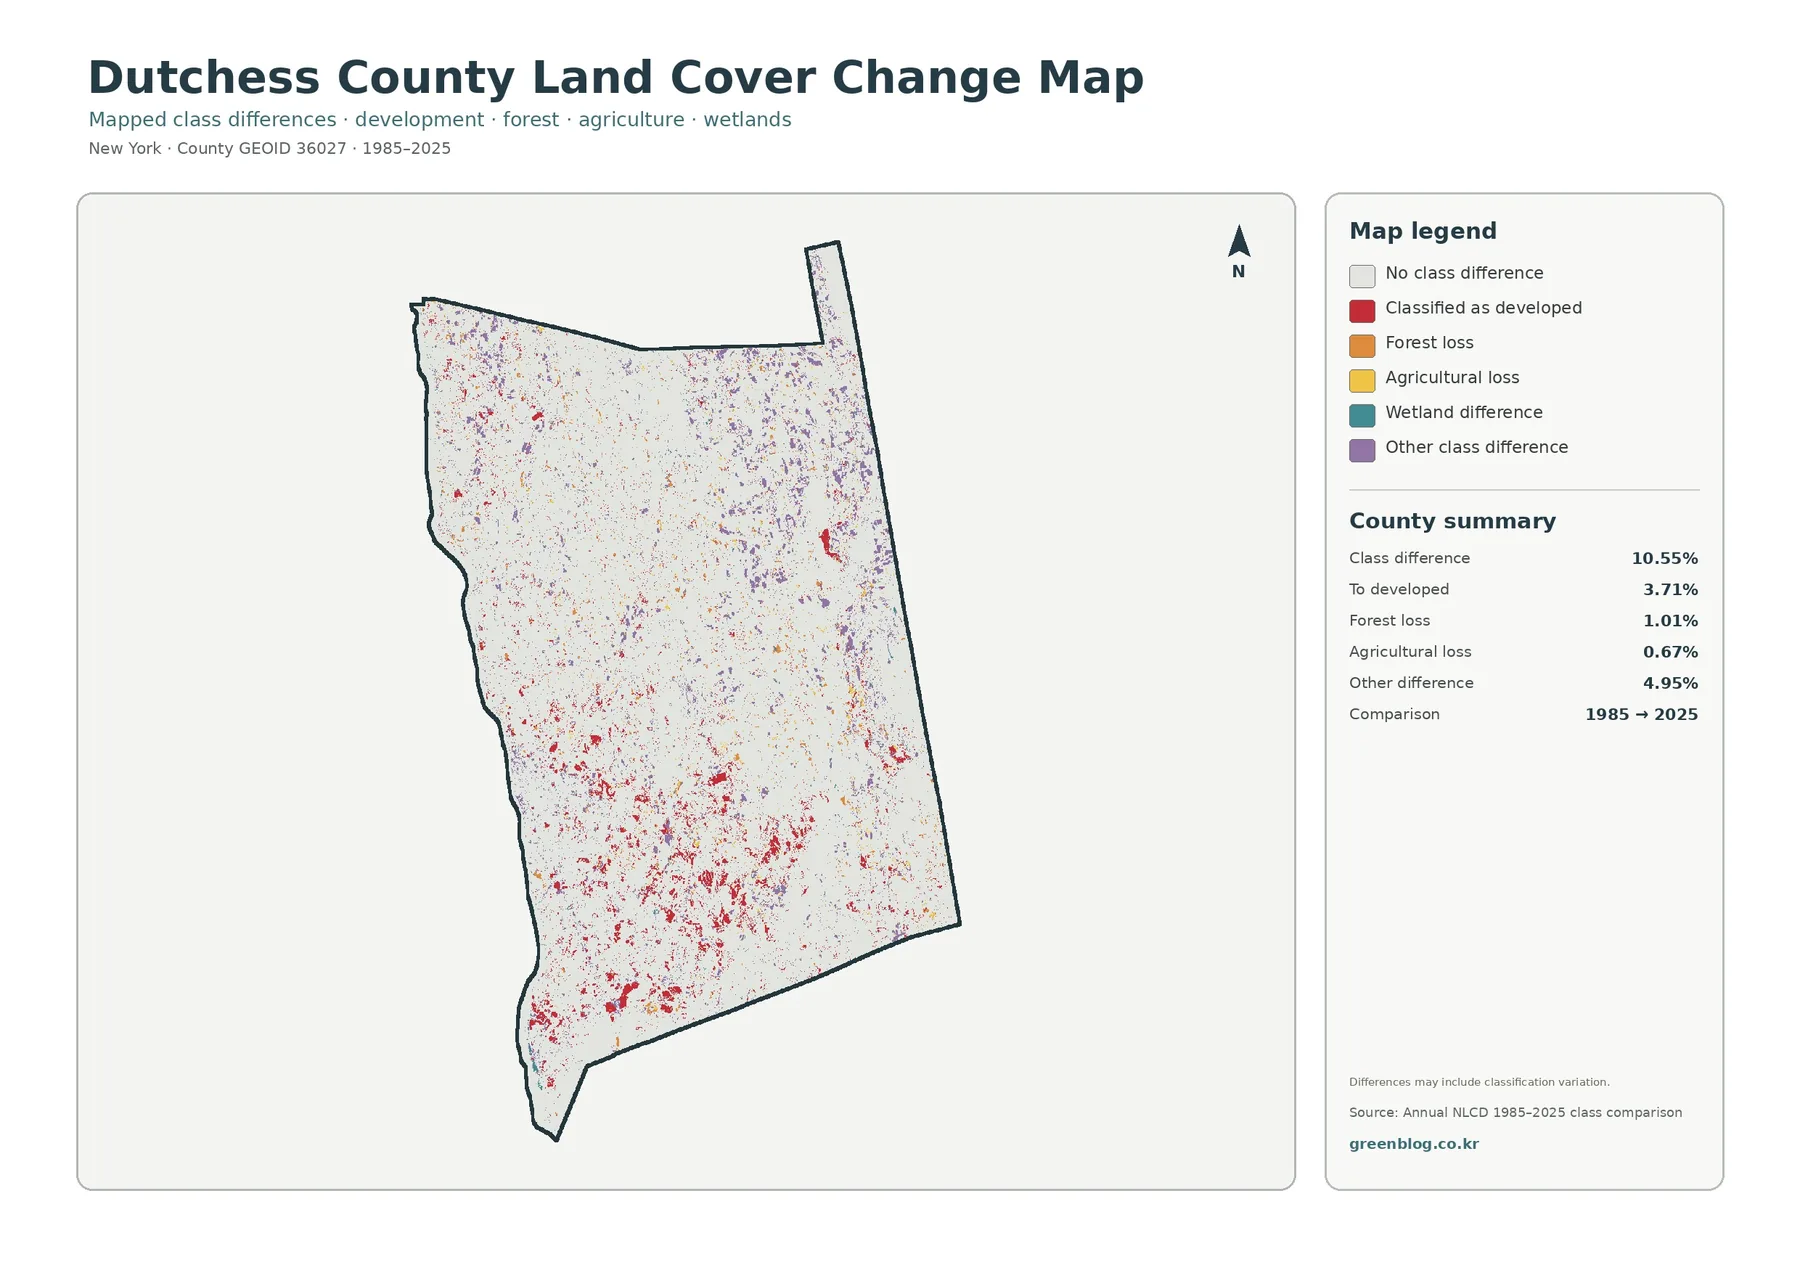
The change layer compares class assignments for 1985 and 2025. It reports an overall class difference of 10.55%. Cells classified as developed account for 3.71%, forest loss for 1.01%, agricultural loss for 0.67%, and other class differences for 4.95%. These figures describe a two-date classification comparison rather than a complete record of every land-use event over forty years.
The strongest development-change clusters are scattered through the southwestern and south-central parts of the county. Smaller red patches also appear elsewhere. Forest-loss and agricultural-loss marks are more dispersed, while purple other-class differences occur across a broad area. The overall picture is one of many localized changes rather than one single front moving across the county.
The large share assigned to other class differences deserves attention. A color on this map does not automatically mean confirmed construction, clearing, or farm abandonment. Satellite conditions, seasonal appearance, mixed pixels, and differences in classification can all contribute to a changed class label. The map itself even notes that differences may include classification variation.
A practical workflow is to use this layer to locate candidate sites for closer study. Once a change patch is identified, the 2025 map can show its current broad class. Historical aerial photographs, local planning records, or field observations can then help determine what actually happened. This approach avoids turning a screening map into evidence for a cause it cannot establish.
How to compare all four maps
A useful reading sequence begins with the general map. It establishes the present countywide pattern and makes the west-to-east contrast obvious. The forest-and-farmland layer can then answer a more specific question about rural cover. The impervious map narrows development further by showing where hard surfaces are actually concentrated. The change layer should come last because it adds the time dimension.
Cross-checking locations is more informative than reading the maps separately. A developed patch in the southwest can be compared with its impervious intensity to see whether it represents a heavily paved area or lower-density development. An agricultural area in the east can be checked against the change layer to see whether its broad class differs from 1985. Wetland clusters can be located on both the general and forest-farmland views before consulting more detailed environmental data.
This sequence also works well in reports and classrooms. A presentation can introduce the overall county first, then move to the map that fits the topic: rural land, development intensity, or long-term change. Because all four images use the same county outline, the audience can keep its geographic orientation while the subject changes.
Useful applications for planning context and environmental education
For environmental education, Dutchess County offers a clear example of how urbanized corridors can exist within a county that is still more than half forest. Students can compare the Hudson-side developed belt with the wooded and agricultural east. They can also identify wetland-rich areas and discuss why surface cover near water may matter for habitat and runoff.
The county’s own Environmental Mapper provides a useful next step for readers who need more detailed natural-resource context. It brings together information used for local conservation and planning discussions. The land-cover graphics on this page can serve as an overview before moving to those more specialized layers.
Agricultural groups can use the forest-and-farmland image as a visual introduction to the county’s working landscape. Planning presentations can pair the developed and impervious views to explain why land classified as developed is not necessarily covered entirely by pavement. Conservation discussions can combine the forest, wetland, and water patterns to identify areas that merit closer examination with official GIS data.
Limits to keep in mind
These maps generalize the landscape. Raster cells represent areas, so small buildings, narrow roads, thin stream corridors, and field edges may blend with nearby cover. A sharp color boundary is not the same as a surveyed property line or ecological boundary. Site-level decisions require more detailed information.
The date of observation also matters. The current-cover maps represent 2025 classifications. Construction, vegetation change, agricultural rotation, or other events after that date may not appear. The 1985–2025 layer compares two endpoints and does not show every intermediate change or reversal.
Users should also distinguish classification from regulation. None of the four maps establishes zoning, ownership, protected status, flood-zone designation, or development rights. County and municipal GIS systems, deeds, planning records, and regulatory maps are the appropriate sources for those questions.
Download the map files
The ZIP download contains four JPG maps for the same county: the 2025 general land-cover view, the forest-and-farmland layer, the impervious-surface map, and the 1985–2025 change comparison. Keeping the set together makes it easier to build consistent presentation slides, classroom handouts, or comparative reports.
Frequently Asked Questions
What is the largest land-cover class in Dutchess County?
Forest is the largest 2025 class at 52.48%. Developed land is 19.36%, agriculture is 16.71%, wetlands are 7.74%, and water is 2.91%. These values describe mapped surface cover rather than parcel-level legal land use.
Why is developed cover 19.36% while mean impervious surface is 4.39%?
Developed classes can include lawns, trees, and other permeable areas around homes and businesses. Impervious surface focuses on hard materials such as pavement and rooftops, so its countywide average can be much lower than the total developed-cover share.
Does the 10.55% class difference mean that 10.55% of the county was permanently converted?
No. It means that 10.55% of mapped cells received a different broad class in the 1985 and 2025 comparison. Some changes reflect real landscape change, but classification variation and mixed pixels can also contribute.
Map File Information
Dutchess County Land Cover Map Files
- Included Files: Use only the versions confirmed in the article and supplied images
- File Type: Use the confirmed download contents
- Intended Use: Printing, education, presentations, and map-based projects
Related Maps
- Albany County Land Cover Map
- Bronx County New York Land Cover Map
- Cattaraugus County New York Land Cover Map
Sources and references
- MRLC Annual NLCD Data — official access to Annual NLCD products and supporting data.
- USGS Annual NLCD Land Cover Classification — documentation for the land-cover classes used in Annual NLCD.
- Dutchess County Environmental Mapper — the county’s official mapping resource for its Natural Resources Inventory.
- Dutchess County: Conserve Your Land — county planning information on farmland, forests, wetlands, and other natural resources.
Green Map creates custom-edited map images using open geographic data sources such as geoBoundaries, Natural Earth, OpenStreetMap, and government open data.
These maps are edited visual materials, not raw data files, and are provided for education, documents, presentations, and graphic reference.