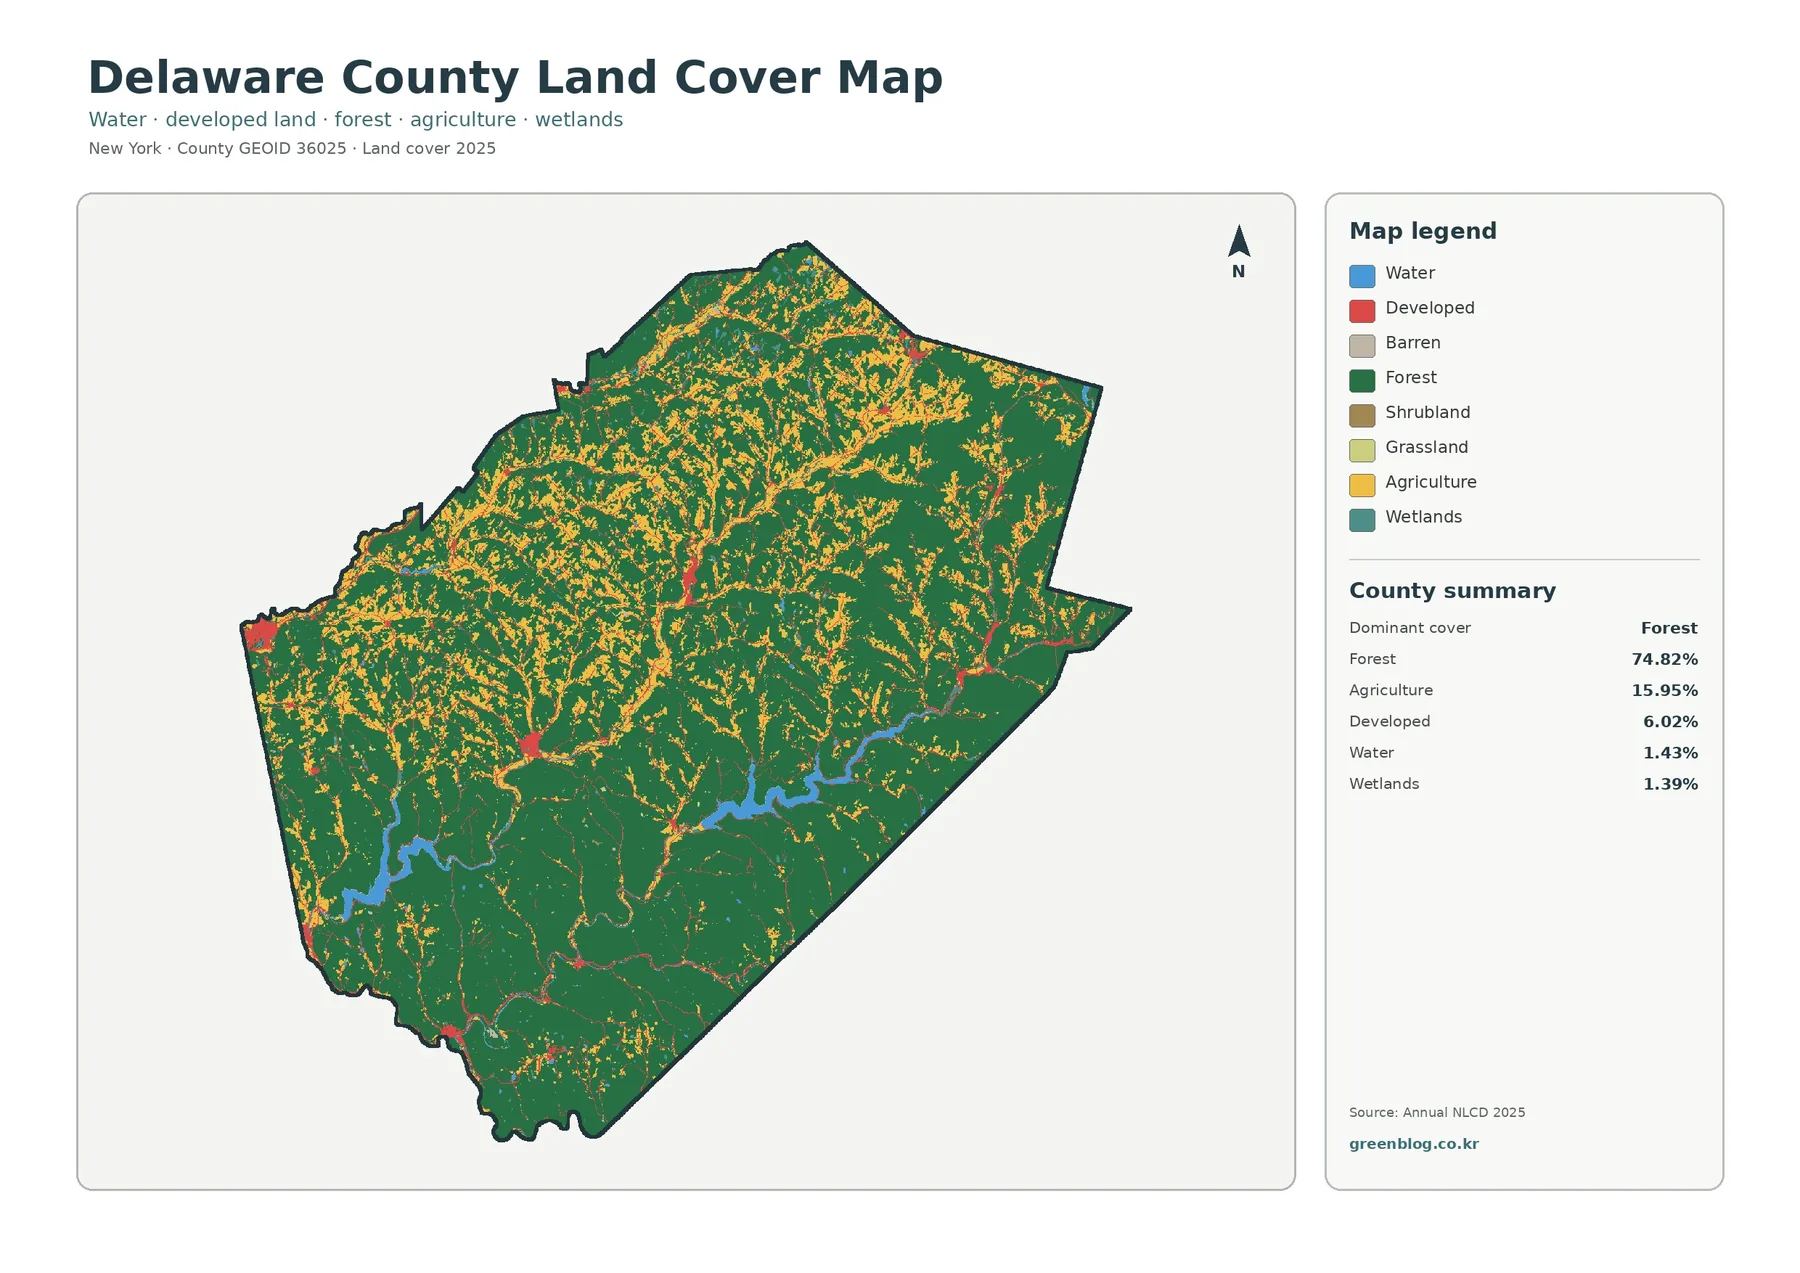
Delaware County is best understood as a largely forested part of the western Catskills rather than as a landscape dominated by towns or pavement. Forest covers 74.82% of the county in the 2025 classification, while agriculture accounts for 15.95% and developed land for 6.02%. Cannonsville Reservoir in the west and Pepacton Reservoir farther southeast provide two strong landmarks for reading the pattern.
The four maps on this page answer different questions. One establishes the full 2025 land-cover mix. Another separates forest, cropland, pasture and related rural classes. The impervious layer narrows the view to pavement, rooftops and other hard surfaces. The change layer then compares class assignments in 1985 and 2025. Together they make it possible to distinguish a forested county from the smaller places where farming, settlement and mapped change are concentrated.
Land cover is not the same as zoning, ownership or legal land use. Annual NLCD classifies the surface recorded by remote sensing. A forest-colored cell does not identify a parcel owner, and a developed cell does not describe what construction is allowed there. The maps are designed for regional interpretation and comparison rather than parcel-level decisions.
Table of Contents
A rural pattern becomes clearer when forest and farmland are separated
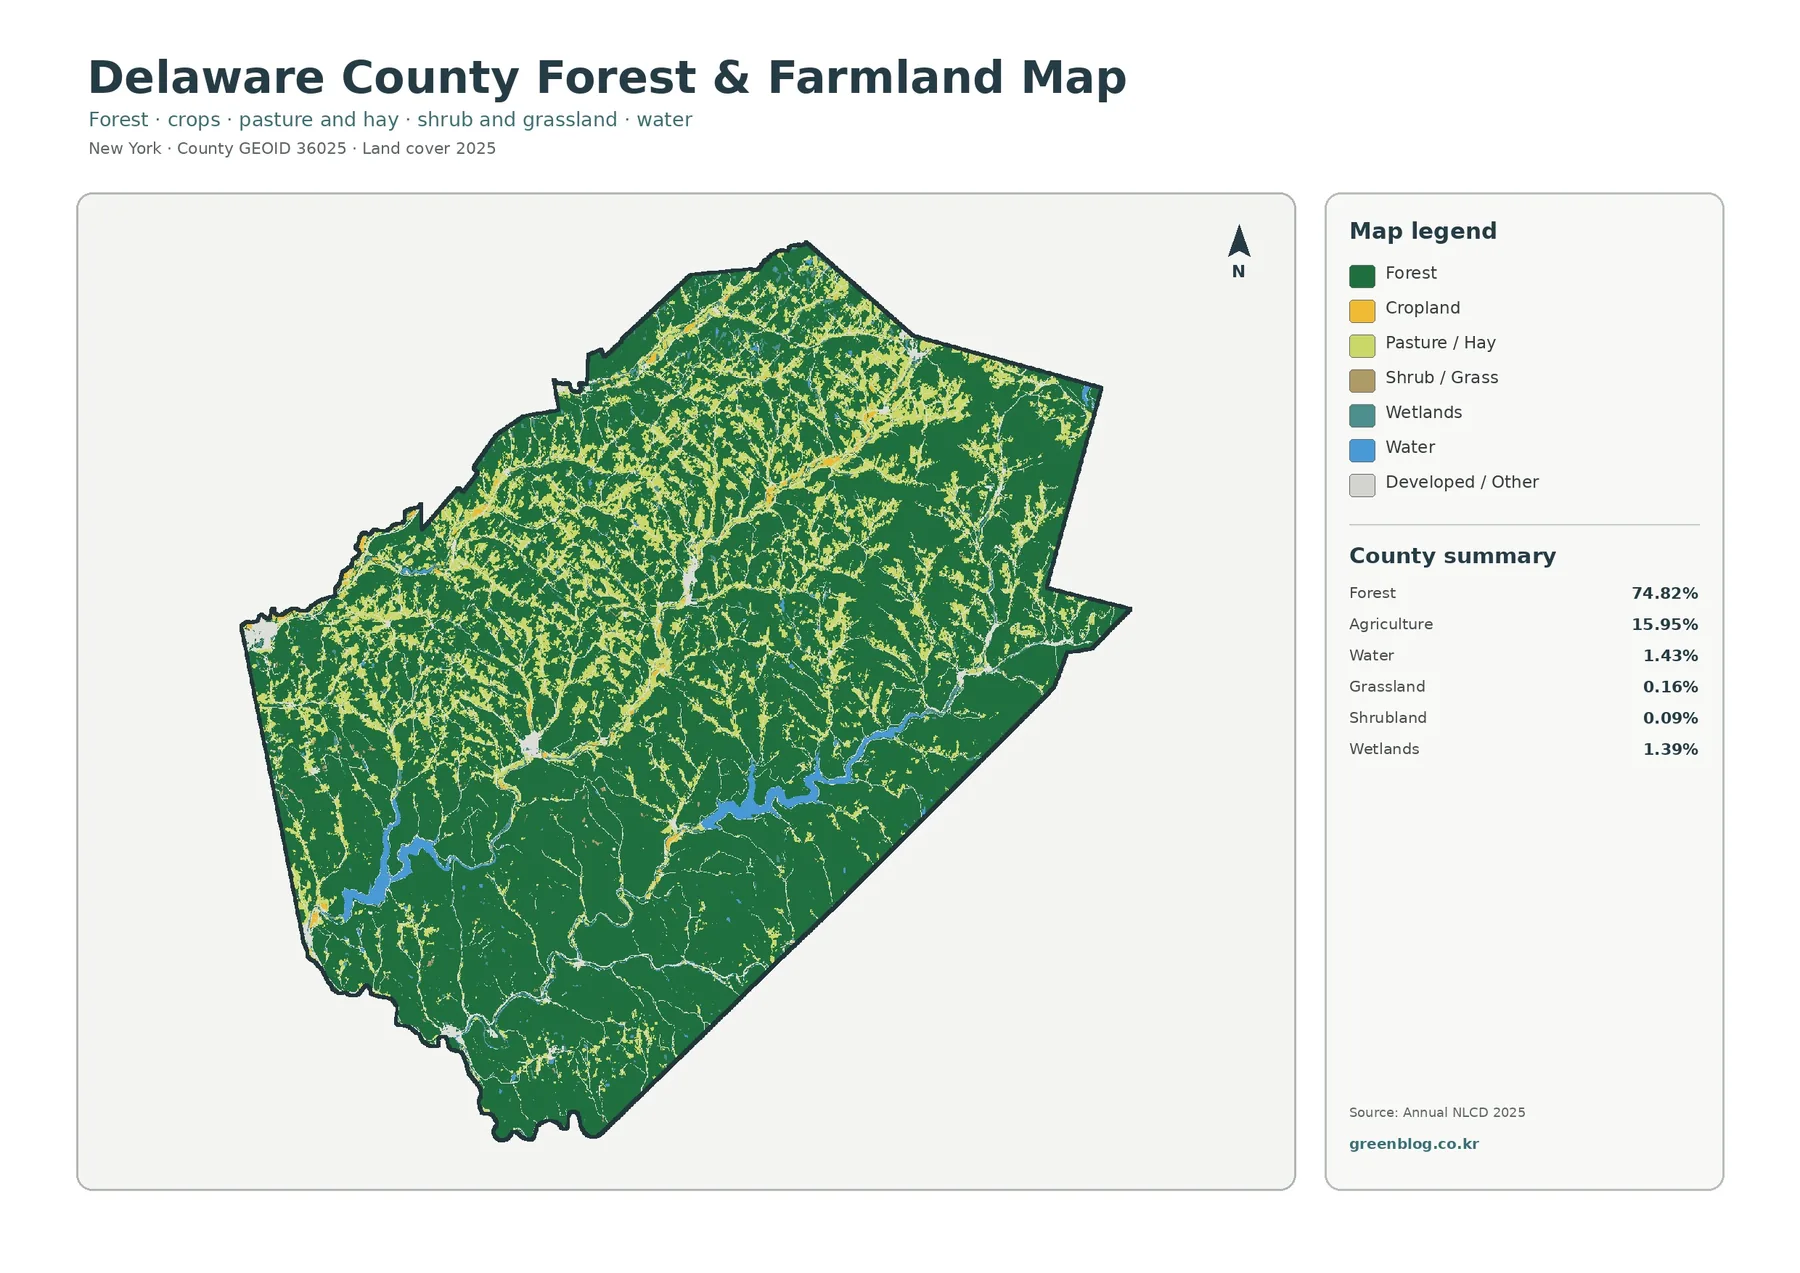
The forest-and-farmland view makes Delaware County’s rural structure easier to read than the general map alone. Forest remains the dominant class at 74.82%. Agricultural cover, 15.95%, is divided into cropland and pasture or hay. Small amounts of shrub or grass cover also appear, but neither category approaches the scale of forest or agriculture.
Open agricultural areas are especially frequent across the northern and western portions of the county. They tend to form narrow, irregular shapes rather than one broad agricultural plain. Larger forest blocks become more prominent toward the south and southeast. That contrast gives the county a patchwork of working land and woodland while preserving a strongly forested overall character.
Cannonsville and Pepacton reservoirs add an important local context. The county’s Agricultural and Farmland Protection Plan discusses both the New York City watershed and the Susquehanna watershed. That makes the relationship among farms, forests and water more than a visual curiosity. It is part of the county’s broader resource-management setting, even though the map itself does not measure water quality or farm practices.
Readers should also avoid treating each agricultural color as a farm boundary. The classification describes surface cover at raster-cell scale. It cannot identify ownership, crop type or the legal extent of an agricultural parcel. Those questions require separate agricultural, parcel or planning records.
Hard surfaces remain concentrated in small settlement pockets
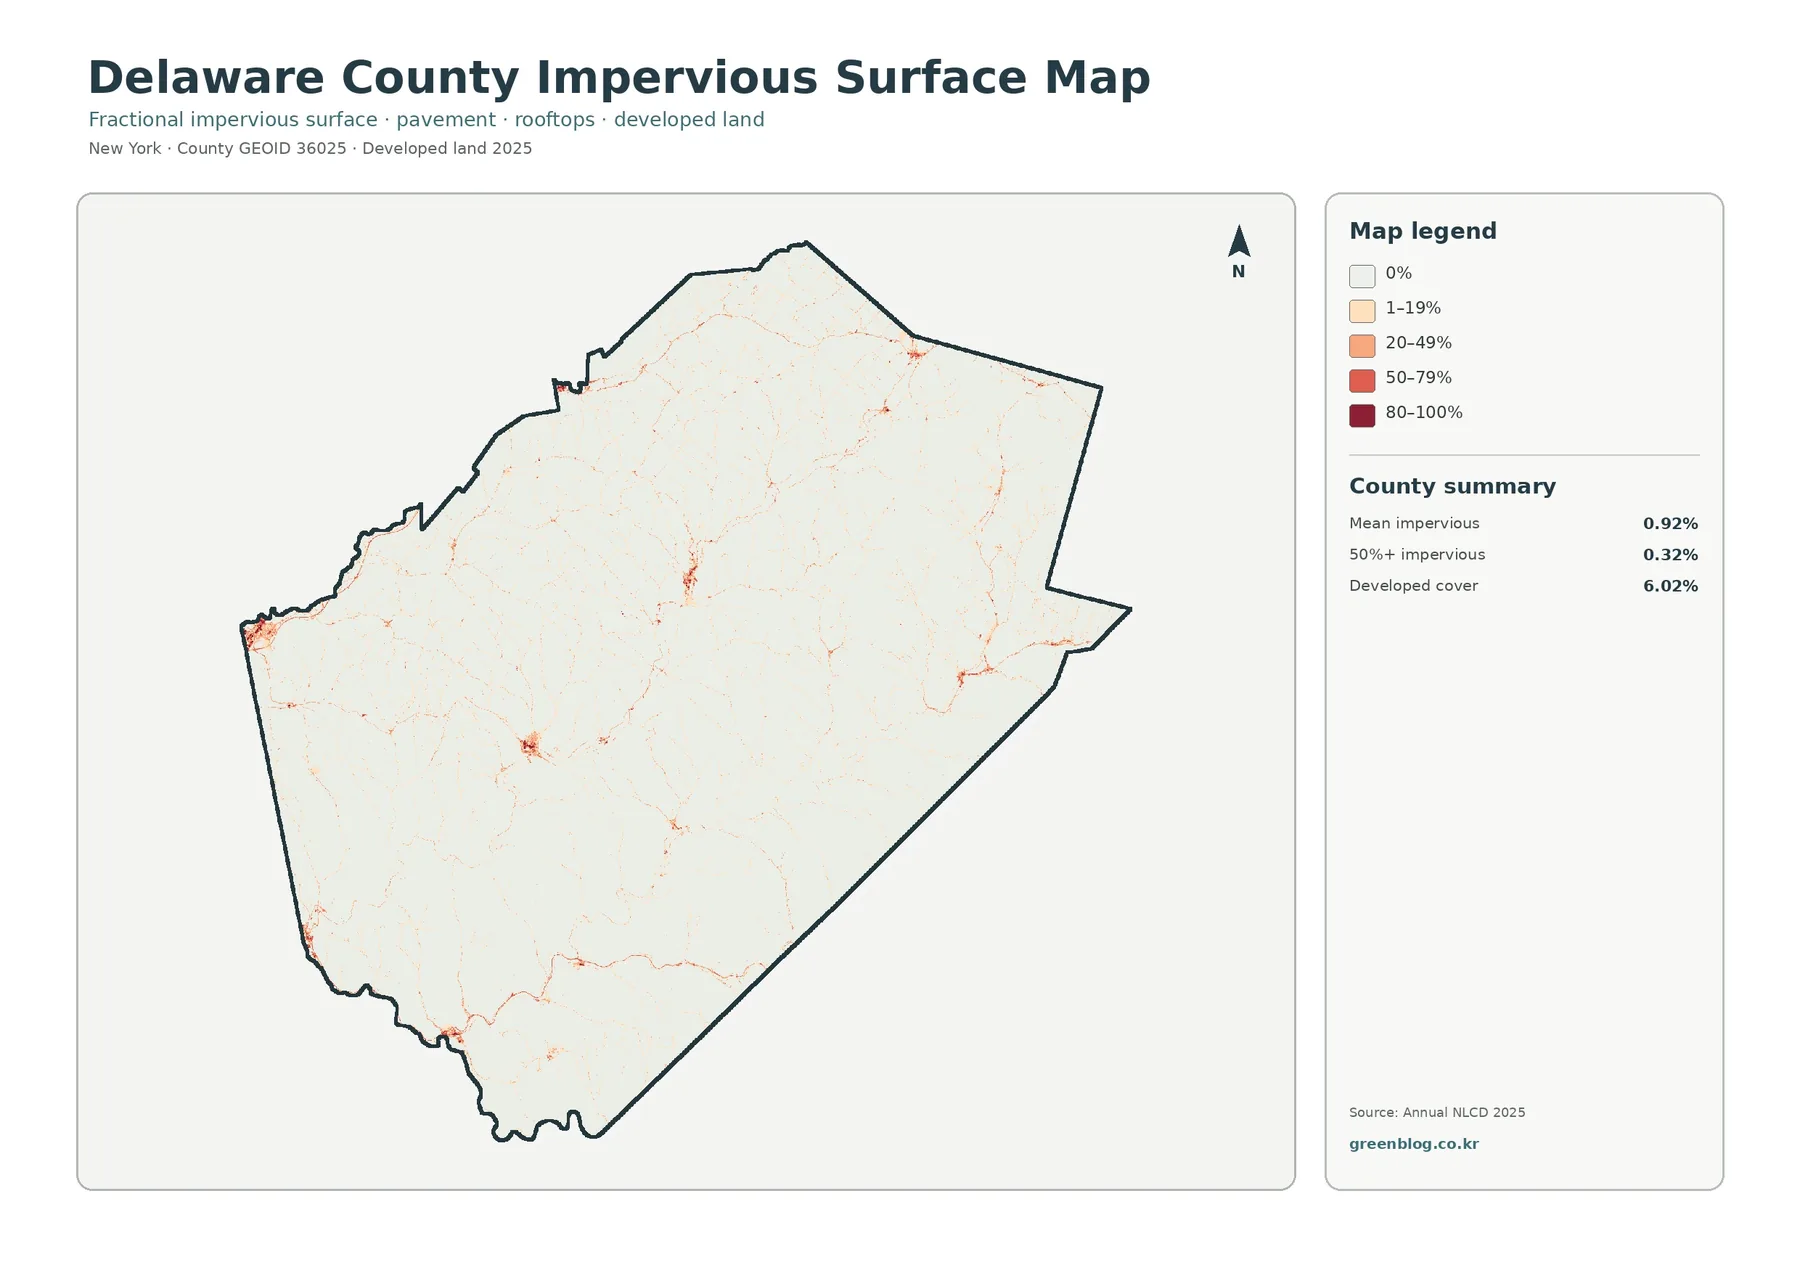
Impervious surface means pavement, rooftops and similar materials that keep water from soaking directly into the ground. Delaware County’s mean impervious value is 0.92%, and only 0.32% of the county is mapped at 50% impervious or greater. Those numbers fit the visual pattern: most of the county remains close to the lightest end of the legend.
Higher values appear in compact clusters near settlements and as thin lines along transportation routes. Several stronger patches are visible near the western edge, in central parts of the county, and toward the northeast. The pattern never becomes a continuous urban blanket. Instead, developed areas are separated by broad stretches of forest and rural land.
The 6.02% developed-cover figure should not be confused with impervious percentage. A developed land-cover class can include lawns, scattered trees and other permeable ground. Impervious mapping isolates the hard surfaces within and beyond those broader developed classes. Comparing the two layers helps explain why a rural town can be classified as developed without being mostly pavement.
This distinction can be useful in watershed education. Hard surfaces affect how rainfall moves across the ground, but the map does not predict flooding or stream condition. Slope, soil, rainfall, drainage infrastructure and channel geometry all influence runoff. The impervious layer is therefore a starting point for context, not a complete hydrologic assessment.
The full 2025 map ties forest, farms, water and settlements together
The general land-cover map restores the classes that the thematic views simplify. Forest fills most of the county, while agricultural colors trace many valleys and lower rural areas. Developed land appears as small red clusters. Water and wetlands interrupt the terrestrial pattern, with the two major reservoirs particularly easy to recognize.
Water accounts for 1.43% of the mapped county and wetlands for 1.39%. Their percentages are modest, yet their locations matter when reading the landscape. Cannonsville Reservoir creates a prominent water feature in the western half. Pepacton Reservoir forms another large blue feature farther southeast. Smaller streams and wet areas are more difficult to follow because the underlying raster generalizes narrow features.
At this scale, the map is most useful for broad relationships. It can show that agriculture is more frequent in some portions of the county than others, or that settlement clusters are small relative to the surrounding forest. It should not be used to measure a narrow stream, a road shoulder or a property boundary. Features close to the 30-meter cell size can blend with neighboring cover.
Mapped differences from 1985 to 2025 are scattered rather than widespread
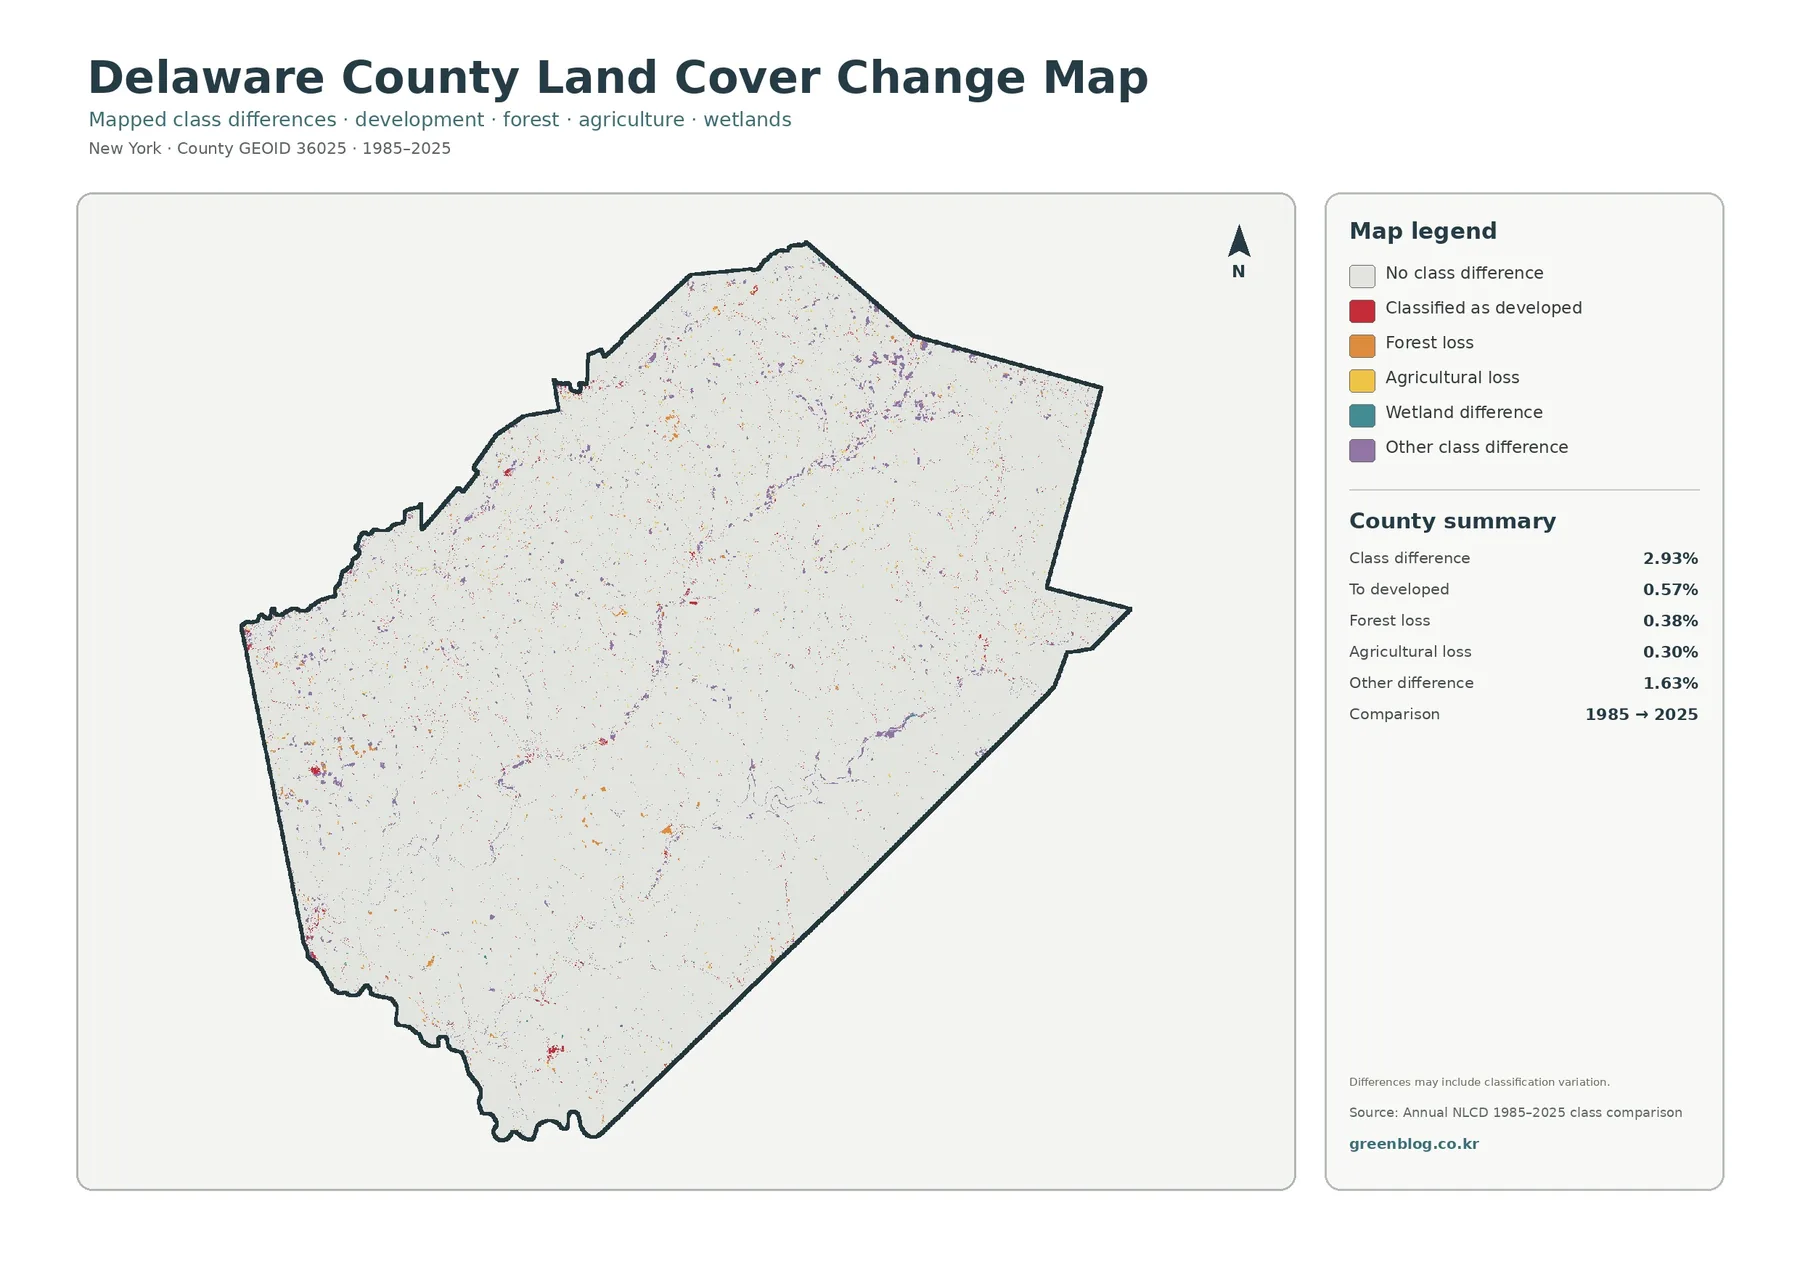
The comparison layer marks cells whose broad class differs between 1985 and 2025. Total class difference is 2.93%. The map reports 0.57% classified to developed, 0.38% forest loss, 0.30% agricultural loss and 1.63% other class difference. Most of the county therefore retains the same broad class in the two comparison years.
Change colors occur as small dots, short traces and compact patches across many parts of the county. Some developed differences sit near existing settlement or road corridors. Forest and agricultural differences are also dispersed. No single change category forms a dominant countywide zone.
A colored cell is not automatically proof of a confirmed land conversion. Remote-sensing comparisons can differ because of imagery conditions, seasonal effects, mixed pixels or classification procedures. The map itself notes that class differences may include classification variation. For a specific site, historical aerial photography and local records are better tools for confirming what actually happened.
Used carefully, the layer works well as a screening map. It helps a reader locate areas worth closer inspection and provides a quick measure of how limited or widespread mapped differences are. In Delaware County, the strongest message is broad stability combined with many small localized differences.
Reservoirs provide useful reference points for comparing the four layers
Cannonsville and Pepacton reservoirs make it easier to align the maps mentally. A reader can start at either water body, then compare the surrounding forest and farmland with nearby impervious surfaces. Moving to the change layer reveals whether the same surroundings contain mapped differences between the two comparison years.
This method is useful because each layer emphasizes a different feature. The general map may make a nearby settlement obvious, while the impervious map shows whether hard surfaces are dense or sparse. The forest-and-farmland map makes rural openings easier to trace. The change layer adds a time comparison without implying that every difference has the same cause.
Delaware County’s watershed context also makes those comparisons relevant to local environmental discussion. County planning documents describe agricultural management within both New York City water-supply lands and the Susquehanna watershed. The maps cannot evaluate water quality, but they can provide a clear geographic backdrop for discussions that use more detailed environmental data.
Ways to use the set in classrooms, reports and local research
A classroom can use the maps to practice reading legends and comparing the same location across several themes. Students might identify a major forest block on one map, find the nearest agricultural opening on another, and then check whether either place appears on the change layer. The exercise demonstrates that a map’s purpose shapes what is emphasized.
For a watershed presentation, the reservoir locations offer an intuitive starting point. The impervious map can be paired with the general land-cover map to discuss where hard surfaces occur near water. A rural-land presentation might instead combine forest and farmland with the county agricultural plan. In both cases, the map works best as visual context rather than as the sole evidence for a policy conclusion.
Report designers can use the four JPG files as a coordinated set because they share the same county outline and a consistent layout. The images can support printed handouts, slide decks and comparative graphics. Web readers can use the lighter WebP versions to inspect the same themes before downloading the larger files.
Scale, classification and mixed pixels matter
Annual NLCD is a raster product, which means the landscape is represented by a grid of cells. Each cell receives a classification based on the dominant surface information available to the dataset. A narrow road, a small building and adjacent vegetation may all influence the same cell. When several cover types contribute to one cell, the result is often described as a mixed pixel.
That generalization matters most near boundaries. A sharp edge between forest and agriculture on the screen is not a surveyed property line. Small wetlands, thin streams and narrow transportation features can also be simplified. The maps are appropriate for countywide patterns, but site-level analysis needs higher-resolution or parcel-specific information.
Date is another limitation. The current-cover maps represent 2025 data, while the change product compares 1985 with 2025. New construction, logging, crop rotation, vegetation recovery or other changes after the observation year may not appear. Any decision that depends on current site conditions should be checked against newer imagery or field information.
Download the four map files
The ZIP download contains the four original JPG maps used for this county: general land cover, forest and farmland, impervious surface and developed land, and the 1985–2025 change comparison. Keeping the files together makes it easier to build a consistent presentation or compare the same location across themes.
Frequently Asked Questions
What is the dominant 2025 land cover in Delaware County?
Forest is the dominant class at 74.82%. Agriculture accounts for 15.95%, while developed land is 6.02%. These values describe mapped land cover rather than parcel-level legal land use.
Why is developed land 6.02% when mean impervious surface is only 0.92%?
Developed land is a broad cover category that can include lawns, trees and other permeable surfaces. Impervious percentage isolates hard surfaces such as pavement and rooftops, so it is expected to be lower in a rural county.
Does the 2.93% class difference mean that exactly 2.93% of the county was physically transformed?
No. It means the mapped class differs between the 1985 and 2025 comparison products for that share of cells. Real change may be included, but classification variation and mixed pixels can also contribute.
Map File Information
Delaware County Land Cover Map Files
- Included Files: Use only the versions confirmed in the article and supplied images
- File Type: Use the confirmed download contents
- Intended Use: Printing, education, presentations, and map-based projects
Related Maps
Sources and references
- MRLC Annual NLCD Data — official access to Annual NLCD products and related data.
- USGS Annual NLCD Land Cover Classification — descriptions of land-cover classes used in Annual NLCD.
- U.S. Census Bureau TIGER/Line Shapefiles — official geographic boundary files and county identifiers.
- Delaware County Agricultural and Farmland Protection Plan — county-specific background on agriculture, watersheds and natural-resource concerns.
Green Map creates custom-edited map images using open geographic data sources such as geoBoundaries, Natural Earth, OpenStreetMap, and government open data.
These maps are edited visual materials, not raw data files, and are provided for education, documents, presentations, and graphic reference.