A Chad Map must show two contrasting patterns on one page: enormous northern provinces extending into the Sahara and a tighter group of divisions in the south. The collection presents that structure as a labeled black-and-white map, a labeled color map, and an unlabeled outline map with matching boundaries.
Chad is a landlocked country in north-central Africa. Libya lies to the north, Niger and Nigeria to the west, Cameroon to the southwest, the Central African Republic to the south, and Sudan to the east. N’Djamena, the capital, sits at the far western side near Cameroon. That off-center location is easier to understand when the national border and neighboring countries appear together.
Each supplied file measures 1200 × 849 pixels and uses the WebP format. Instead of forcing labels, color separation, and writing space into one crowded graphic, the Chad Map collection divides those functions among three matching versions. Readers can select the amount of detail that suits a lesson, article, or slide.
Table of Contents
Reading the Regional Structure on a Chad Map
The national outline stretches much farther from north to south than many readers expect. Tibesti occupies the broad northwest, Borkou extends below it, and Ennedi-Ouest and Ennedi-Est form the northeastern side. These large areas leave far more space around labels than the compressed divisions near the southern border.
Across the middle of the country, Kanem, Bahr el Gazel, Batha, Wadi Fira, and Ouaddaï provide a transition between the vast Saharan north and the more closely divided south. Lac appears toward Lake Chad in the west, while Sila and Salamat help define the southeastern side toward Sudan and the Central African Republic. Guéra, Hadjer-Lamis, and Chari-Baguirmi link the central belt with the western capital area and the southern provinces.
The southern end contains several smaller units, including Mayo-Kebbi Ouest, Mayo-Kebbi Est, Tandjilé, Logone Occidental, Logone Oriental, Mandoul, and Moyen-Chari. On a reduced screen, those names sit much closer together than Tibesti or Borkou. A Chad Map therefore has to be read at two scales: the broad regional pattern is visible immediately, but the southern labels reward a closer view.
Egypt appears in the upper-right background and South Sudan appears farther southeast because the frame shows a wider part of Africa. Neither country shares a direct border with Chad. The six actual neighbors shown around the country are Libya, Niger, Nigeria, Cameroon, the Central African Republic, and Sudan.
The 23 Administrative Divisions Shown
The labeled maps present 23 first-level administrative areas, including N’Djamena. Moving generally from north to south, readers can identify Tibesti, Borkou, Ennedi-Ouest, Ennedi-Est, Kanem, Lac, Bahr el Gazel, Batha, Wadi Fira, Ouaddaï, Hadjer-Lamis, Guéra, Sila, Salamat, Chari-Baguirmi, Mayo-Kebbi Est, Mayo-Kebbi Ouest, Tandjilé, Moyen-Chari, Mandoul, Logone Occidental, Logone Oriental, and the capital area.
Several labels reflect French usage, including Ennedi-Ouest, Ennedi-Est, and Ouaddaï. The Chad Map therefore helps readers check both regional positions and longer Roman-letter names within irregular boundaries. It does not show roads, terrain shading, population density, or detailed city networks; its scope is the country, its divisions, and surrounding states.
Three Matching Map Versions
The three files share the same 1200 × 849 canvas and geographic placement. That consistency makes it possible to replace one Chad Map with another in a document without rebuilding the surrounding layout. What changes is the amount of labeling and color, not the national extent or the basic administrative geometry.
Black-and-White Reference Map
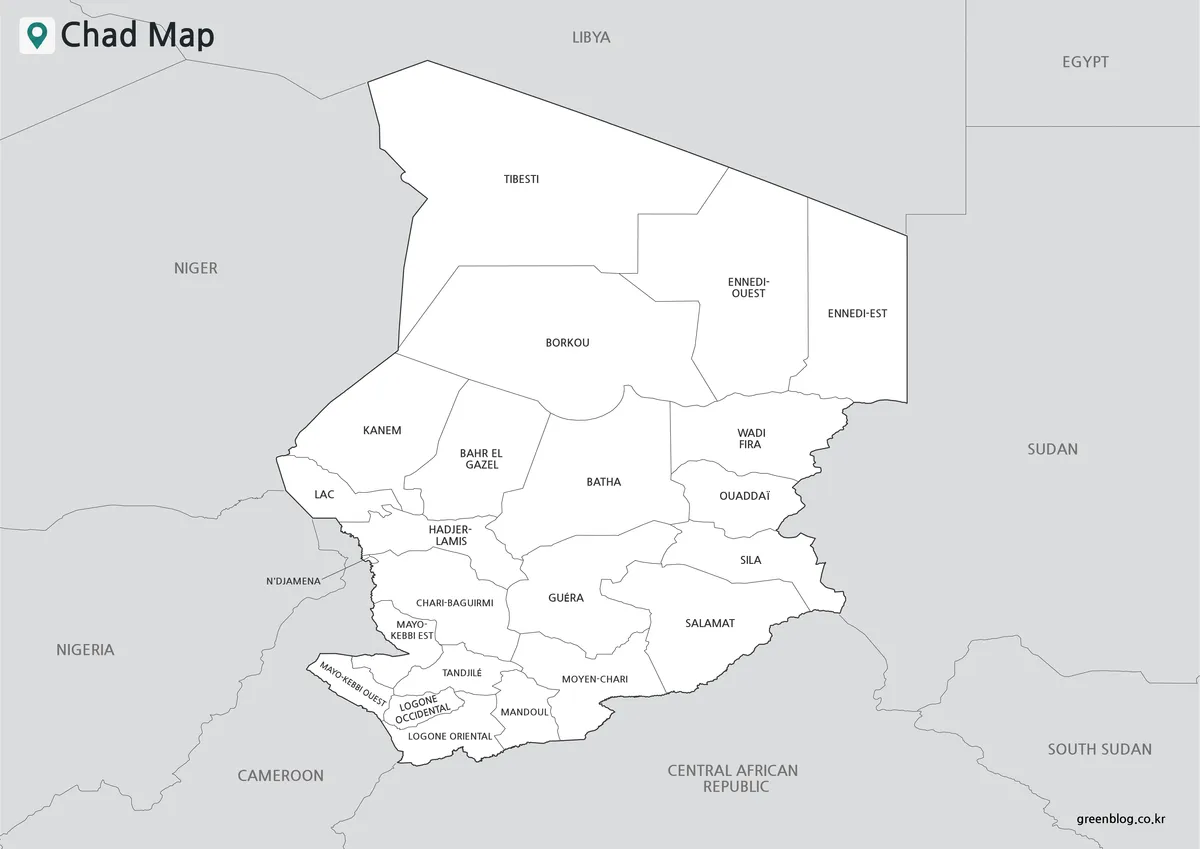
The first image uses white administrative areas, fine internal lines, and dark labels. This Chad Map keeps attention on names and boundary relationships, making it the clearest choice for a report that already contains colored charts or photographs. Tibesti and Borkou remain easy to locate at a reduced size, while the denser southern cluster can be enlarged when individual spellings need to be checked.
Monochrome treatment gives the page a quieter visual hierarchy for written notes, answer sheets, or article illustrations. Surrounding countries remain visible in gray, allowing readers to orient Chad without confusing the background with the 23 internal divisions.
Color-Coded Administrative Map
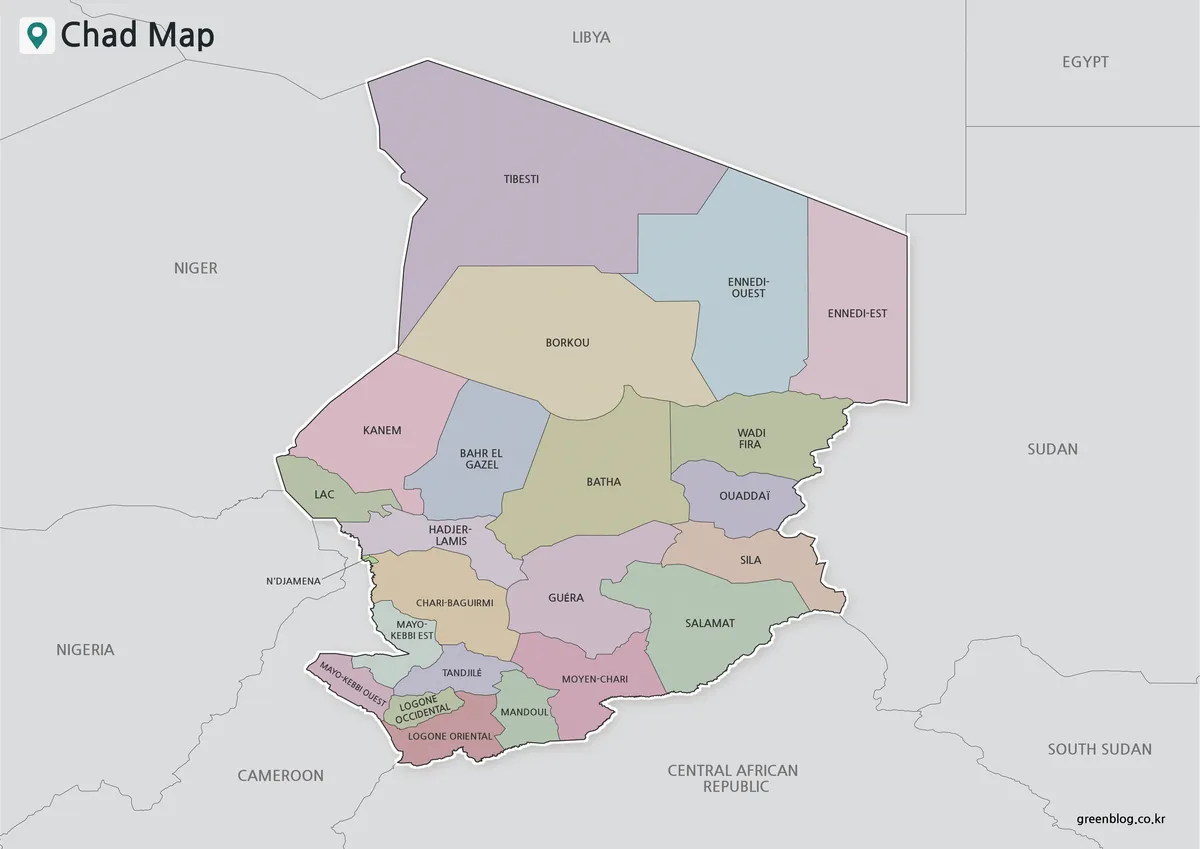
The second image assigns a soft contrasting color to each administrative area. Color separation makes adjoining regions easier to follow across central Chad, where Batha meets several neighbors and where Guéra, Moyen-Chari, and Salamat create a more complex set of boundaries. The colors do not represent population, elevation, climate, or economic values; they simply distinguish one division from the next.
During a presentation, the colored version supports explanations that move from the Tibesti–Borkou–Ennedi area through Kanem and Lac to the Logone and Mayo-Kebbi regions. The pale palette separates neighboring areas without implying a statistical scale.
Blank Outline for Labels and Annotations
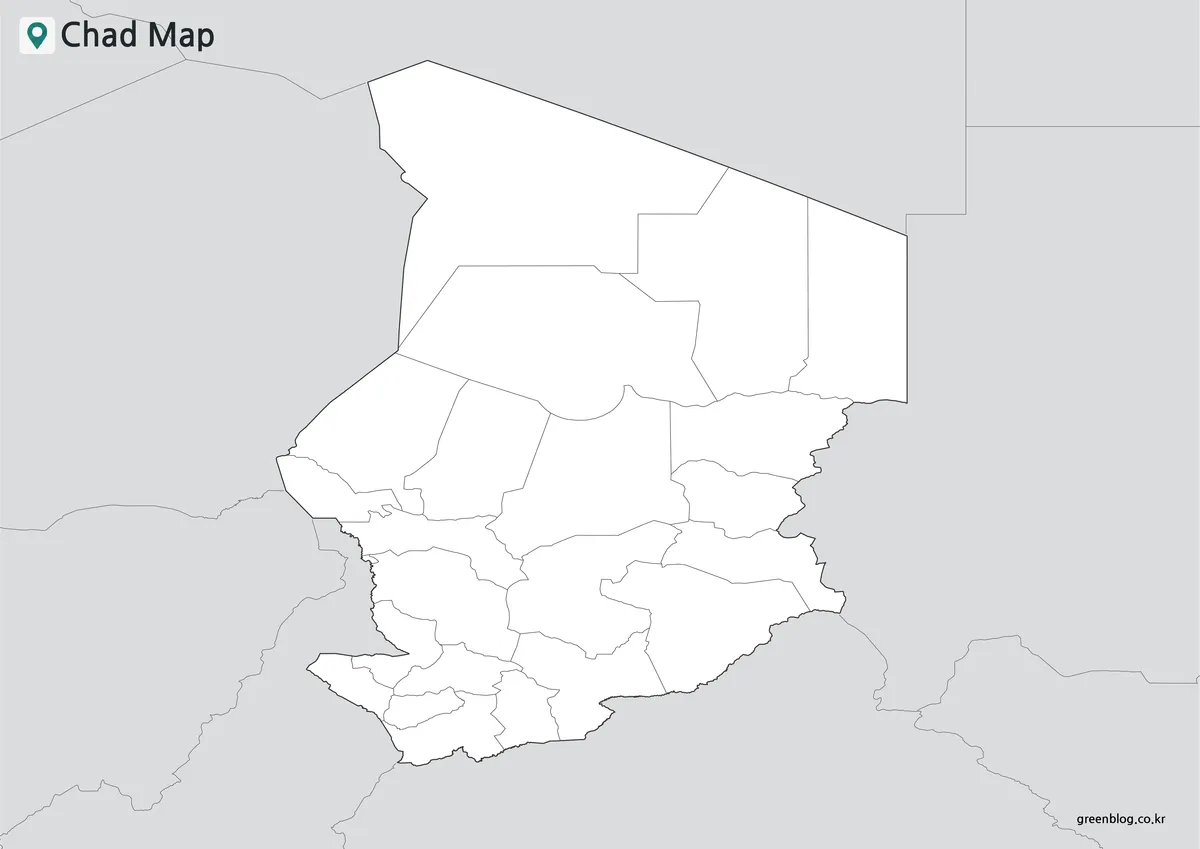
The third Chad Map removes the place names and surrounding-country labels while retaining the national outline and internal boundaries. Its open areas can hold handwritten region names, numbered quiz answers, capital markers, directional notes, or custom color groups. A learner can begin with Tibesti in the north, mark Ouaddaï in the east and Logone Oriental in the south, and then fill neighboring divisions around those anchors.
For a simple infographic, readers can group northern, central, and southern areas or mark the capital and six border directions. The supplied file is a raster WebP image rather than a confirmed vector source, so edits should remain within the available pixel dimensions.
Choosing the Best Version for the Task
Choose the black-and-white file when names matter more than visual grouping. It is the most restrained option for reports, reference sheets, and monochrome documents. Select the color file when an audience needs to distinguish neighboring administrative areas quickly, especially during a slide presentation or a regional comparison lesson.
The outline version is better when readers must add information rather than only view it. In class, the labeled basic map can serve as the reference and the blank map as the exercise. A Chad Map viewed on a phone may make southern names appear small, so open it at full size. Before large-format printing, test the intended dimensions; no physical print size is claimed for these 1200 × 849 files.
Practical Ways to Use the Files
In a geography lesson, the three versions can form a simple sequence. Students first study the labeled black-and-white map, compare northern and southern division sizes on the color map, and then complete the blank outline from memory. This approach tests both name recognition and relative position without requiring a separate worksheet design.
Writers can use the basic file before discussing Lake Chad, N’Djamena, or border relationships. The color file clarifies regional differences, while the outline supports custom direction groups or arrows toward the six neighboring countries. Because all three images share the same dimensions, a slideshow can switch among them without changing its page composition.
Frequently Asked Questions
How many administrative areas appear on the maps?
The labeled versions show 23 first-level areas, including N’Djamena. The northern provinces occupy much larger spaces, while numerous smaller divisions are grouped in the south. The outline file preserves the same internal boundary structure but removes the names so readers can supply their own labels.
Which Chad Map is best for a classroom worksheet?
Use the blank outline when students need to write names, number regions, or apply their own colors. Keep the labeled black-and-white version nearby as an answer reference. The matching boundaries allow learners to compare their work directly without adjusting to a different projection or page arrangement.
Do the colors show population density or another statistic?
No. The pale colors only separate adjacent administrative divisions. They do not encode population, elevation, land cover, climate, or economic data. Readers who want to add a data theme should use the outline map and create a separate legend based on a verified dataset.
Are Egypt and South Sudan neighboring countries of Chad?
No. Both names appear in the wider background of the supplied images, but neither country shares a direct border with Chad. The bordering countries are Libya, Niger, Nigeria, Cameroon, the Central African Republic, and Sudan. This distinction is worth noting when the map is used for regional orientation.
What is included in the ZIP download?
The single ZIP archive contains three WebP images: the labeled black-and-white map, the labeled color map, and the unlabeled outline map. Each image measures 1200 × 849 pixels. No PDF, SVG, editable vector source, or guaranteed physical print size is included.
Map File Information
The ZIP archive combines the three matching Chad administrative map images in one download.
- Included Versions: Labeled black-and-white, labeled color, and unlabeled outline maps
- File Type: WebP images in one ZIP archive
- Image Dimensions: 1200 × 849 pixels each
- Intended Use: Reference pages, classroom activities, presentations, and custom annotations
Related Maps
Additional Resources
- Chad Country Profile — UNData: Review United Nations reference figures for Chad’s area, population, capital, and selected social and economic indicators.
Green Map creates custom-edited map images using open geographic data sources such as geoBoundaries, Natural Earth, OpenStreetMap, and government open data.
These maps are edited visual materials, not raw data files, and are provided for education, documents, presentations, and graphic reference.