Watonwan County lies in south-central Minnesota, where St. James serves as the clearest road and settlement reference point. MN 60 runs through St. James toward Butterfield in the west and Madelia in the east, while MN 4 meets the city from the north. Smaller communities such as Lewisville, Odin, Ormsby, Darfur, and La Salle are spread across a broad agricultural landscape rather than forming one continuous urban area. The high-resolution JPG versions of the maps on this page are available together in the download ZIP below.
The county is especially easy to understand by following the Watonwan River system. The North Fork crosses the northern half, the main river bends through the middle, and the South Fork rises from the southern part of the county before joining the larger channel. St. James and Madelia sit near this network, while higher ground occupies much of the west and southwest. Comparing roads, water, and elevation reveals a consistent west-to-east transition across the county.
Table of Contents
St. James is the road hinge between Butterfield and Madelia
On the general county map, St. James is the easiest place to use as an anchor. MN 60 enters from the Butterfield side, passes through the St. James area, and continues east toward the Madelia side of the county. MN 4 approaches from the north and meets the St. James road network. Once those routes are fixed, the county’s other communities become much easier to place without relying on a long list of compass directions.
Butterfield sits west of St. James on the same broad east–west corridor. Madelia forms a separate center near the eastern side and close to MN 15, which provides a strong north–south reference there. Lewisville lies farther south in the eastern half, while Odin and Ormsby are near the southern boundary. Darfur and La Salle occupy smaller positions in the north. The overall pattern is one of widely spaced towns separated by farmland, not a dense chain of adjacent municipalities.
A railroad line is also visible between the St. James and Madelia areas. Watonwan County’s official background page notes that railroads once played a major role in the local economy, while state highways, cars, and trucking later became more important. The present map reflects that shift: road junctions at St. James and the east-side connection around Madelia are now the most obvious transportation features for a reader looking at the county as a whole.
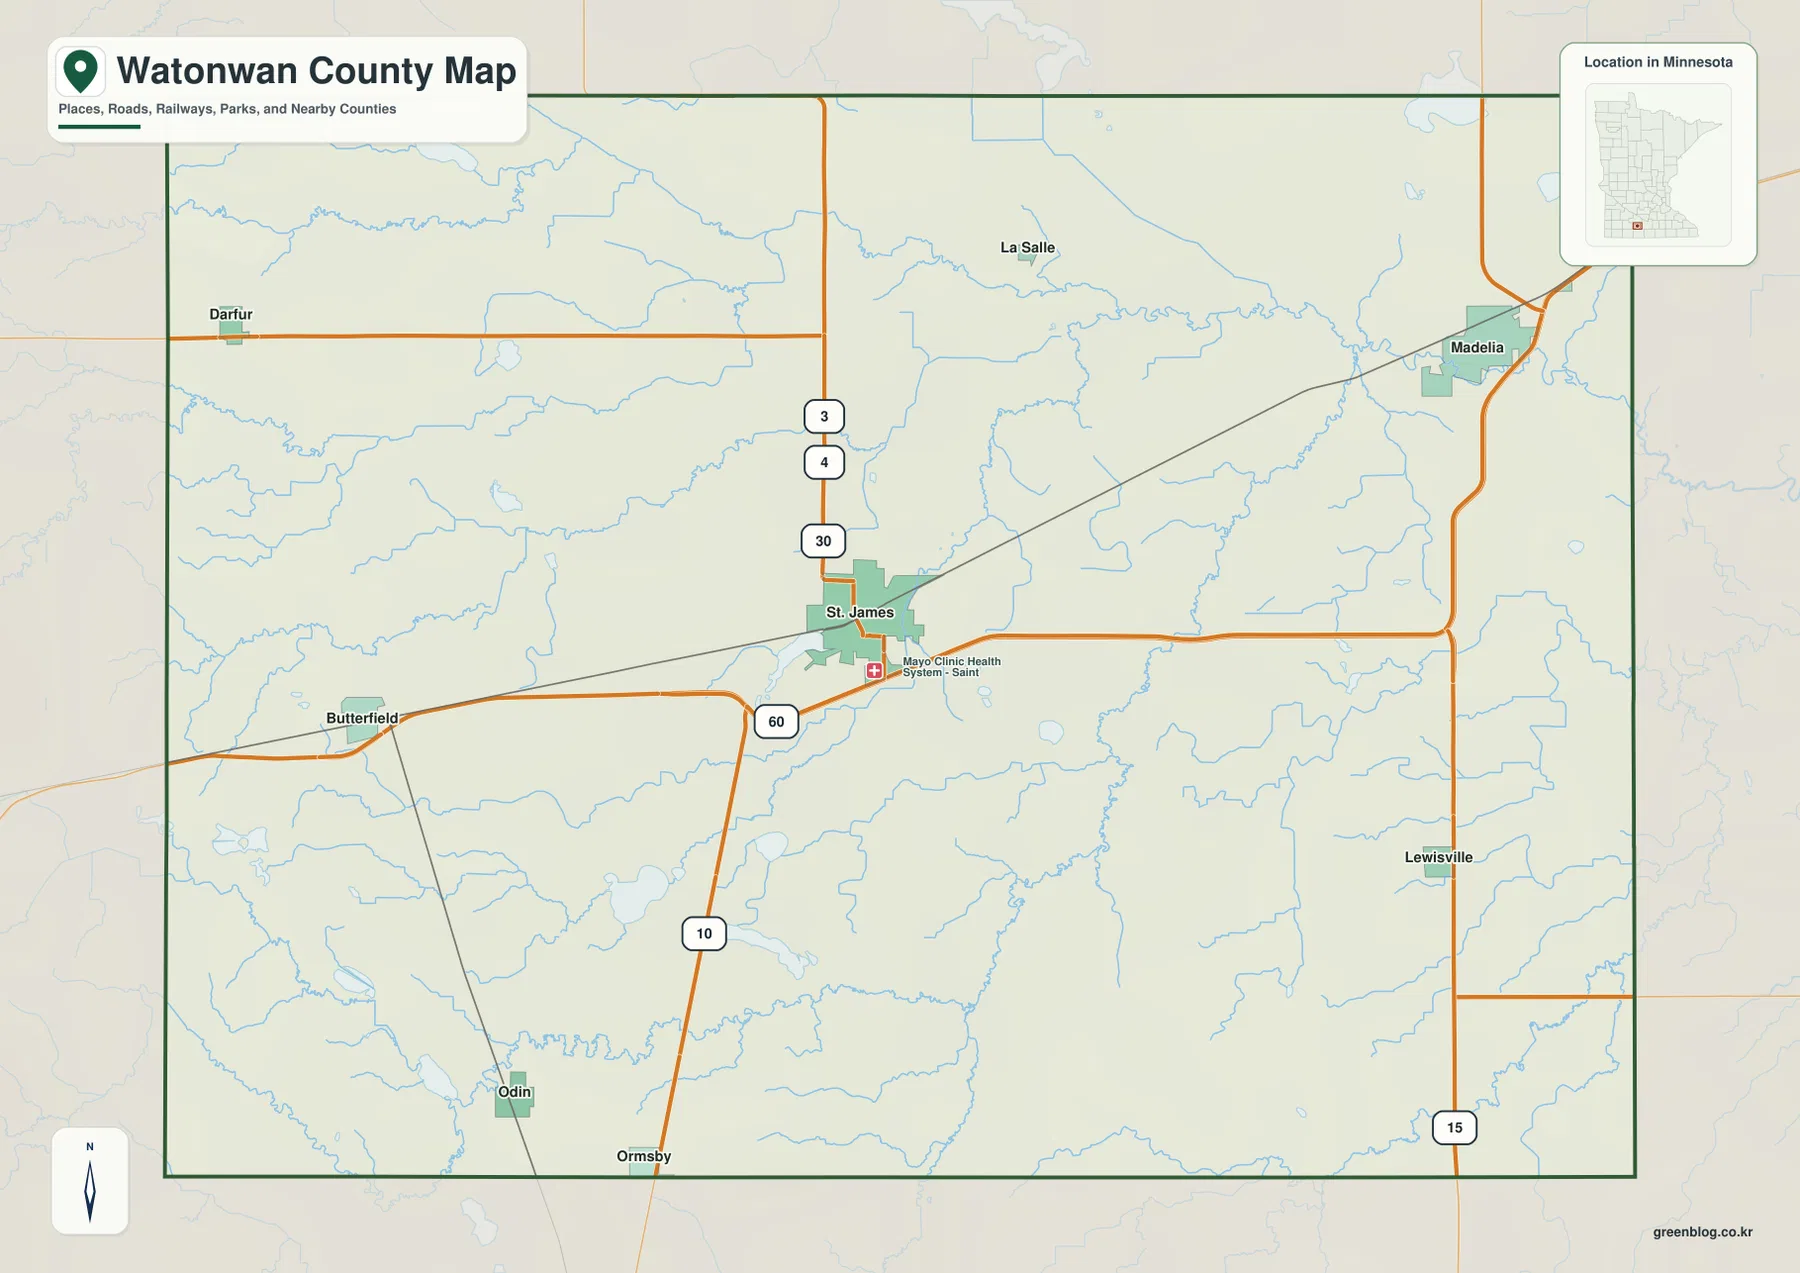
This map is designed for county-scale orientation rather than live navigation. It helps with municipal position, major roads, and the overall county boundary, but it does not show current construction, closures, speed restrictions, or every local road. For a driving trip, current MnDOT information should be checked separately. For geographic comparison, the simplified road layout makes the spacing among St. James, Madelia, Butterfield, and the smaller towns easy to see.
Two larger towns stand out among a widely spaced city pattern
The city map highlights six communities with reference values in its CITY INDEX: St. James at 4,767, Madelia at 2,327, Butterfield at 535, Lewisville at 215, Ormsby at 136, and Odin at 126. These numbers are useful for comparing the cities represented on the map, but they should not be treated as a replacement for the latest official Census estimates. The important visual point is the sharp size difference between St. James and Madelia and the much smaller communities around them.
St. James occupies the center of the county and is the largest highlighted city, while Madelia is clearly separated to the northeast. Butterfield is west of St. James, and Lewisville appears in the southeastern portion. Ormsby and Odin sit close to the southern edge. The result is a map with two main reference centers and several small towns at substantial distances from one another rather than a single dominant metropolitan cluster.
Darfur and La Salle appear on the general map but not in the six-city ranking, which is an important distinction. Watonwan County’s official About Us page states that the county has 12 townships and eight cities. The city index is therefore a selected comparison rather than a complete municipal inventory. Using the city map together with the general map prevents the ranked list from being mistaken for the full set of communities in the county.
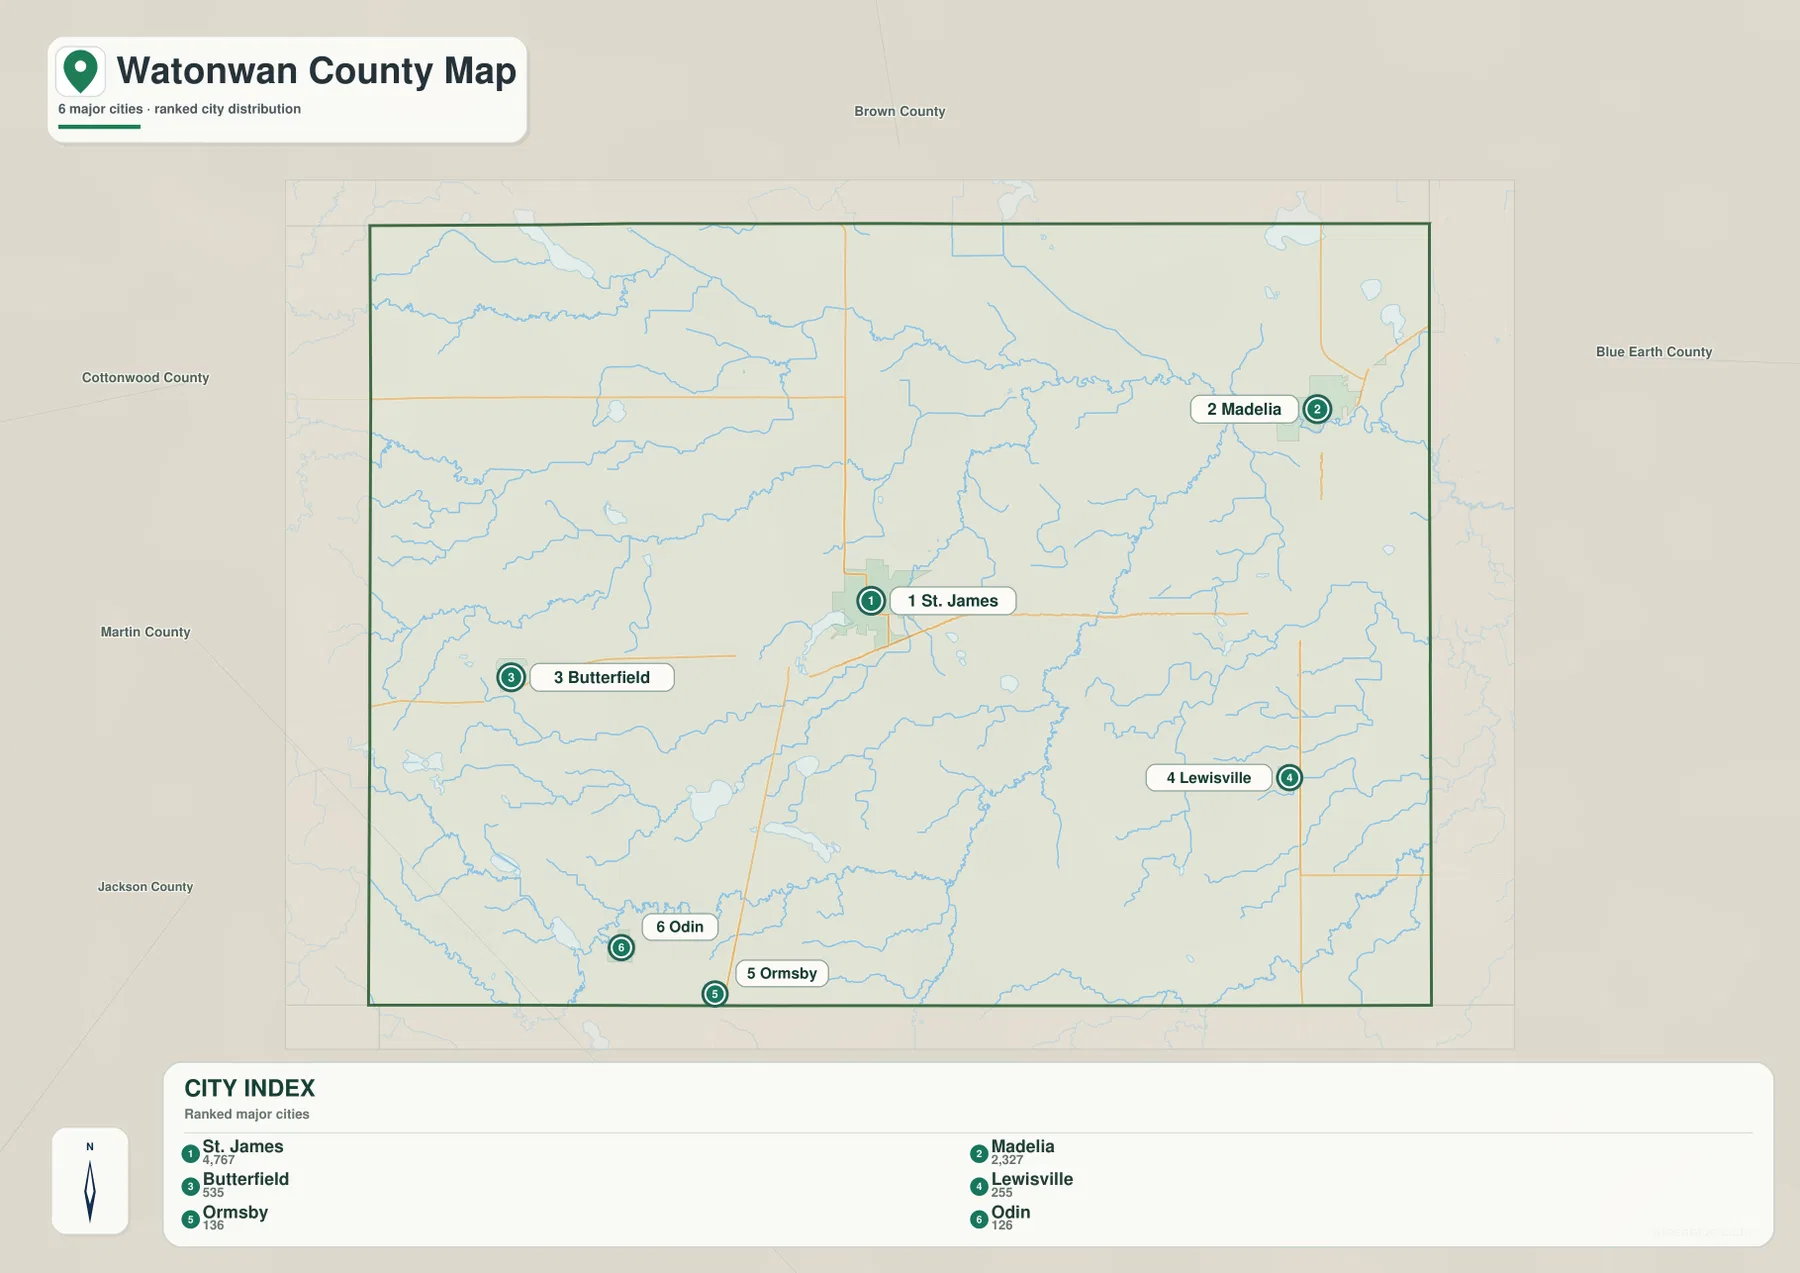
The map is also useful for judging spacing. St. James and Madelia are both major reference points, yet they are not adjacent urban areas. Odin and Ormsby are much farther south, and Butterfield is separated from St. James by open agricultural land. Those gaps matter when thinking about county services, school travel, local events, or any other activity that requires moving between communities. Actual driving distances still depend on the road network and should be checked with current routing tools.
Three Watonwan River channels organize the county’s drainage
The water map has a distinctive structure because the Watonwan River system appears in three major pieces. North Fork Watonwan River enters from the northwest and runs across the northern half. The main Watonwan River occupies the central drainage, and South Fork Watonwan River rises from the southern portion before joining the larger system. Their convergence gives the county a branching pattern that is easy to match with the lower terrain on the elevation map.
Several named tributaries add detail to that framework. Butterfield Creek crosses the western-central part of the county, St James Creek drains areas south and southwest of St. James, Spring Branch Creek appears farther east, and Perch Creek is labeled near the southeast. These streams do not behave like isolated blue lines; they collect water from the higher western and southern ground and feed into the larger Watonwan River network.
Small lakes provide additional landmarks. St James Lake lies close to the St. James area, while Kansas Lake and Long Lake sit farther south. Irish Lake is near the southern boundary, Wood Lake is in the northwest, and Emerson Lake appears near the northeast edge. The Minnesota Pollution Control Agency describes the Watonwan River as rising in Cottonwood County and flowing through northern Watonwan County and western Blue Earth County before joining the Blue Earth River.
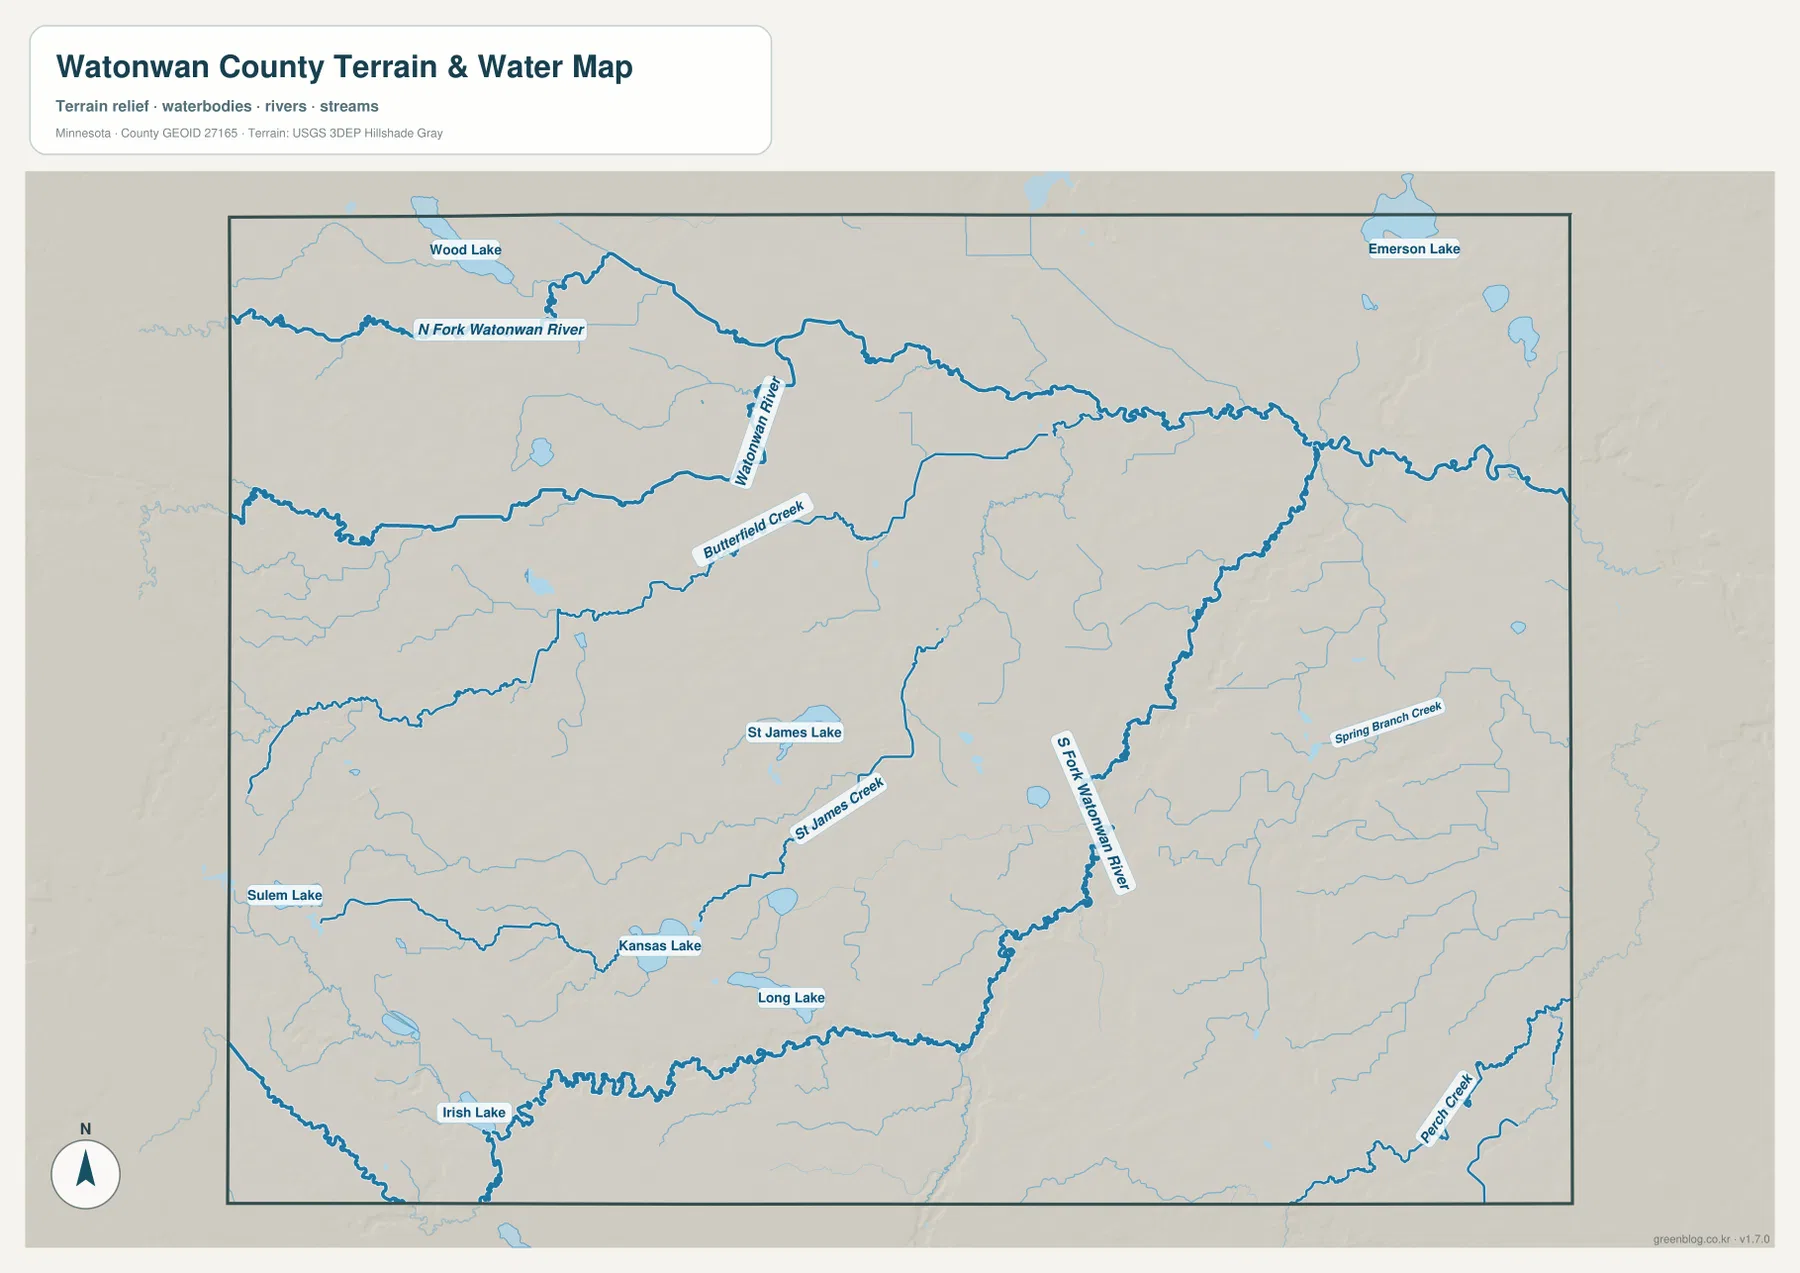
This image is a county-scale water reference, not a floodplain, water-quality, property, drainage-permit, or navigation product. Agricultural drainage and stream management can require much more detailed and current information than a general map provides. For those decisions, the county, Minnesota Pollution Control Agency, and other responsible water agencies should be consulted. The value of this map is orientation: it shows how rivers, creeks, lakes, and towns fit together across the county.
Elevation falls from western high ground toward the eastern river valleys
The elevation legend reports an actual range of about 294 to 396 meters and a mean near 334 meters. Brown and orange tones occupy much of the west and southwest, while the center shifts toward lighter green and the northeast becomes distinctly lower. The total difference is a little more than 100 meters, but over a largely agricultural county that gradual change is enough to help explain the broad direction of the drainage network.
Lower corridors align especially well with the North Fork Watonwan River and with the main river as it approaches the eastern side. In the south, the South Fork and smaller channels also occupy shallow low areas that cut through higher land. When the water and elevation maps are compared, the tributaries no longer look arbitrary: they follow subtle valleys that lead away from the western and southwestern uplands toward the central and eastern river system.
St. James sits between the highest western ground and the lowest eastern valley areas rather than at either extreme. Madelia is closer to the low eastern corridor where the Watonwan River leaves the county, while the Butterfield side rises toward warmer orange and brown colors. This west-to-east contrast is one of the clearest county-specific features on the map and helps distinguish Watonwan County from flatter areas where river valleys are less visible in shaded relief.
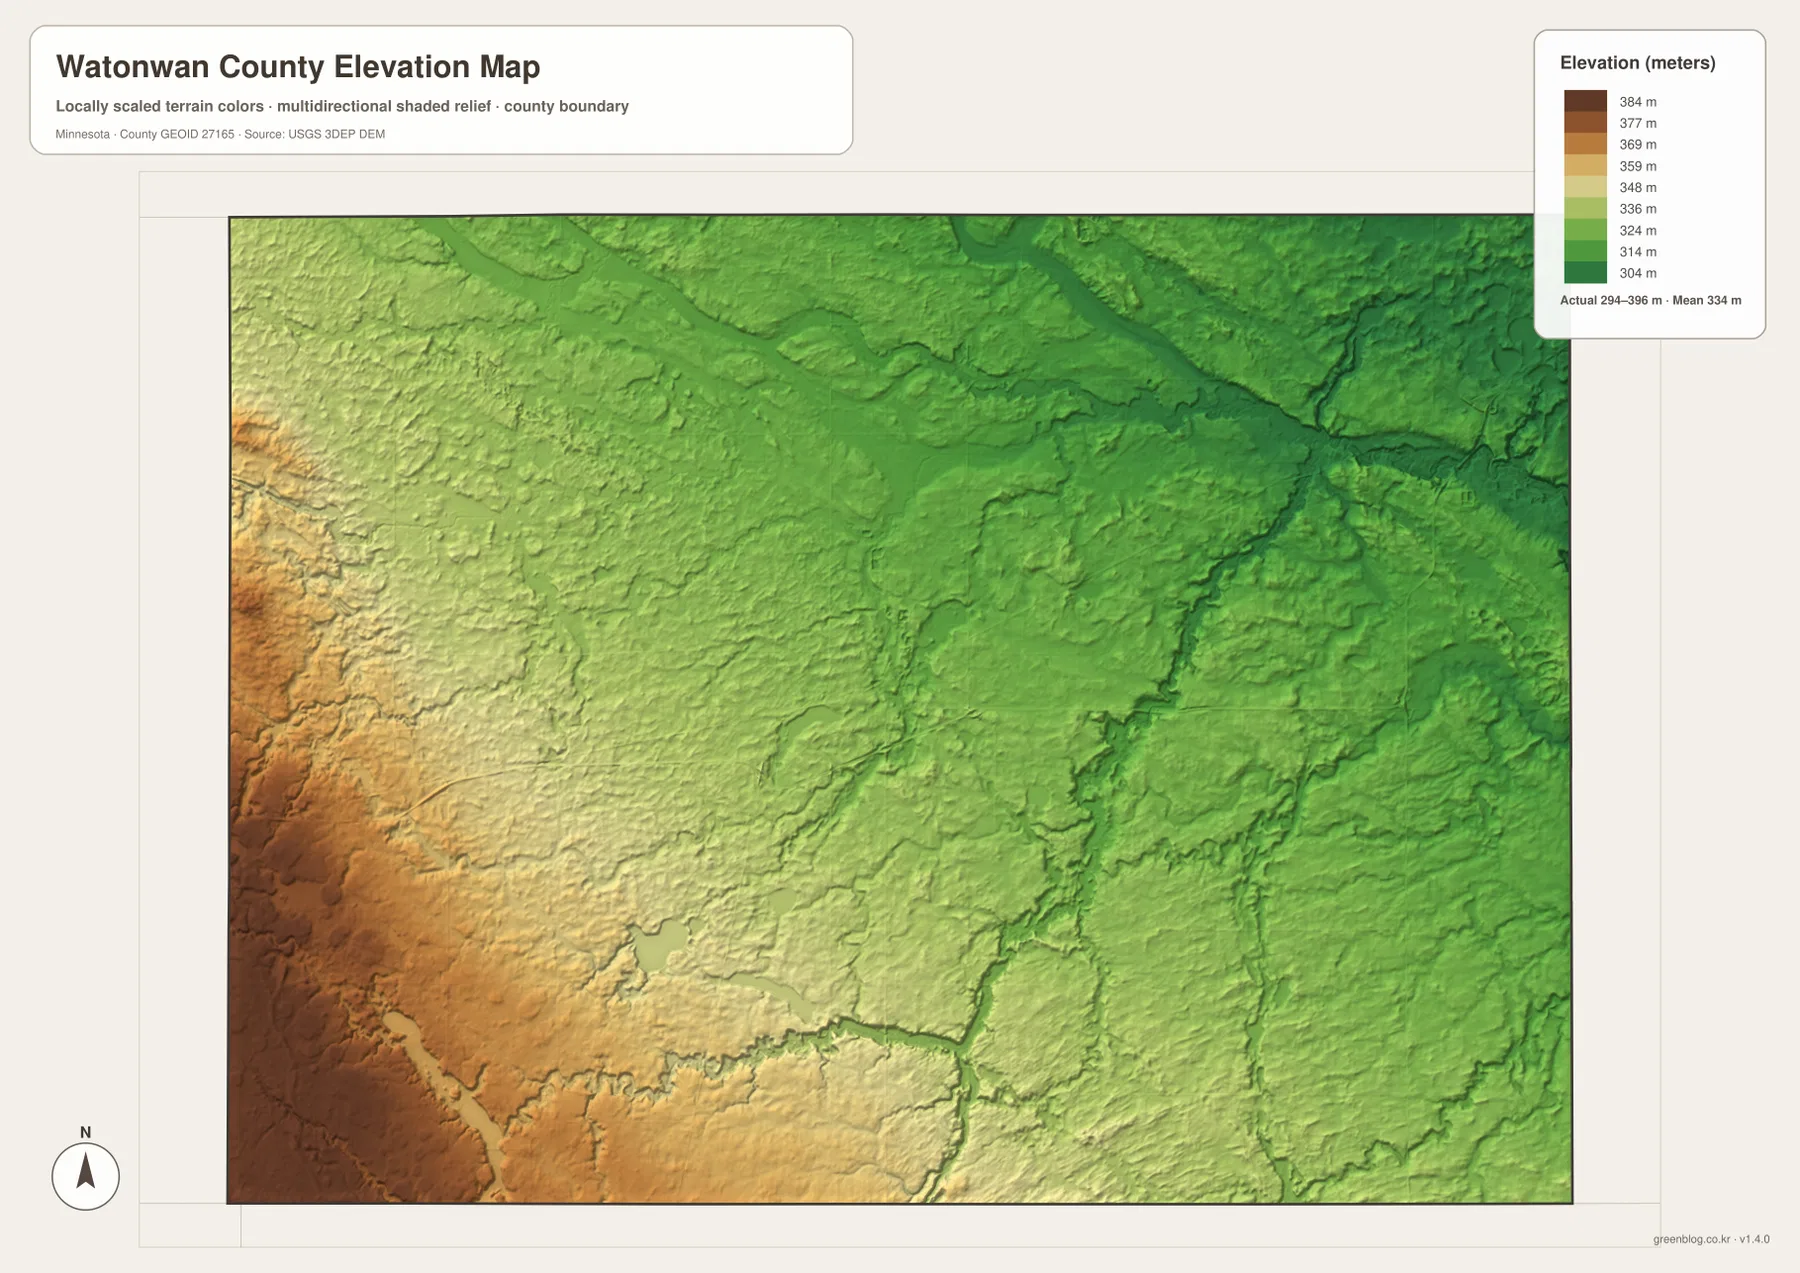
The elevation image is generalized for county-scale comparison. It should not be used to establish parcel elevations, engineering grades, drainage design, or construction measurements. Those tasks require source elevation data and, when appropriate, field surveying. For ordinary map reading, it is most useful for comparing the higher Butterfield side, the intermediate St. James area, and the lower terrain around the east-flowing Watonwan River near Madelia.
A practical sequence for connecting roads, towns, and the river system
A simple way to learn the county is to begin at St. James and follow MN 60 west toward Butterfield and east toward Madelia. Add MN 4 north of St. James and MN 15 near the east side, then place Lewisville, Odin, and Ormsby relative to those main routes. That sequence establishes the road framework without turning the map into a list of directions.
Next, trace North Fork Watonwan River across the northern half, then locate the main channel and the South Fork. Butterfield Creek and St James Creek show how water from the west and south feeds the larger river. Finally, compare the same places on the elevation image: western browns and oranges give way to greener central and eastern terrain. The road, water, and relief maps then reinforce one another instead of functioning as unrelated illustrations.
Choose the general map when road numbers, city names, and the county outline matter most. The city map is better for comparing the six highlighted communities, while the water map makes the three Watonwan River channels and named lakes easier to identify. The elevation map is the clearest choice for explaining the 294–396 meter relief and the drop toward the eastern river valleys. The ZIP below contains the high-resolution JPG originals used for these four views.
Frequently Asked Questions
How do the three Watonwan River channels fit together?
North Fork Watonwan River crosses the northern part of the county, the main Watonwan River runs through the central drainage, and South Fork Watonwan River approaches from the south. The channels join into the river system that continues east toward Madelia and then into Blue Earth County. The water and elevation maps together show how the branches occupy lower corridors.
Which two cities are largest on the city index?
St. James is listed at 4,767 and Madelia at 2,327, making them the two largest highlighted cities on this particular map. Butterfield is third at 535, followed by Lewisville, Ormsby, and Odin. These are map reference values; current official population figures should be checked through Census sources when needed.
Where is the highest and lowest terrain in Watonwan County?
The elevation legend gives a range of about 294 to 396 meters with a mean near 334 meters. Higher orange and brown terrain is concentrated in the west and southwest. Lower green terrain becomes more common toward the northeast and east, especially along the Watonwan River corridors as they approach Madelia and Blue Earth County.
Map File Information
The ZIP contains the high-resolution JPG originals of the Watonwan County general map, city map, water map, and elevation map shown on this page.
- Included Files: 4 high-resolution JPG maps
Related Maps
Sources and references
- Watonwan County — About Us — county history, St. James county seat, township and city overview
- Watonwan County — Maps & Permits — official county map resources
- Minnesota Department of Transportation — Watonwan County Highway Map — roads and community locations
- Minnesota Pollution Control Agency — Watonwan River — watershed and river-flow background
- USGS 3D Elevation Program — elevation and terrain reference data
Green Map creates custom-edited map images using open geographic data sources such as geoBoundaries, Natural Earth, OpenStreetMap, and government open data. These maps are edited visual materials, not raw data files, and are provided for education, documents, presentations, and graphic reference.