U.S. Energy Information Administration data for 2024 show how much petroleum liquids the electric power sector consumed specifically for electricity generation in each of the 50 states. Summing the state observations gives 20,194.6 thousand barrels, or about 20.2 million barrels. The measure is the EIA consumption-for-eg field in physical units. It should not be treated as a generic total-consumption series, a heat-content measure, or electricity generation itself.
The distribution is exceptionally concentrated. Hawaii used 11,633.1 thousand barrels, equal to 57.6% of the 50-state total. Adding Alaska raises the combined share to 65.6%. The median state used only 97.5 thousand barrels, while the arithmetic mean was 403.9 thousand barrels. That large gap between mean and median is a direct consequence of the very large Hawaii and Alaska observations.
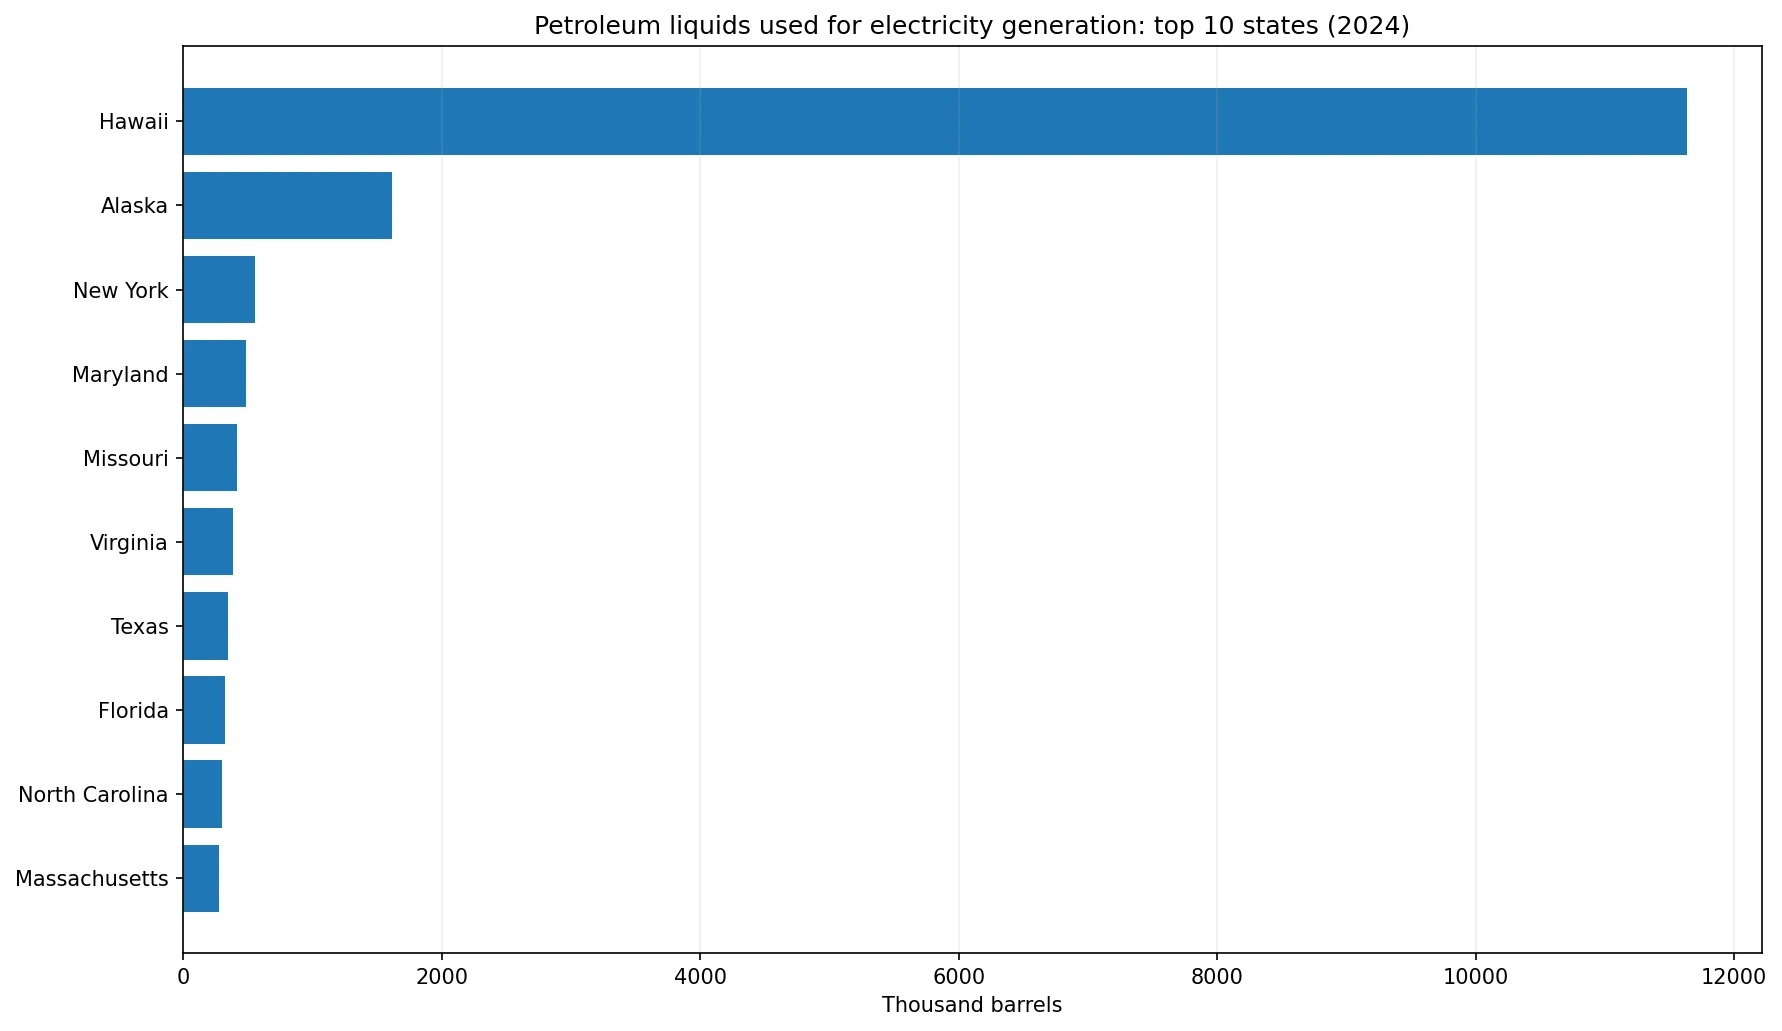
Table of Contents
This series measures fuel used for electricity generation
The EIA operational data contain several related petroleum measures. This observation uses fueltypeid PEL for petroleum liquids, sectorid 98 for Electric Power, and the consumption-for-eg field. In practical terms, it records the physical quantity of petroleum liquids consumed for generating electricity in the electric power sector. Similar-looking series can cover total fuel consumption, useful thermal output, stocks or heat content, so the field and sector matter.
The unit is thousand barrels, which is a physical volume. It does not directly measure energy content or electricity output. Two states can consume the same number of barrels yet generate different amounts of electricity if the petroleum products and generating efficiencies differ. The series is therefore strongest for comparing fuel-input volume, not efficiency or final electricity production.
Hawaii alone accounts for 57.6% of the 50-state total
Hawaii records 11.633 million barrels, the largest state value by a wide margin and 57.61% of the total. Alaska is second at 1.616 million barrels, or 8.00%. Together they account for 65.61% of all petroleum liquids in the 50-state sum used for electricity generation.
The concentration is a factual feature of the state data, but the series alone does not establish why Hawaii and Alaska are so different. Grid isolation, generation fleets, fuel logistics and other system characteristics may be relevant, but causal explanations require separate evidence. What the 2024 observations clearly show is that these two states sit far above the rest of the distribution.
There is a steep drop after Hawaii and Alaska
New York ranks third at 554.38 thousand barrels, followed by Maryland at 483.19 thousand, Missouri at 415.97 thousand, Virginia at 382.68 thousand and Texas at 342.05 thousand. Florida records 322.79 thousand, North Carolina 301.84 thousand and Massachusetts 274.93 thousand. The third-ranked value is below 600 thousand barrels, illustrating how sharply the distribution falls after the top two.
The top five states account for 72.8% of the total, while the top ten account for 80.8%. More than four fifths of the observed fuel volume is therefore concentrated in only one fifth of the states. That makes concentration measures more informative than a simple average for describing the national state-level pattern.
| State | Year | Thousand barrels | Share of 50-state total |
|---|---|---|---|
| Hawaii | 2024 | 11,633.148 | 57.61% |
| Alaska | 2024 | 1,615.890 | 8.00% |
| New York | 2024 | 554.377 | 2.75% |
| Maryland | 2024 | 483.186 | 2.39% |
| Missouri | 2024 | 415.971 | 2.06% |
| Virginia | 2024 | 382.679 | 1.89% |
| Texas | 2024 | 342.046 | 1.69% |
| Florida | 2024 | 322.791 | 1.60% |
| North Carolina | 2024 | 301.835 | 1.49% |
| Massachusetts | 2024 | 274.930 | 1.36% |
Many states use comparatively small physical volumes
The median state value is 97.52 thousand barrels. 13 states are below 50 thousand barrels, while 24 are at or above 100 thousand. The middle half of states lies between 49.78 and 236.93 thousand barrels. This compact central range contrasts sharply with the high-end outliers.
Idaho has the smallest reported value at 0.083 thousand barrels, followed by New Mexico at 2.011 thousand and Mississippi at 9.613 thousand. Rhode Island records 10.001 thousand, Vermont 11.542 thousand and Nevada 12.557 thousand. These small physical quantities indicate limited use of petroleum liquids for electricity generation in those state electric-power sectors, not low electricity generation overall.
| State | Year | Thousand barrels | Share of 50-state total |
|---|---|---|---|
| Idaho | 2024 | 0.083 | 0.00% |
| New Mexico | 2024 | 2.011 | 0.01% |
| Mississippi | 2024 | 9.613 | 0.05% |
| Rhode Island | 2024 | 10.001 | 0.05% |
| Vermont | 2024 | 11.542 | 0.06% |
| Nevada | 2024 | 12.557 | 0.06% |
| Louisiana | 2024 | 18.090 | 0.09% |
| Alabama | 2024 | 19.213 | 0.10% |
The mean of 403.9 thousand barrels is not a typical-state value
The arithmetic mean is 403.9 thousand barrels, more than four times the median of 97.5 thousand. Hawaii alone exceeds the mean by nearly thirty times. When a distribution is this skewed, the mean is mathematically valid but can give a misleading impression of what most states look like.
A more faithful summary combines the median with concentration statistics. In this case, a median near 97.5 thousand barrels, Hawaii’s 57.6% share and the top ten’s 80.8% share provide a much clearer picture than the average alone. Most states occupy a modest range while a small number account for most of the volume.
Total consumption, heat content and generation are different measures
EIA petroleum series often have similar names but answer different questions. Total consumption can cover a broader set of uses, heat-content measures translate fuel into energy units such as Btu, and net generation measures electricity produced. The current series is narrower: physical petroleum-liquid volume consumed specifically for electricity generation in the Electric Power sector.
Differences between related EIA articles are therefore not necessarily inconsistencies. A thousand-barrel series and a heat-content series can rank states differently if petroleum product mixes differ. Likewise, a total-consumption series can exceed a generation-only series because its scope is broader. The measurement identity must be preserved when comparing values.
The 50-state sum is about 20.2 million barrels
Adding the 50 published state observations produces 20,194.553 thousand barrels, equivalent to approximately 20.195 million barrels. This is a calculated 50-state sum, not an attempt to replace any separately published national total that may include other jurisdictions or accounting scope.
The sum is useful because it lets each state be expressed as a share of the same observed universe. Hawaii contributes 57.61%, Alaska 8.00%, and most other states contribute low single-digit percentages or less. These shares describe concentration of physical fuel volume, not dependence on petroleum within each state’s electricity mix.
Fuel dependence requires a different denominator
A state can have a high absolute petroleum volume while petroleum still represents a small share of its total generation. Conversely, a state with a small electricity system can rely substantially on petroleum even with fewer barrels. Absolute volume and fuel dependence therefore answer different questions.
To measure dependence, petroleum generation could be divided by total state generation, or petroleum heat input could be compared with total fuel heat input. This article does not estimate either ratio. It stays with the directly reported physical consumption series and the state-level distribution that can be calculated from it.
What the 2024 pattern shows most clearly
The clearest result is concentration: Hawaii accounts for 57.6%, Hawaii plus Alaska for 65.6%, and the top ten states for 80.8% of the 50-state total. At the same time, the median is only 97.5 thousand barrels. Petroleum-liquid consumption for electricity generation was therefore far from evenly distributed across states in 2024.
Three interpretation rules keep the comparison precise. The unit is physical volume in thousand barrels. The scope is petroleum liquids consumed for electricity generation in the Electric Power sector. And absolute fuel consumption should not be confused with petroleum’s share of generation. Keeping those distinctions visible avoids mixing nearby EIA series that measure different things.
Source and interpretation limits
The source is the U.S. Energy Information Administration Electricity API v2, electric-power-operational-data, for annual 2024 observations. The fuel facet is petroleum liquids (PEL), the sector is Electric Power, the field is consumption-for-eg and the unit is thousand barrels. All 50 states are represented with a reported value.
A useful next step would link the physical-consumption series with state net generation, fuel heat content and generation by energy source. That would separate the question of where petroleum volumes are largest from the question of where electricity systems are most dependent on petroleum.
Frequently Asked Questions
Is this total petroleum-liquids consumption?
No. It is EIA's consumption-for-eg field: the physical quantity of petroleum liquids used for electricity generation in the Electric Power sector.
What does Hawaii’s 57.6% share represent?
It is Hawaii's share of the sum of the 50 reported state values for this specific 2024 generation-use series.
Does a high consumption volume mean high petroleum dependence?
Not necessarily. Dependence requires a denominator such as total state generation or total fuel heat input.
Related Articles
Green Map creates custom-edited map images using open geographic data sources such as geoBoundaries, Natural Earth, OpenStreetMap, and government open data. These maps are edited visual materials, not raw data files, and are provided for education, documents, presentations, and graphic reference.