In 2024, Hawaii recorded the largest state value for petroleum liquids used for electricity generation in the U.S. Electric Power Sector Non-CHP. Hawaii reported 9,821.636 thousand barrels, compared with 1,615.890 in Alaska and 552.311 in New York. The simple sum of the 50 state observations is 18,318.153 thousand barrels, so Hawaii alone represents 53.62% of that 50-state total. The comparison fixes the EIA dimensions at fueltypeid PEL, sectorid 90, data field consumption-for-eg, annual frequency, and year 2024.
That scope is narrower than the phrase “petroleum use in the power sector” may imply. The series is not all petroleum consumed in a state, not all petroleum used by every electricity producer, and not electricity output. It is a physical-volume measure of petroleum liquids assigned to electricity generation within the Electric Power Sector Non-CHP category. EIA reports the physical unit here as thousand barrels. A high value therefore does not by itself show a high petroleum share of generation, poor efficiency, high cost, or high emissions; each of those questions needs additional denominators or companion variables.
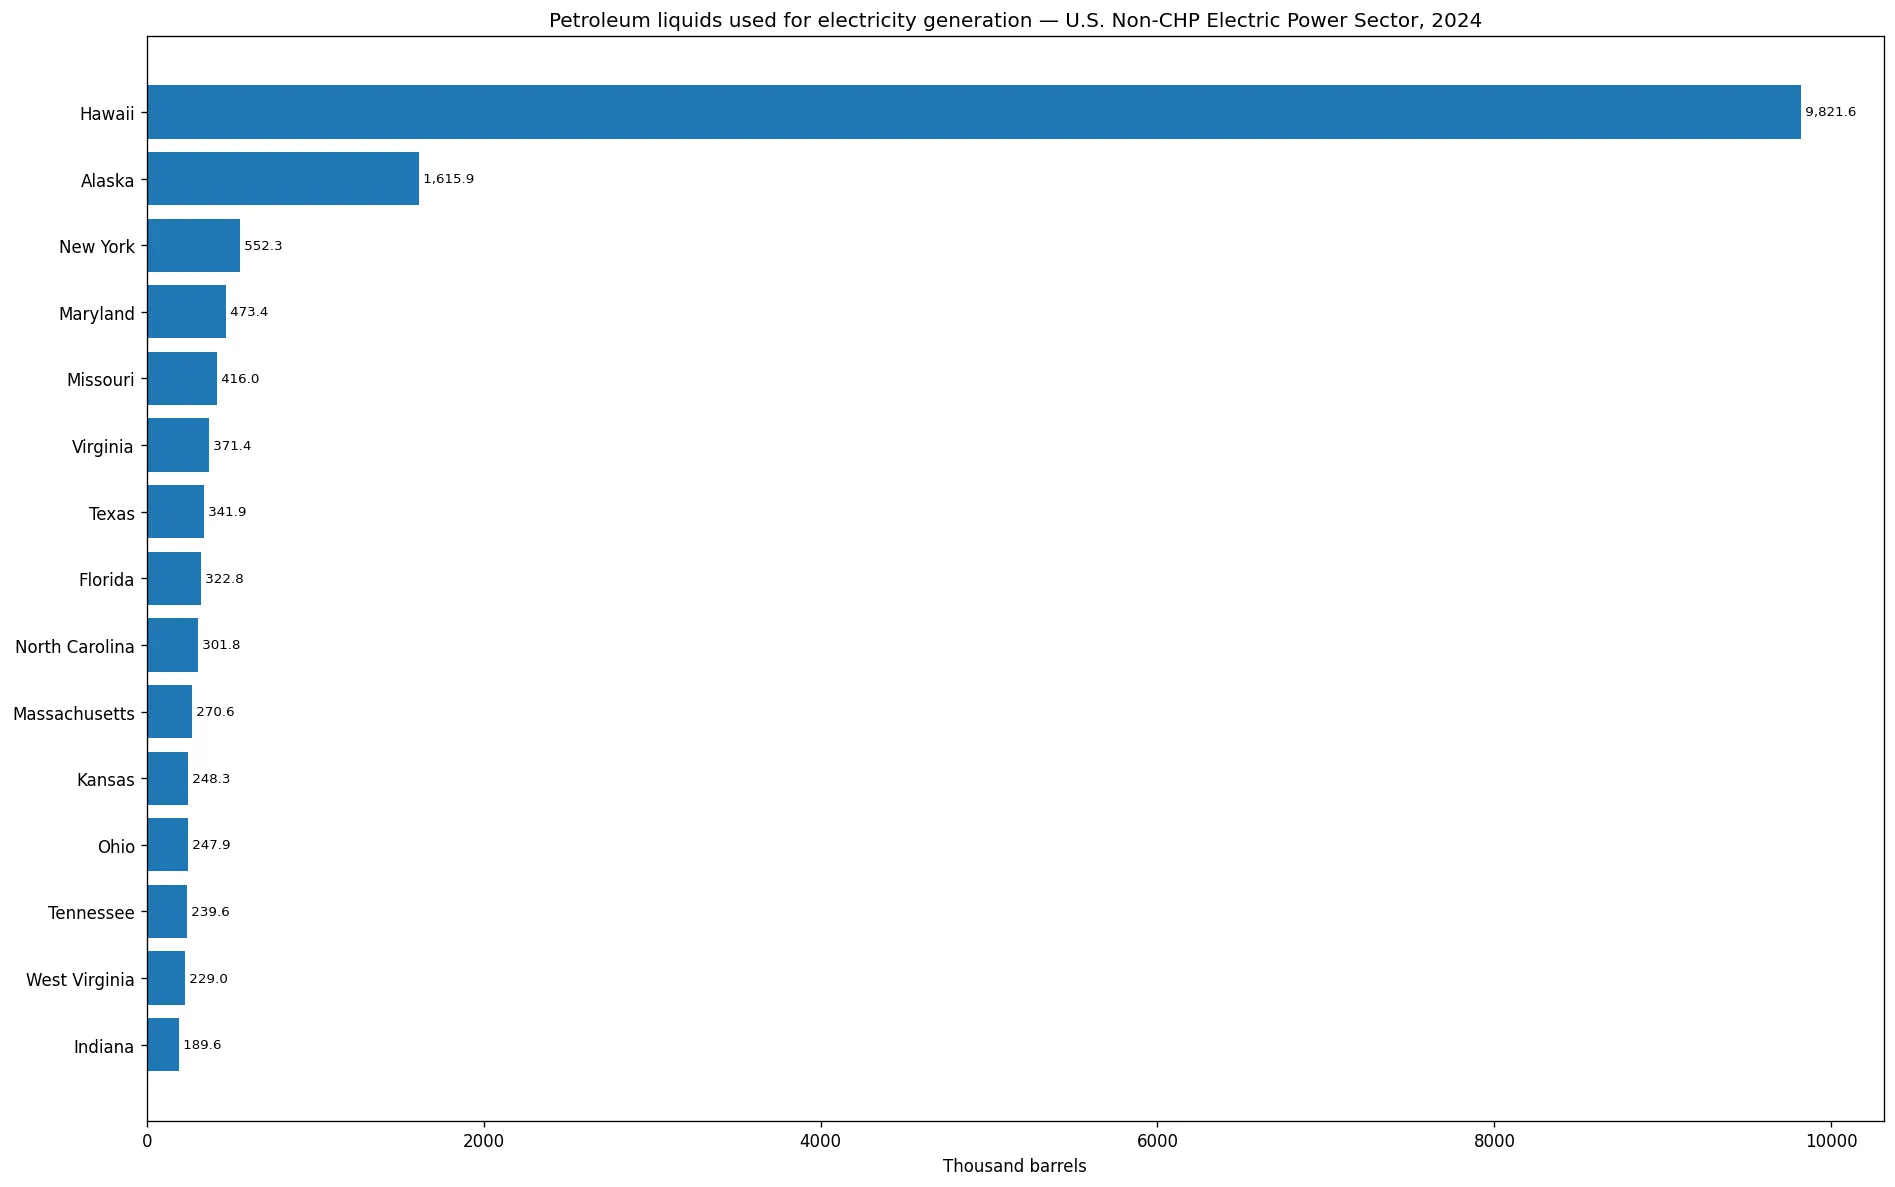
Table of Contents
Hawaii alone represented 53.6% of the 50-state sum
Hawaii’s 9,821.636 thousand barrels equal 53.62% of the 50-state sum. Alaska contributes 8.82%, and the first three states together reach 65.45%. The gap is unusually large: Hawaii is about 6.1 times Alaska and roughly 100.7 times the median state observation. That single extreme value has a major effect on any summary based on the arithmetic mean.
The top five states account for 70.31% and the top ten for 79.09% of the observed sum. The remaining 40 states therefore contribute only 20.91%. This concentration is also visible in the difference between the mean and median: the mean is 366.363 thousand barrels while the median is just 97.522. The mean is almost 3.8 times the median, so it should not be treated as a typical state value.
| State | Code | Petroleum liquids for electricity generation (thousand barrels) | Share of 50-state sum |
|---|---|---|---|
| Hawaii | HI | 9,821.636 | 53.62% |
| Alaska | AK | 1,615.890 | 8.82% |
| New York | NY | 552.311 | 3.02% |
| Maryland | MD | 473.360 | 2.58% |
| Missouri | MO | 415.971 | 2.27% |
| Virginia | VA | 371.436 | 2.03% |
| Texas | TX | 341.877 | 1.87% |
| Florida | FL | 322.791 | 1.76% |
| North Carolina | NC | 301.835 | 1.65% |
| Massachusetts | MA | 270.638 | 1.48% |
The upper ranks extend beyond Hawaii and Alaska
Hawaii and Alaska dominate the first two positions, but the rest of the upper group is geographically mixed. New York, Maryland, Missouri, Virginia, Texas, Florida, North Carolina and Massachusetts all appear in the top ten. That mix is a reason to avoid a one-factor explanation for the ranking. The dataset directly establishes where the physical fuel input was larger under this exact definition; it does not isolate the roles of plant fleets, fuel delivery constraints, grid conditions, peak operation, weather, reserve use, or other operating circumstances.
The fuel label also matters. “Petroleum liquids” is a broader EIA fuel grouping than a single product such as distillate fuel oil. A nearby EIA series can have a similar title while using DFO instead of PEL, total consumption instead of consumption-for-eg, a different sector code, or useful thermal output rather than generation fuel input. Those distinctions can produce very different state values. For reliable comparisons, fueltypeid, sectorid, measure, period, and unit should be checked together rather than inferred from a shortened headline.
The median of 97.5 thousand barrels describes the center better than the mean
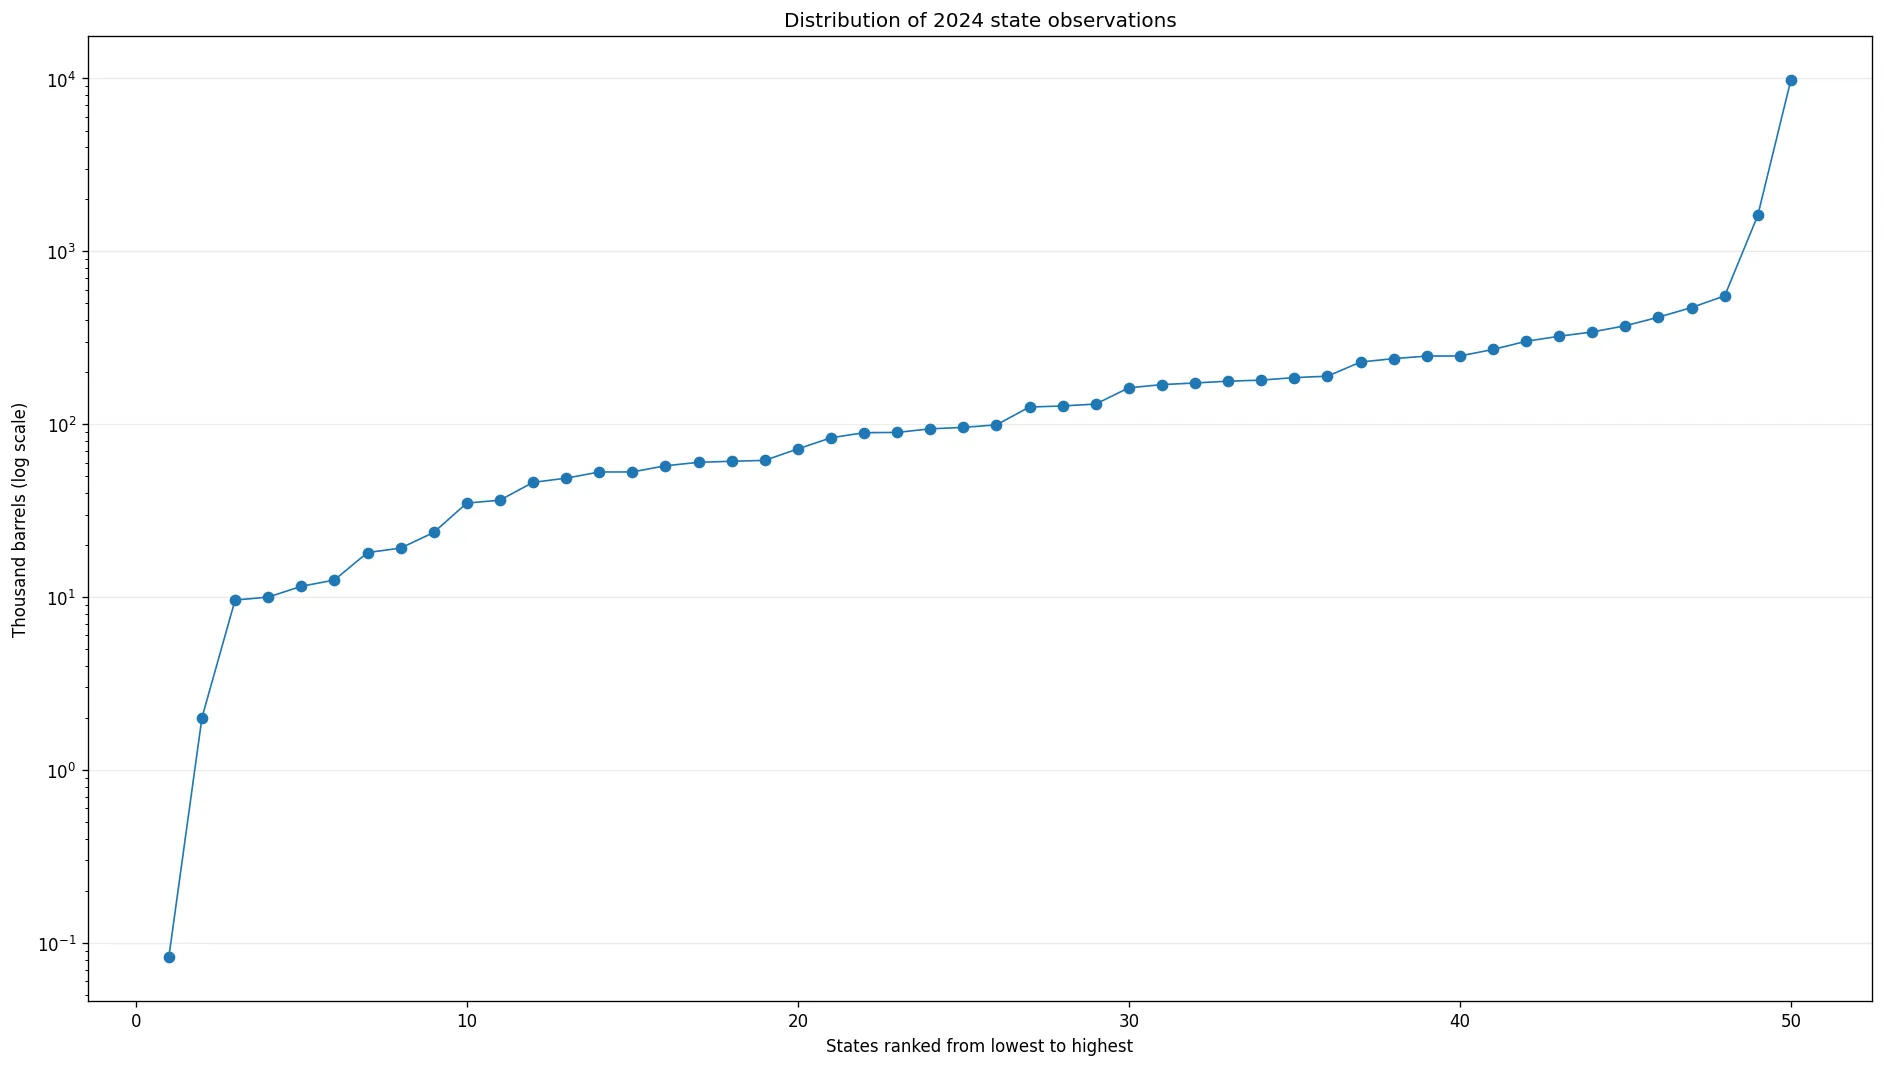
Across the 50 states, the first quartile is 49.783 thousand barrels, the median is 97.522, and the third quartile is 236.931. Half of the observations therefore lie roughly between 49.8 and 236.9 thousand barrels. Hawaii’s value above 9,800 thousand barrels sits far outside that central band and pulls the mean up to 366.363. For a strongly right-skewed distribution like this one, the median is more informative when the question is where a typical state sits in the ranking.
The second chart uses a logarithmic vertical scale so that both very small observations and the Hawaii outlier remain visible. On a linear scale, the largest value would compress much of the rest of the distribution near the baseline. A log scale does not change the ordering or the underlying data, but visual distance no longer represents an equal absolute difference. The table and numeric summaries should therefore remain the reference for exact comparisons.
All 50 states have positive observations
The supplied series contains all 50 states, with no missing values and no exact zeros. Idaho is the minimum at 0.083 thousand barrels, followed by New Mexico at 2.011, Mississippi at 9.613, Rhode Island at 10.001, and Vermont at 11.542. These very small values are still positive observations; the lower tail was not created by replacing missing records with zero.
The top 20 states account for 90.23% of the 50-state sum, leaving only 9.77% for the other 30 states. This means the distribution is highly concentrated even though the measure appears in every state. A precise description is therefore not “only a few states use petroleum liquids,” but rather that positive consumption is widespread while the physical volume is concentrated heavily in a relatively small upper group.
Physical fuel volume is not a generation-share or efficiency measure
Thousand barrels describe the physical quantity of liquid fuel, not the electricity produced from it. To calculate petroleum’s share of a state’s electricity mix, an analyst would need compatible generation data or another appropriate denominator. To compare conversion efficiency, fuel-energy input and electricity output must be aligned by sector, period and technology. Cost analysis requires prices and possibly transportation information; emissions analysis requires fuel-specific emissions factors and matching combustion quantities. None of those conclusions can be obtained from the physical-volume series alone.
The 53.62% figure for Hawaii should therefore be read narrowly: it is Hawaii’s share of the simple sum of these 50 observations under this exact EIA series definition. It is not Hawaii’s share of all U.S. petroleum consumption, and it is not the percentage of Hawaii electricity generated from petroleum. Changing the measure from consumption-for-eg to total consumption or useful thermal output changes the analytical question and can change the state ranking.
Annual totals hide timing and operating patterns
A 2024 annual total is useful for a state-to-state snapshot, but it does not show when the fuel was used. Two states with the same annual volume could have very different operating patterns: one may use petroleum liquids regularly, while another may record most of its annual total during a small number of high-demand or constrained periods. Monthly data would be needed to study seasonality, and plant-level observations would be needed to identify which facilities account for the state totals.
For the same reason, the ranking should not be turned into a causal story from this dataset alone. Fuel logistics, generation fleets, transmission constraints, market design, reserve requirements and weather could all be relevant in different places, but the state annual series does not separate their effects. Its strongest use is descriptive: it shows the physical scale and concentration of petroleum-liquid input for electricity generation within a consistent EIA sector and year.
How to identify the EIA series correctly
The source is U.S. Energy Information Administration Open Data, using the Electric Power Operational Data collection. To reproduce this comparison, keep four key settings aligned: annual 2024 data, the field consumption-for-eg, fueltypeid PEL, and sectorid 90. The reported physical unit is thousand barrels. A result with petroleum in the title but a different fuel code, sector code or measure should be treated as a different series.
EIA electricity datasets often provide both physical quantities and energy-content measures. Those fields are not interchangeable. A thousand-barrel series should not be directly combined with a Btu series without a justified conversion, and average heat content should not be read as a consumption quantity. Matching the unit to the analytical question prevents many false comparisons among otherwise similar-looking petroleum and electricity tables.
What the 2024 state comparison establishes
The 2024 pattern can be summarized in a few well-supported facts. Hawaii leads at 9,821.636 thousand barrels and 53.62% of the 50-state sum; Alaska is second at 8.82%. The top ten states together account for 79.09%. The median is only 97.522 thousand barrels compared with a mean of 366.363, showing how strongly the largest value stretches the distribution. The minimum is a positive 0.083 thousand barrels in Idaho.
Taken together, those observations show a series that is broad in coverage but highly uneven in magnitude. Positive values appear in every state, yet a small number of states account for most of the physical volume. The proper next step depends on the question: generation-share analysis needs output data, efficiency analysis needs energy input and output, cost analysis needs prices, and causal explanations need operational evidence. Keeping those boundaries explicit makes the state comparison useful without asking the data to answer questions it was not designed to answer.
Frequently Asked Questions
Which state used the most petroleum liquids for electricity generation in the non-CHP electric power sector in 2024?
Hawaii ranked first at 9,821.636 thousand barrels, or 53.62% of the simple sum across the 50 states.
Does this series represent all petroleum consumption in each state?
No. It is limited to EIA petroleum liquids (PEL), Electric Power Sector Non-CHP (sector 90), and the consumption-for-eg measure for electricity generation.
Why is the median more useful than the mean here?
Hawaii is an extreme high value, which lifts the mean to 366.363 thousand barrels while the median is only 97.522. The median better describes the center of this skewed state distribution.
What is the unit?
The EIA physical unit for this series is thousand barrels.
Related Articles
Green Map creates custom-edited map images using open geographic data sources such as geoBoundaries, Natural Earth, OpenStreetMap, and government open data. These maps are edited visual materials, not raw data files, and are provided for education, documents, presentations, and graphic reference.