Fuel energy used for electricity generation by U.S. independent power producers operating non-CHP plants was highly uneven across states in 2025. Using the U.S. Energy Information Administration’s annual `consumption-for-eg-btu` field with fueltypeid=ALL and sectorid=2, the 51 observations for the 50 states and District of Columbia sum to 12,915.37 million MMBtu. Texas is the largest observation at 2,643.43 million MMBtu, equal to 20.47% of that 51-row sum. Pennsylvania and Illinois follow, and the top three together account for 48.59%.
The sector boundary is essential. Sectorid=2 is EIA’s IPP Non-CHP category, so these figures do not represent all fuel consumed by the entire U.S. electric power sector. The field is also an input measure: `consumption-for-eg-btu` reports fuel energy used for electricity generation in thermal units. It is not net generation in megawatthours, generating capacity in megawatts, electricity sales, retail demand, or total statewide energy consumption. The ranking therefore answers a narrower question about the scale of fuel input inside one producer and plant category.
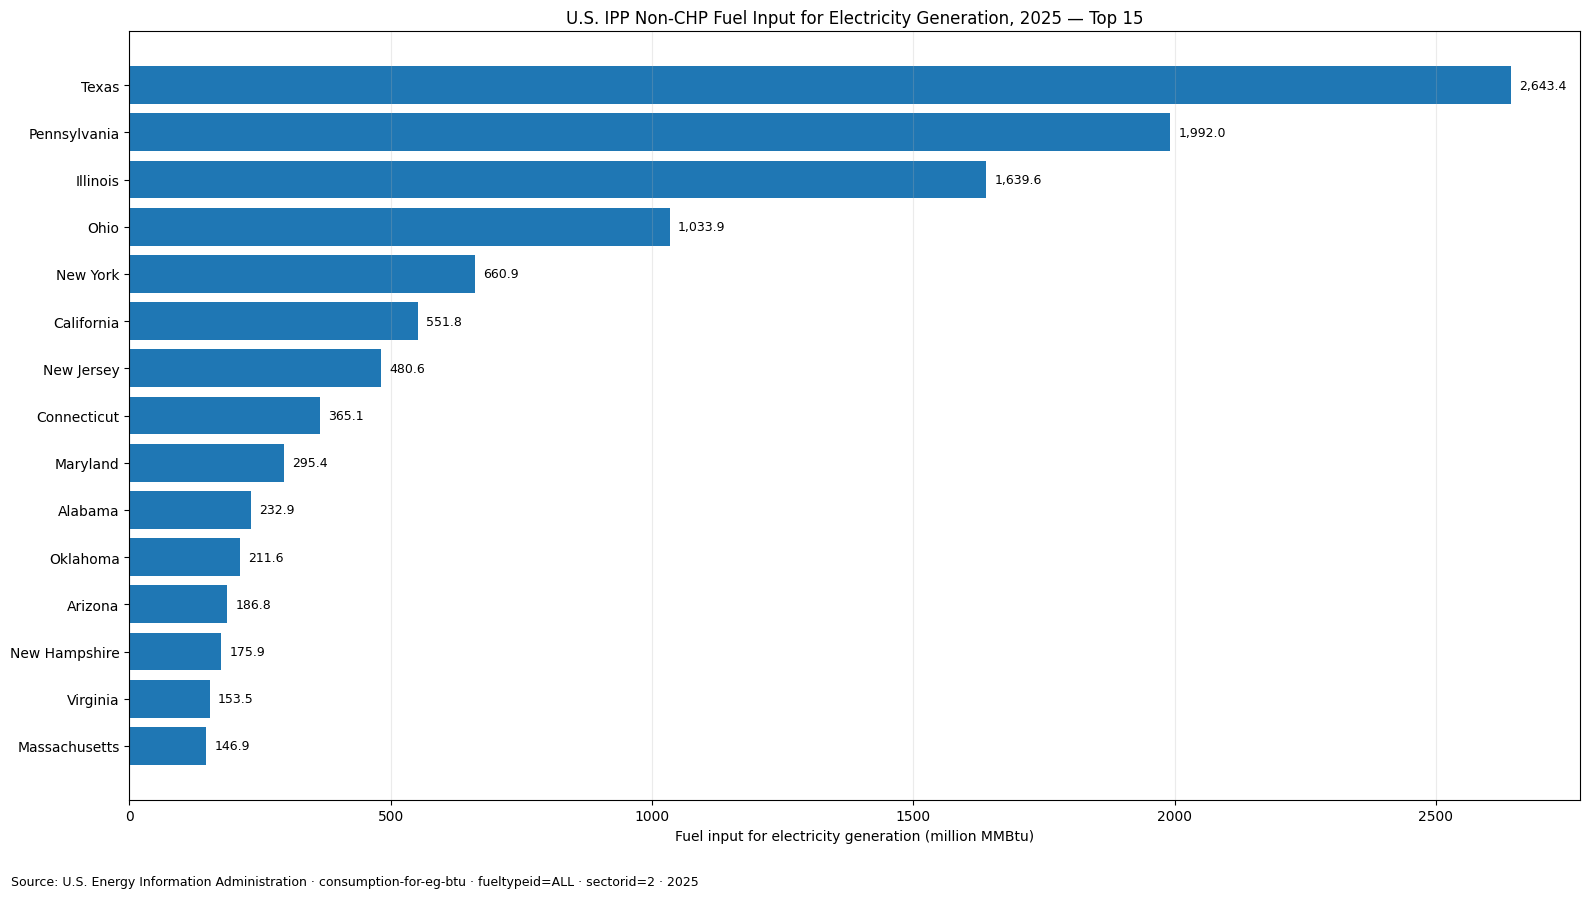
Table of Contents
Texas, Pennsylvania, and Illinois dominate the upper end
Texas records 2,643.43 million MMBtu, Pennsylvania 1,992.00, and Illinois 1,639.64. Ohio is fourth at 1,033.94. New York follows at 660.95 and California at 551.76. These are the only six observations above 500 million MMBtu. The separation between these states and the broad middle of the distribution is large enough that a simple average does not describe a typical jurisdiction very well.
Cumulative shares show the concentration directly. Texas alone represents 20.47% of the analytical 51-row sum. The top three reach 48.59%, the top five 61.71%, the top ten 76.62%, and the top fifteen 83.39%. This pattern does not mean that the rest of the country lacks IPP Non-CHP activity, but it shows that absolute fuel input in this category is concentrated in a relatively small number of state markets.
| Rank | State or jurisdiction | 2025 value (million MMBtu) |
|---|---|---|
| 1 | Texas | 2,643.43 |
| 2 | Pennsylvania | 1,992.00 |
| 3 | Illinois | 1,639.64 |
| 4 | Ohio | 1,033.94 |
| 5 | New York | 660.95 |
| 6 | California | 551.76 |
| 7 | New Jersey | 480.55 |
| 8 | Connecticut | 365.09 |
| 9 | Maryland | 295.42 |
| 10 | Alabama | 232.89 |
| 11 | Oklahoma | 211.58 |
| 12 | Arizona | 186.84 |
| 13 | New Hampshire | 175.91 |
| 14 | Virginia | 153.46 |
| 15 | Massachusetts | 146.94 |
The median is far below the mean
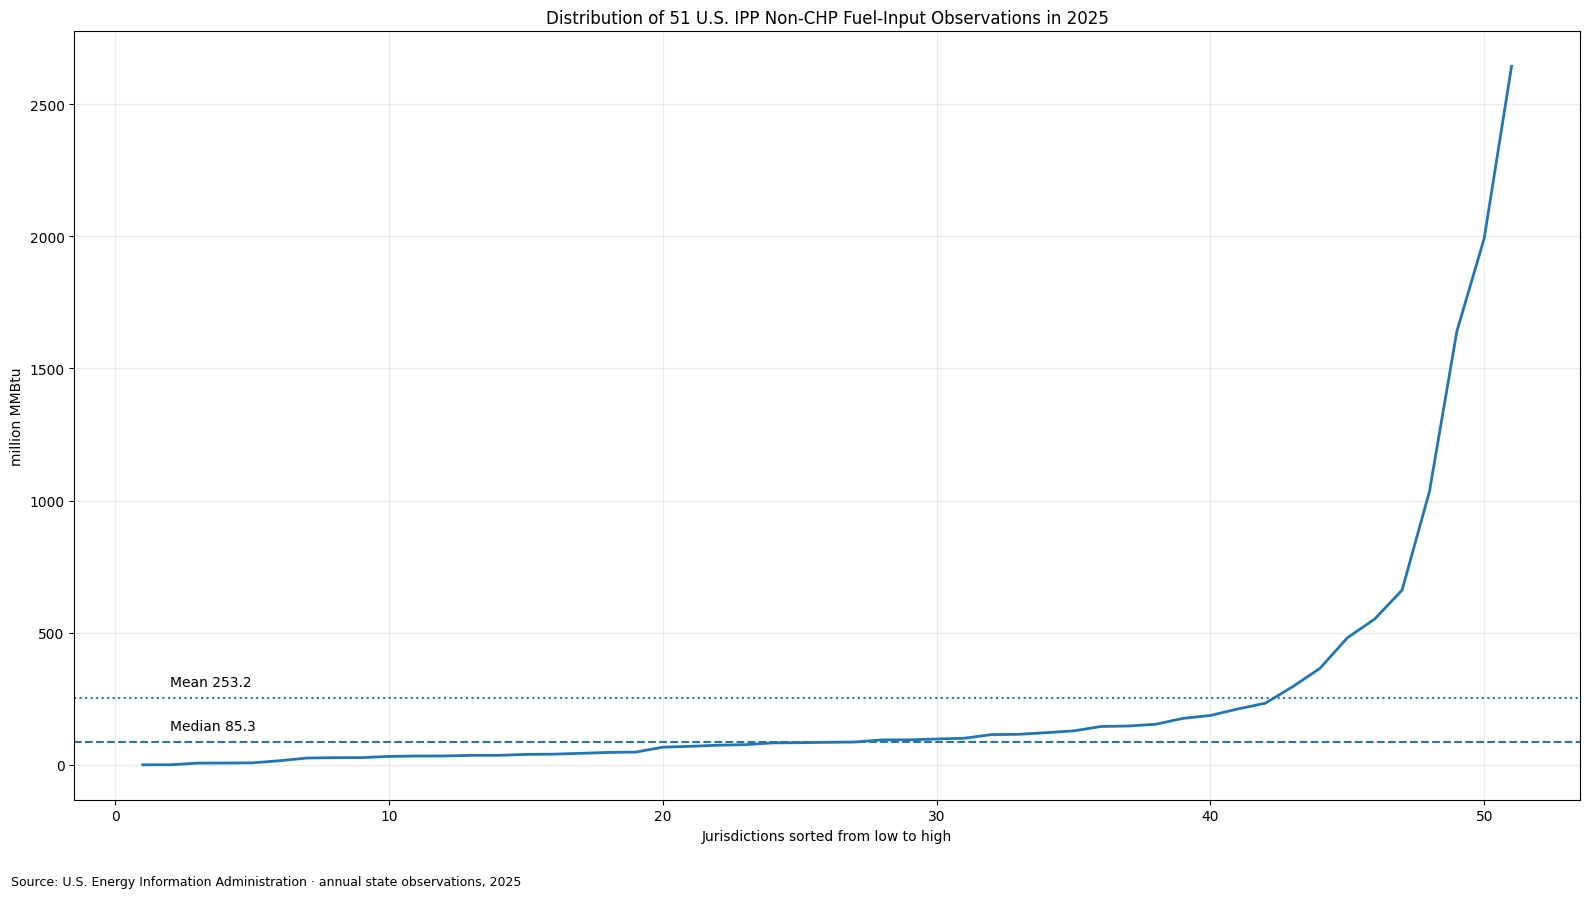
The unweighted mean across the 51 observations is 253.24 million MMBtu, while the median is only 85.34. The first quartile is 35.94 and the third quartile is 164.69, so the middle half of the distribution lies roughly between those two values. The large gap between mean and median is a textbook sign of an upper-skewed distribution: a small group of large state observations lifts the arithmetic average well above the midpoint.
There are 6 jurisdictions at or above 500 million MMBtu, 9 at or above 250, and 21 at or above 100. At the low end, 5 observations are below 10 million MMBtu and 2 are below 1. For readers looking for a typical state-scale benchmark, the median and quartiles are more informative than the mean alone. For readers interested in market concentration, the cumulative top shares are more useful.
Very small values are still reported observations
The District of Columbia is the smallest observation at 0.17 million MMBtu, followed by Alaska at 0.22. Vermont reports 6.52, Hawaii 6.81, and Tennessee 7.56. All 51 rows contain numeric values. None of these small observations was created by filling a missing record with zero. A small positive value, an actual zero, and a missing observation are different data states and should not be treated as interchangeable.
| Low-end position | State or jurisdiction | 2025 value (million MMBtu) |
|---|---|---|
| 1 | District of Columbia | 0.17 |
| 2 | Alaska | 0.22 |
| 3 | Vermont | 6.52 |
| 4 | Hawaii | 6.81 |
| 5 | Tennessee | 7.56 |
| 6 | Kentucky | 15.56 |
| 7 | Utah | 25.83 |
| 8 | South Carolina | 27.05 |
| 9 | Idaho | 27.31 |
| 10 | Wyoming | 31.91 |
A low position in this ranking is not an efficiency score and does not imply low statewide electricity use. A state may rely more heavily on utility-owned generation, CHP facilities, power imported from other states, or other sector classifications that sit outside sectorid=2. Comparing efficiency would require a denominator such as net generation, while comparing statewide demand would require load or sales data. This series supplies neither denominator.
IPP Non-CHP is a distinct sector identity
EIA’s electric-power operational dataset contains multiple sector categories, and changing sectorid can materially change both the level and ranking of state values. This article fixes sectorid=2, IPP Non-CHP. A separate article using sectorid=99 All Sectors or sectorid=90 Electric Power Sector Non-CHP may have a similar headline topic but represents a different slice of the industry. The producer and plant boundary is therefore part of the metric identity, not a minor descriptive detail.
The field name matters as well. `consumption-for-eg-btu` is fuel input for electricity generation. `total-consumption-btu` can cover a broader consumption concept that includes useful thermal output under the applicable EIA definition. Two series can share the same million-MMBtu unit and still answer different questions. Reliable comparison requires field, fueltypeid, sectorid, geography, frequency, and year to remain visible.
Fuel input is not net electricity generation
IPP Non-CHP net generation is an output measure generally expressed in megawatthours. Fuel input is an energy-input measure expressed here in million MMBtu. The two are related, but they are not interchangeable because plant technology, heat rates, fuel mix, utilization, and operating conditions affect how much input energy is needed for a given amount of electricity output. A state can rank high in fuel input without occupying exactly the same position in net generation.
That distinction also prevents misleading efficiency conclusions. Dividing fuel input by net generation could produce an aggregate input-per-output ratio, but that would be a new derived metric requiring careful matching of sector, year, and coverage. The current dataset does not itself supply that ratio. It is best used first as a direct measure of the scale of all-fuels energy input in IPP Non-CHP generation.
All fuels gives scale, not fuel mix
Fueltypeid=ALL aggregates fuel categories. This is useful for showing the overall size of fuel-energy input under sectorid=2, but it does not reveal whether a state relies on natural gas, coal, petroleum, renewable fuels, or another category. Texas and Pennsylvania can both have large totals while having very different underlying generation portfolios. A fuel-mix analysis would need fuel-specific slices with the same sector and year held constant.
The aggregate should also not be combined mechanically with overlapping fuel categories. ALL is the broad total for the selected field and sector, while individual fueltypeid series are components or related views. Adding the ALL series to its components would double count. The safer approach is to use ALL for scale and the detailed fuel facets for composition.
A one-year cross-section cannot establish a trend
Every observation in the supplied series is for 2025, which makes the state comparison temporally consistent. However, a one-year slice cannot show whether IPP Non-CHP fuel input is rising or falling in any state. Statements about growth, decline, structural shifts, or increasing concentration require multiple years from the same EIA field with the same fuel and sector facets.
The 12,915.37 million MMBtu total used for the share calculations is a simple sum of the 51 state and District of Columbia observations. It is analytically consistent for comparing state shares, but it should not automatically be substituted for a separately published national EIA aggregate. National totals can differ because of aggregation rules, reporting coverage, revisions, or rounding conventions.
What the 2025 distribution shows most clearly
The clearest feature is concentration at the top of a highly skewed state distribution. Texas alone contributes 20.47% of the 51-row sum, the top three contribute 48.59%, and the top ten 76.62%. At the same time, the median is only 85.34 million MMBtu. That combination tells us that a handful of states account for a large portion of IPP Non-CHP fuel input while many jurisdictions sit far below the leading tier.
The ranking should remain descriptive. It does not grade environmental performance, operational efficiency, reliability, or policy quality. Absolute fuel input is affected by the size and operation of the IPP Non-CHP fleet and by factors outside this one table. A deeper assessment would connect this base series to generation, capacity, fuel-specific consumption, emissions, and power-market structure while preserving the same sector boundary.
Source and calculation method
The source is the U.S. Energy Information Administration electricity/electric-power-operational-data API. The slice uses annual frequency, year 2025, field `consumption-for-eg-btu`, fueltypeid=ALL, and sectorid=2 for IPP Non-CHP. The geography is the 50 states plus the District of Columbia and the unit is million MMBtu. All 51 observations are numeric.
The sum, mean, median, quartiles, rankings, threshold counts, and cumulative shares in this article were calculated directly from those 51 observations. No missing value was zero-filled, no observation from another year was substituted, and the tables and charts use the same underlying state values.
Frequently Asked Questions
Does this series represent all U.S. electric-power fuel consumption?
No. It is limited to EIA sectorid=2, IPP Non-CHP, using fuel input for electricity generation.
Which state has the largest 2025 observation?
Texas is highest at 2,643.43 million MMBtu, or 20.47% of the 51-observation analytical sum.
Is this the same as a net-generation ranking?
No. Fuel input is an energy-input measure, while net generation is electricity output and is normally measured in MWh.
Is the 12,915.37 million MMBtu sum an official U.S. national total?
It is the direct sum of the 51 state and District of Columbia observations used for this comparison, not automatically a separate official national aggregate.
Related Articles
Green Map creates custom-edited map images using open geographic data sources such as geoBoundaries, Natural Earth, OpenStreetMap, and government open data. These maps are edited visual materials, not raw data files, and are provided for education, documents, presentations, and graphic reference.