Net electricity generation from independent power producers operating non-CHP plants was highly concentrated in a small group of U.S. states in 2025. Using the U.S. Energy Information Administration’s Electric Power Operations series with field `generation`, fueltypeid=ALL, and sectorid=2 for IPP Non-CHP, the 50 states and the District of Columbia total 1,842,684.50 thousand megawatthours, or about 1,842.68 TWh. Texas is the largest observation at 405,215.15 thousand MWh, equal to 405.22 TWh and 21.99% of the 51-jurisdiction total.
The sector boundary matters as much as the year and fuel category. This series does not represent all electricity generated in each state. It is restricted to the IPP Non-CHP sector. Generation from utilities, CHP facilities, and other sector classifications can sit outside this slice. A state can therefore have a low value here while still producing substantial electricity overall.
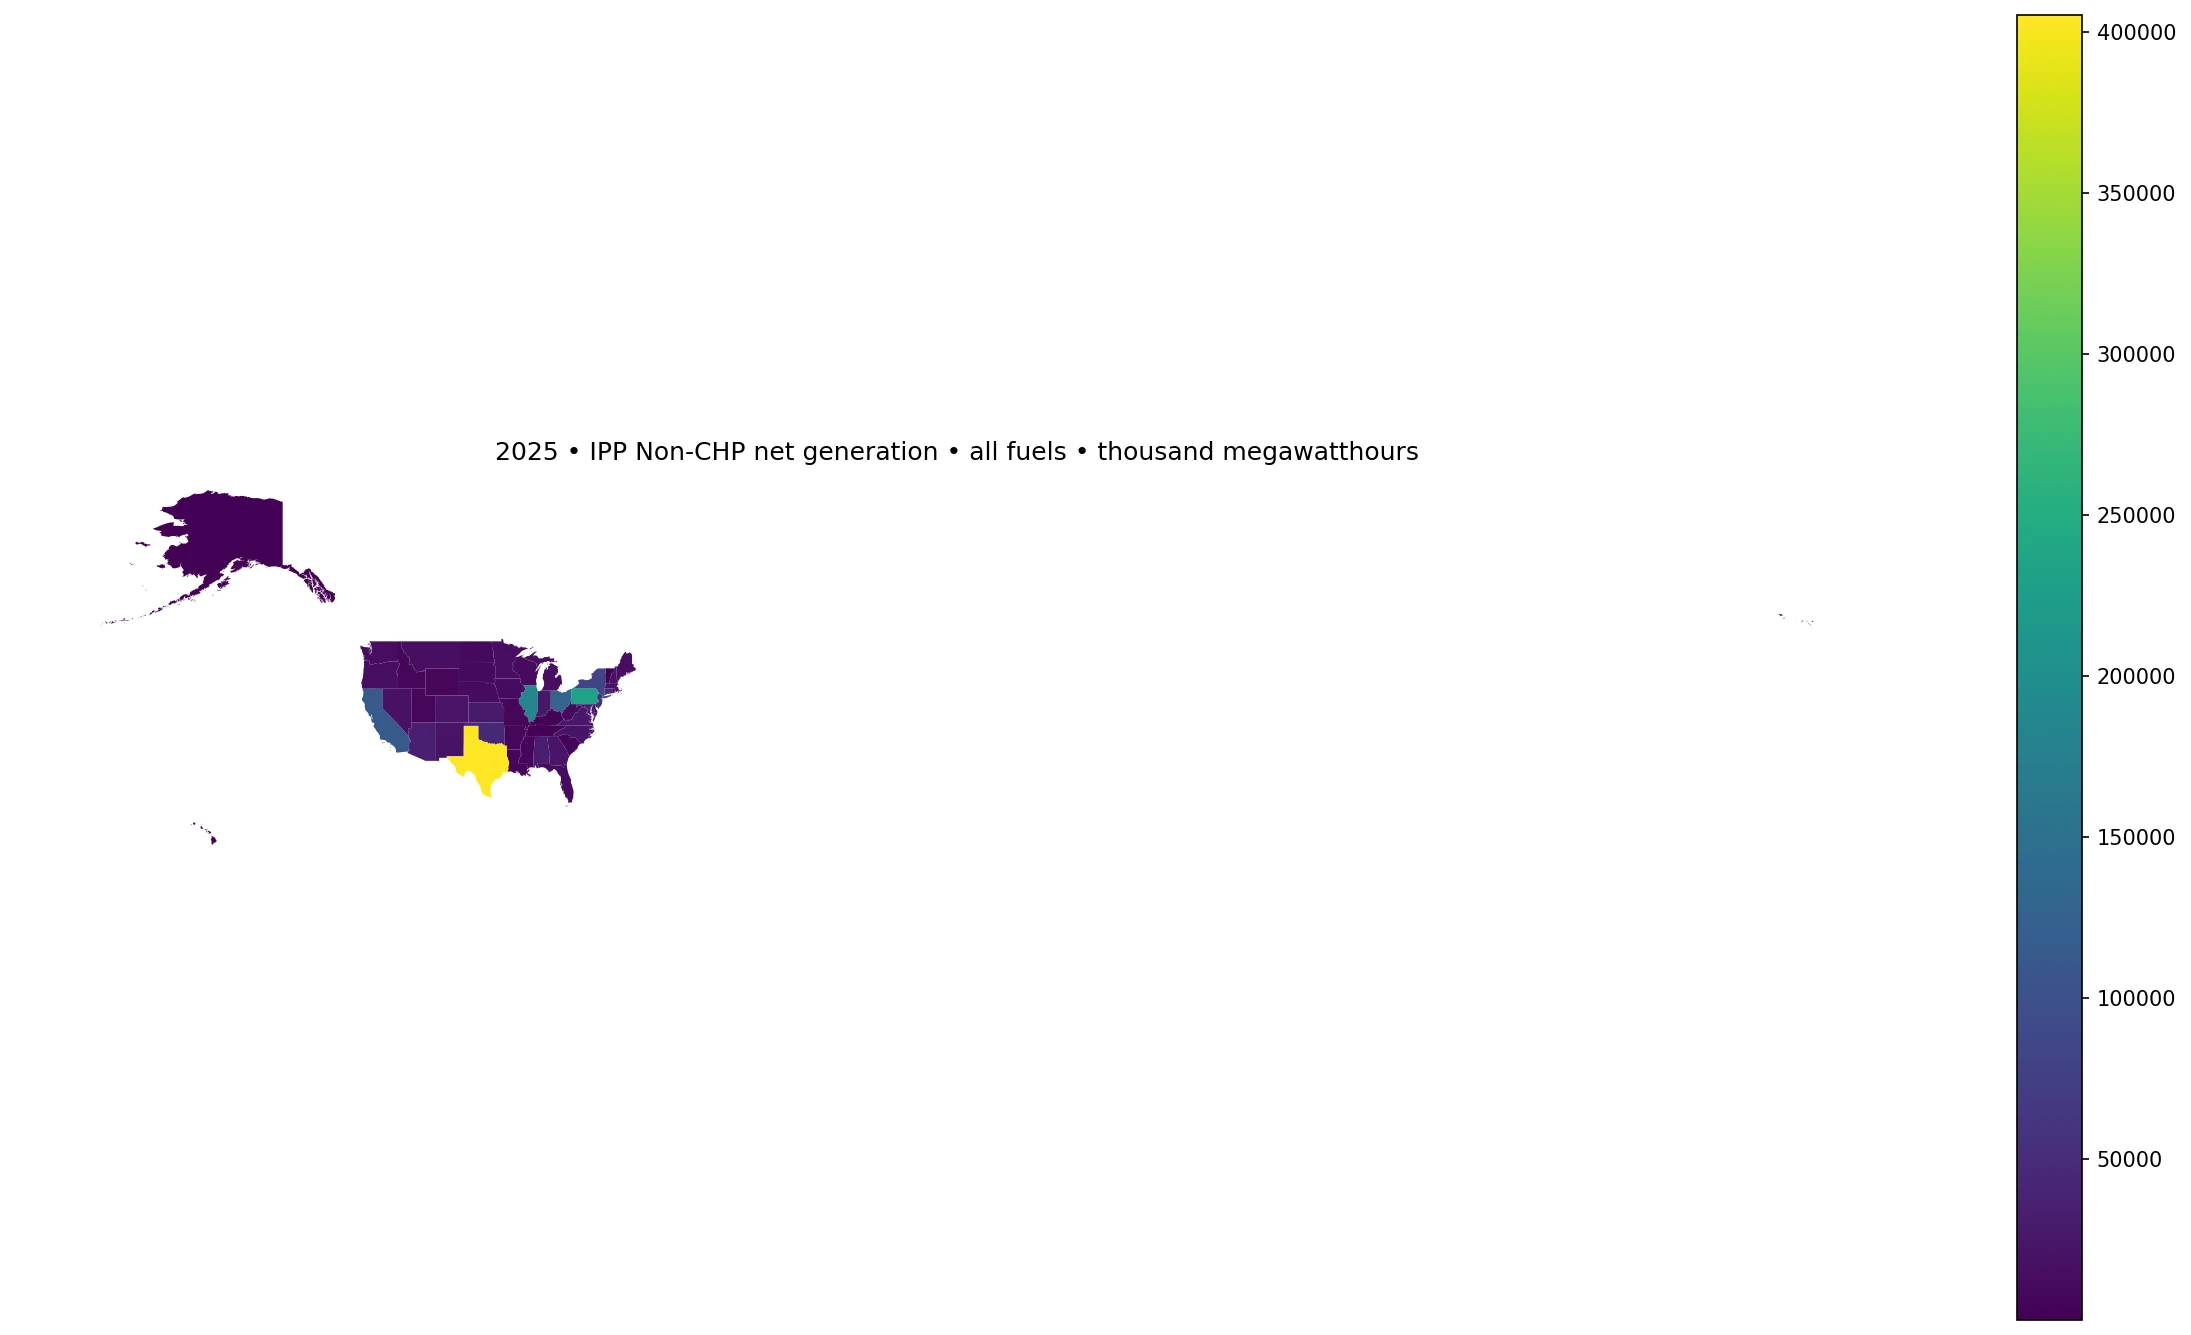
Table of Contents
The 51-jurisdiction total is about 1,842.68 TWh
The simple state mean is 36,131.07 thousand MWh, or 36.13 TWh, but the median is only 14,324.78 thousand MWh, or 14.32 TWh. The first quartile is 7.14 TWh and the third quartile is 27.20 TWh. The large gap between mean and median shows how strongly a handful of large states pull the distribution upward.
Five states exceed 100 TWh and seven exceed 50 TWh. Sixteen jurisdictions are below 10 TWh. The range extends from only 0.048 TWh in the District of Columbia to 405.22 TWh in Texas. That spread describes the scale of IPP Non-CHP generation, not the full size of each state’s electricity system.
Texas alone accounts for 21.99%
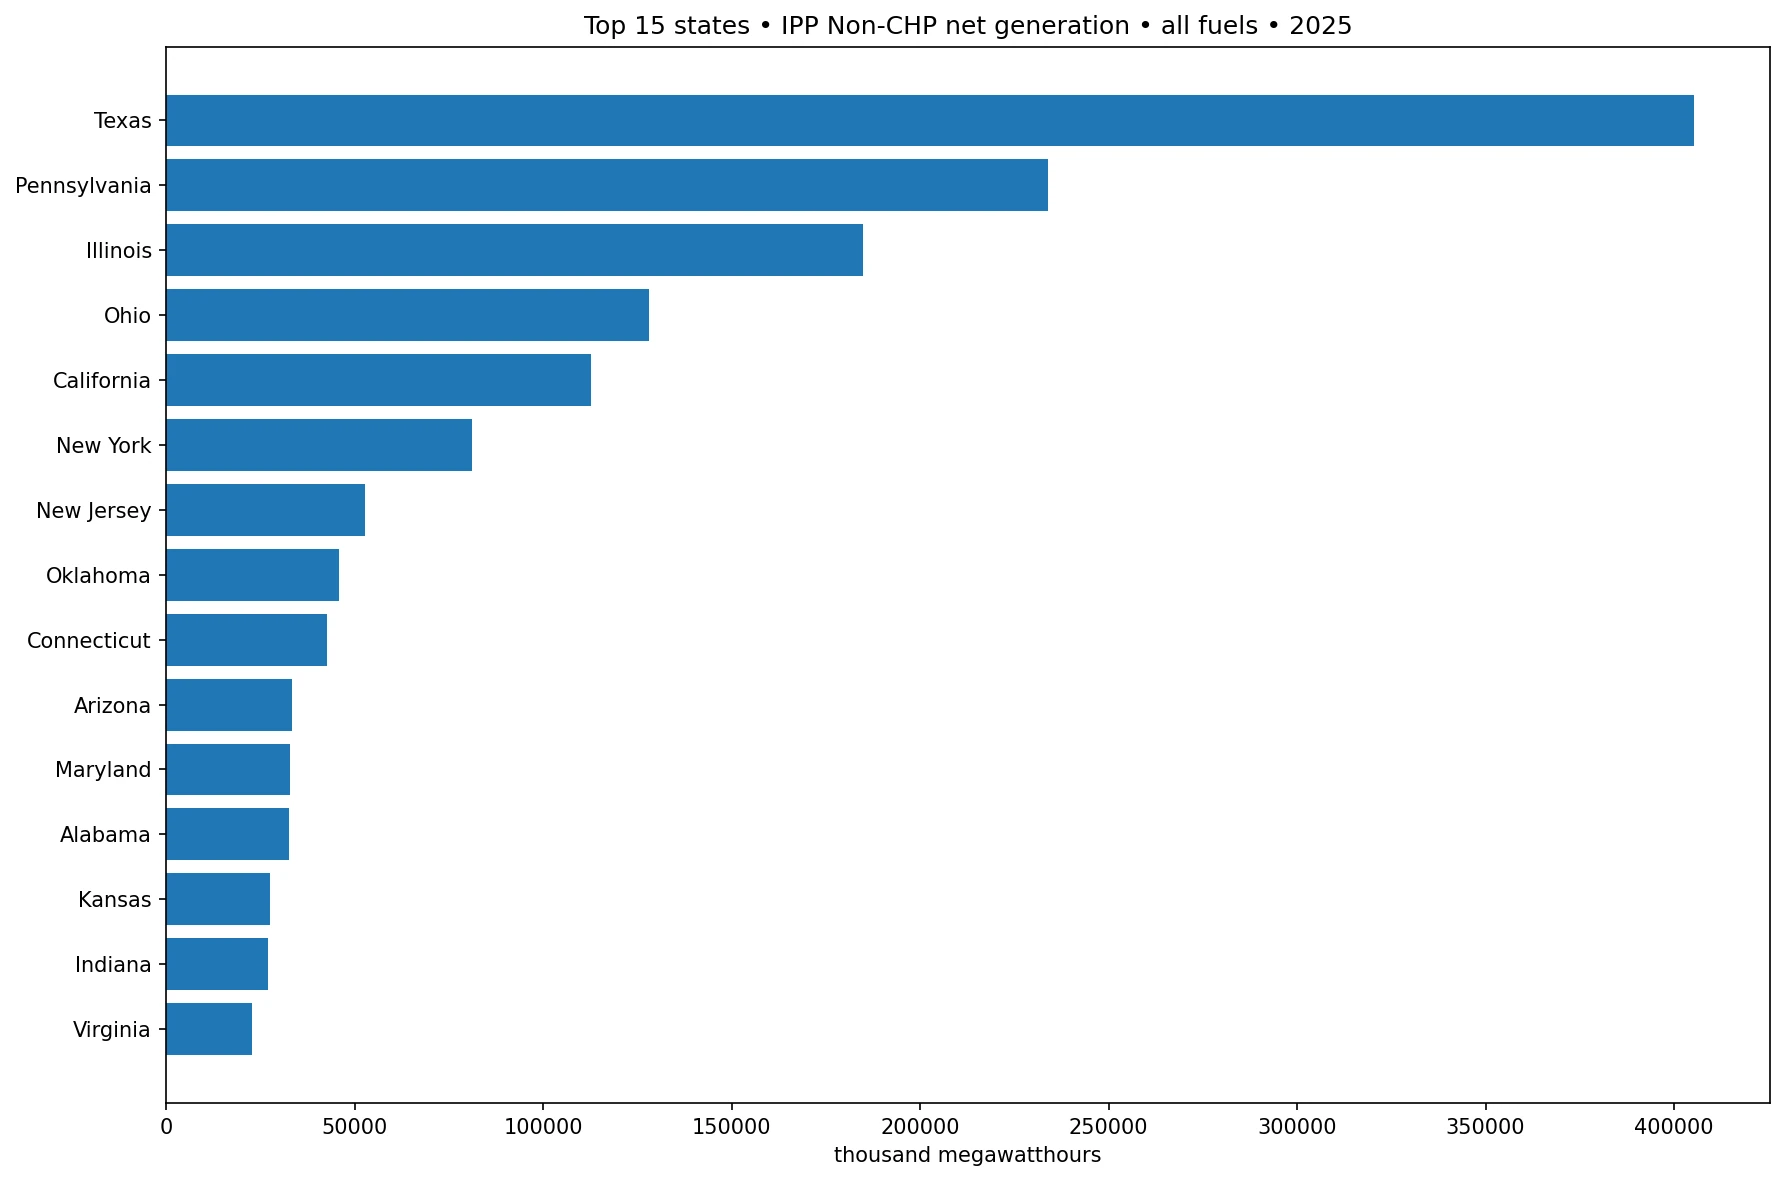
Texas contributes 21.99% of the 51-jurisdiction total. Pennsylvania adds 12.70%, taking the top-two share to 34.69%. The top five states account for 57.78%, and the top ten reach 71.65%. This is a highly concentrated distribution: ten states produce more than seven-tenths of all generation in this particular EIA sector slice.
The dataset does not by itself identify why those states have such large IPP Non-CHP totals. Plant ownership, generating capacity, capacity factors, wholesale-market structure, fuel mix, resource availability, and annual operating conditions can all matter. Because fueltypeid is ALL, the current series intentionally combines all eligible generation sources instead of explaining their composition.
The ten largest state observations
| State | thousand MWh | TWh | Share of 51-jurisdiction total |
|---|---|---|---|
| Texas | 405,215.15 | 405.22 | 21.99% |
| Pennsylvania | 233,990.53 | 233.99 | 12.70% |
| Illinois | 184,914.72 | 184.91 | 10.04% |
| Ohio | 128,031.82 | 128.03 | 6.95% |
| California | 112,612.20 | 112.61 | 6.11% |
| New York | 81,191.34 | 81.19 | 4.41% |
| New Jersey | 52,692.88 | 52.69 | 2.86% |
| Oklahoma | 45,699.54 | 45.70 | 2.48% |
| Connecticut | 42,498.62 | 42.50 | 2.31% |
| Arizona | 33,440.25 | 33.44 | 1.81% |
Texas is followed by Pennsylvania at 233.99 TWh, Illinois at 184.91 TWh, Ohio at 128.03 TWh, and California at 112.61 TWh. New York records 81.19 TWh and New Jersey 52.69 TWh. Oklahoma, Connecticut, and Arizona complete the top ten at 45.70, 42.50, and 33.44 TWh respectively.
The leading states span the South, Northeast, Midwest, and West. The pattern is therefore not a simple regional cluster. What they share is a large amount of generation attributed to the IPP Non-CHP category. The values are absolute output totals, not per-capita or per-unit-of-demand measures.
The smallest observations show why sector scope cannot be ignored
| State or jurisdiction | thousand MWh | TWh | Share of 51-jurisdiction total |
|---|---|---|---|
| District of Columbia | 48.47 | 0.05 | 0.003% |
| Alaska | 63.20 | 0.06 | 0.003% |
| Vermont | 1,351.61 | 1.35 | 0.073% |
| Hawaii | 1,780.91 | 1.78 | 0.097% |
| Tennessee | 2,049.57 | 2.05 | 0.111% |
| Kentucky | 2,324.99 | 2.32 | 0.126% |
| Delaware | 3,991.80 | 3.99 | 0.217% |
| South Carolina | 4,668.17 | 4.67 | 0.253% |
| Mississippi | 5,598.90 | 5.60 | 0.304% |
| Louisiana | 6,356.98 | 6.36 | 0.345% |
The District of Columbia records 48.47 thousand MWh, about 0.048 TWh. Alaska is next at 63.20 thousand MWh, about 0.063 TWh. Vermont records 1.35 TWh, Hawaii 1.78 TWh, Tennessee 2.05 TWh, and Kentucky 2.32 TWh.
These small values should not be read as total state generation. A state can rely heavily on utility-owned plants, CHP facilities, or another EIA sector category and therefore appear small in IPP Non-CHP even when its total electricity production is much larger. Alaska is an especially clear reminder that the sector slice is narrower than the state power system.
IPP Non-CHP is not the same as all utility-scale generation
The series title refers to utility-scale electricity net generation, but sectorid=2 narrows the institutional scope. A broader utility-scale total can include generators outside the independent-producer non-CHP category. That is why closely related EIA articles can report very different state totals without contradicting one another.
A valid comparison requires matching the field, year, fuel category, sector, geography, and unit. If sectorid changes, the set of plants contributing to the state value changes. If fueltypeid changes from ALL to renewable, solar, natural gas, or another category, the energy-source coverage changes as well.
All fuels does not reveal the generation mix
Texas’s 405.22 TWh is a total across the fuel categories included in ALL. It does not tell us how much came from natural gas, wind, solar, nuclear, coal, or other sources. The same is true for every state in the ranking. Source-level analysis requires the corresponding EIA series with a more specific fuel facet.
This prevents two common misreadings. A high all-fuels total is not automatically evidence of fossil dependence, and it is not automatically evidence of renewable leadership. Both statements require a denominator or fuel-specific split that the current series does not provide.
Net generation is an output measure, not a fuel-input measure
The `generation` field measures electricity output in megawatthours. It is different from EIA fuel-consumption fields expressed in Btu and from heat-content fields expressed per physical unit. Electricity output and fuel input are related, but they answer different questions and cannot be substituted for one another.
Efficiency analysis would require output and input together. A state with high IPP Non-CHP generation is not necessarily less efficient because it produces more electricity, and a state with low generation is not necessarily more efficient. The current ranking is about scale of net output only.
State generation is not the same as state electricity use
Electricity can move across state boundaries, and generating plants are not distributed in the same pattern as end-use demand. A state can generate far more than its own consumers use, or rely heavily on power generated elsewhere. This dataset records where generation occurs under the defined sector, not where electricity is ultimately consumed.
Retail sales, end-use consumption, and interstate power-flow data answer different questions. Treating generation and consumption as interchangeable would erase an important part of how the U.S. grid works.
The ranking is strongly concentrated at the top
The top-five share of 57.78% is a useful summary of concentration. Texas alone contributes more than one fifth of the total, and the first two states contribute more than one third. By the time the ranking reaches the tenth state, 71.65% of the total has already been accounted for.
The median provides another perspective. Half of the 51 jurisdictions produce 14.32 TWh or less in this sector, even though the mean is 36.13 TWh. Without the median, the large Texas, Pennsylvania, and Illinois values can make the typical state look much larger than it actually is.
One year is a snapshot rather than a trend
These figures refer to 2025 only. They do not show whether Texas has been gaining or losing share, whether Pennsylvania’s IPP fleet has expanded, or whether a state’s low value is temporary. New plants, retirements, maintenance, fuel prices, demand, weather, and operating conditions can all move annual generation.
A trend analysis should preserve the exact EIA route, `generation` field, fueltypeid=ALL, sectorid=2, annual frequency, state geography, and unit across years. Mixing an IPP Non-CHP series with a broader utility-scale or renewable-only series would create a definition change rather than a clean time trend.
How to read the map, table, and chart together
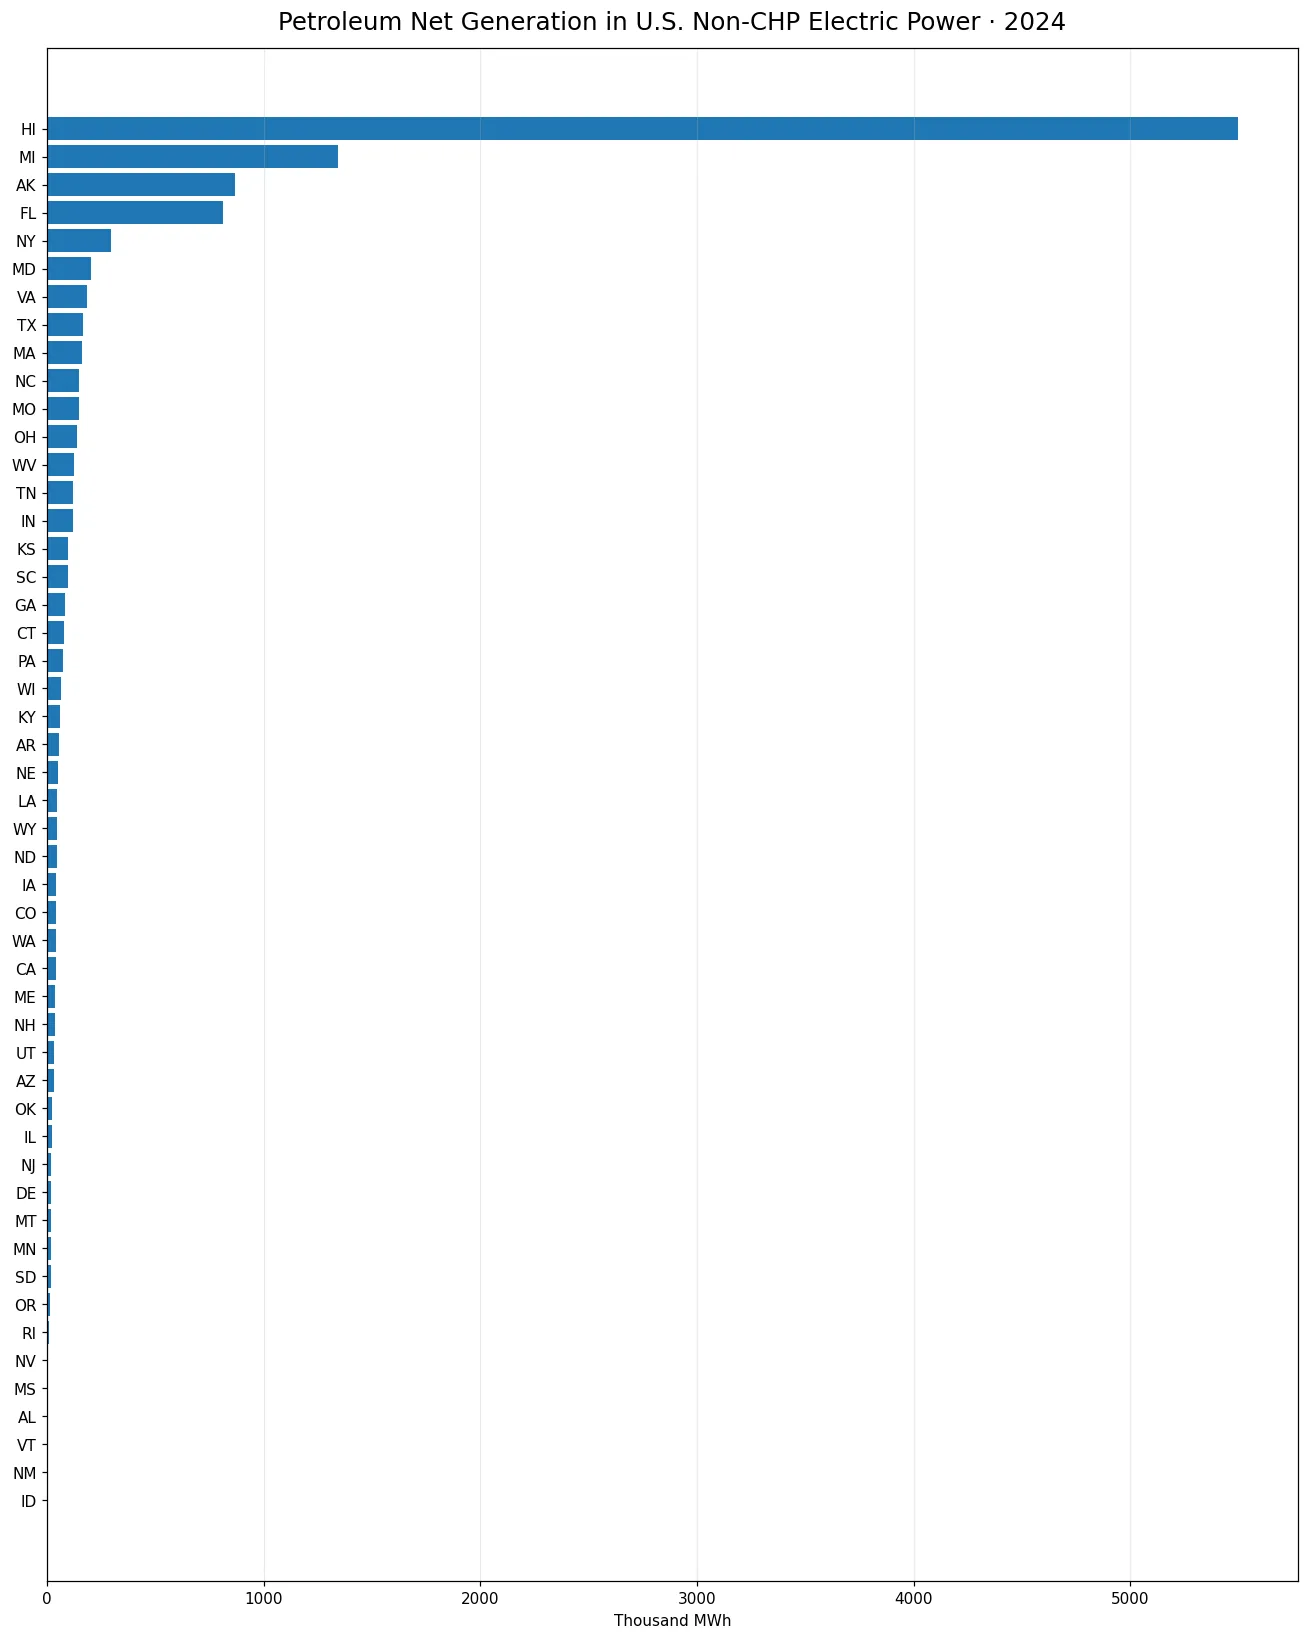
The map reveals where the largest values are located, the table provides exact totals and shares, and the top-15 chart shows the steep drop from Texas to the rest of the leading group. Together they make the concentration pattern much clearer than any one visual alone.
The lower tail matters too. Sixteen jurisdictions are below 10 TWh, so the national pattern is not simply a smooth decline from the largest states. It is a distribution with a very large upper tail and many relatively small state values.
Data source and calculation method
The source is the U.S. Energy Information Administration’s Electric Power Operations (Annual and Monthly) API. The reference year is 2025, the field is `generation`, fueltypeid=ALL, and sectorid=2 for IPP Non-CHP. The published unit is thousand megawatthours, and the dataset contains 51 official observations covering all 50 states and the District of Columbia.
The total, mean, median, quartiles, rankings, and shares are calculated directly from those 51 observations. No missing value was replaced with zero. State codes were joined to U.S. state boundaries, and all 51 observations matched successfully, giving the map a 100% geographic join rate.
Frequently Asked Questions
Does IPP Non-CHP net generation represent all U.S. electricity generation?
No. It is restricted to sectorid=2, IPP Non-CHP. Utility, CHP, and other sector categories are outside this specific slice.
Does all fuels mean renewable generation only?
No. ALL combines the eligible fuel categories within the sector. Fuel-specific generation requires a more specific fueltypeid.
Does Texas ranking first mean it also consumes the most electricity?
No. This is generation by location. State electricity consumption is measured with separate sales or end-use indicators.
Related Articles
Green Map creates custom-edited map images using open geographic data sources such as geoBoundaries, Natural Earth, OpenStreetMap, and government open data. These maps are edited visual materials, not raw data files, and are provided for education, documents, presentations, and graphic reference.