Menominee County occupies the southern end of Michigan’s Upper Peninsula, where the Menominee River follows the Wisconsin boundary and the county’s eastern side meets Green Bay. The long north–south shape is easiest to understand by following US-41 from the city of Menominee through Stephenson, Daggett, and Carney toward Powers. Farther north, US-2 and M-69 provide the main east–west references. This page compares roads and communities with rivers, shoreline, and terrain, and the same map set is available as high-resolution JPG files in the download box below.
The county changes noticeably from one end to the other. Menominee sits at the southern tip near both Green Bay and the mouth of the Menominee River, while the northern interior contains fewer labeled communities and a denser network of streams. The elevation sheet adds another clear contrast: land near the southern and eastern shore is generally lower, while broad areas in the north and northwest rise substantially higher. Menominee County’s official area information also describes the county as a mix of forests, rivers, lakes, and Lake Michigan shoreline, which matches the strong water-and-relief pattern visible across the supplied maps.
Table of Contents
US-41 links Menominee, Stephenson, Daggett, Carney, and Powers along the county’s long interior
The general county map gives Menominee a very different position from the inland communities. The city is tucked into the southern tip, where the state boundary, river, and Green Bay all come close together. US-41 then runs north through the interior and provides the easiest reference for Stephenson, Daggett, Carney, and Powers. M-35 is shown near the Green Bay side at the south, while US-2 crosses the northern part of the county near Powers. Hermansville appears west of Powers and helps anchor the northwestern interior beyond the main north–south chain of communities.
The county outline is just as informative as the road network. In the southwest, the border bends with the Menominee River instead of following a simple straight line. Along the east, Green Bay creates a long coastal edge, while the northern county line steps through several angular segments. These different boundary shapes make the map especially useful for understanding why Menominee County looks narrow in the south and broader across parts of the interior. Near the southern tip, the city of Menominee sits directly across the state line from Wisconsin communities, so the road, river, shoreline, and state boundary can all be read together.
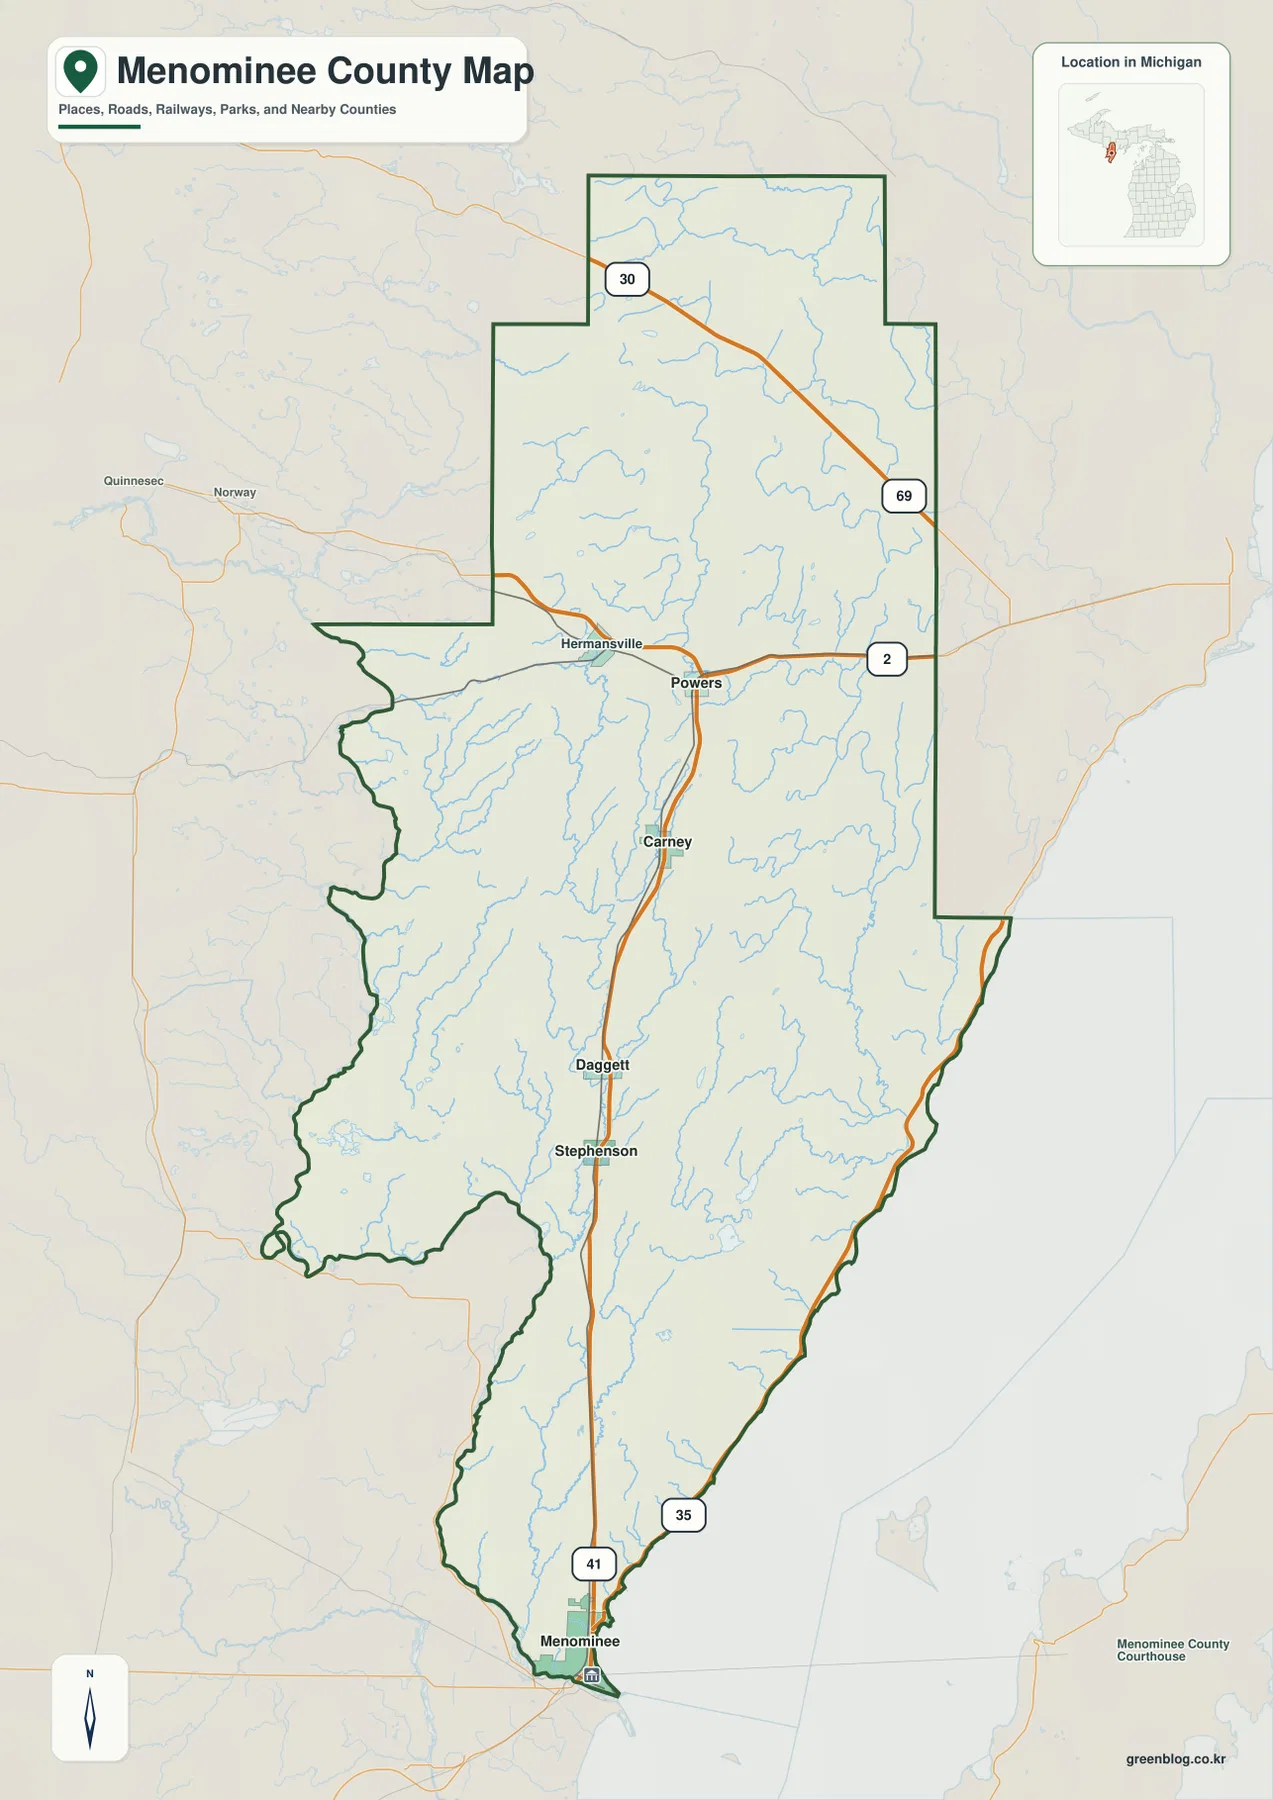
Road patterns change north of Powers. The southern half of the county is easy to orient around US-41, but the northern interior spreads out around east–west routes and long stretches with few major place labels. M-69 is visible farther north, and the surrounding area is crossed by many streams rather than a dense street network. That difference matters when reading the county as a whole: the Menominee–Stephenson corridor is not simply repeated all the way to the northern boundary. The upper county is more dispersed, with roads serving a much larger inland landscape.
The city index separates the southern center from the smaller US-41 communities farther north
The city-index map highlights five places: Menominee, Stephenson, Powers, Carney, and Daggett. Menominee is the clear southern anchor, while the other four are distributed along the county’s interior rather than clustered near the shore. Stephenson and Daggett occupy the south-central section, Carney sits farther north, and Powers lies near the northern road junctions. Seeing these places without the full road detail makes the basic settlement pattern much easier to remember: one larger center at the tip and a sequence of smaller communities extending inland.
This map is most useful for relative position, not municipal boundaries or travel mileage. The symbols do not define the legal limits of each city or village, and the spacing between them should not be treated as a driving-distance scale. Instead, use it to answer simple questions such as which named community lies north of Stephenson or which place is closest to the US-2 corridor. Returning to the general county map then adds the roads, streams, and surrounding boundary needed for more detailed geographic context.
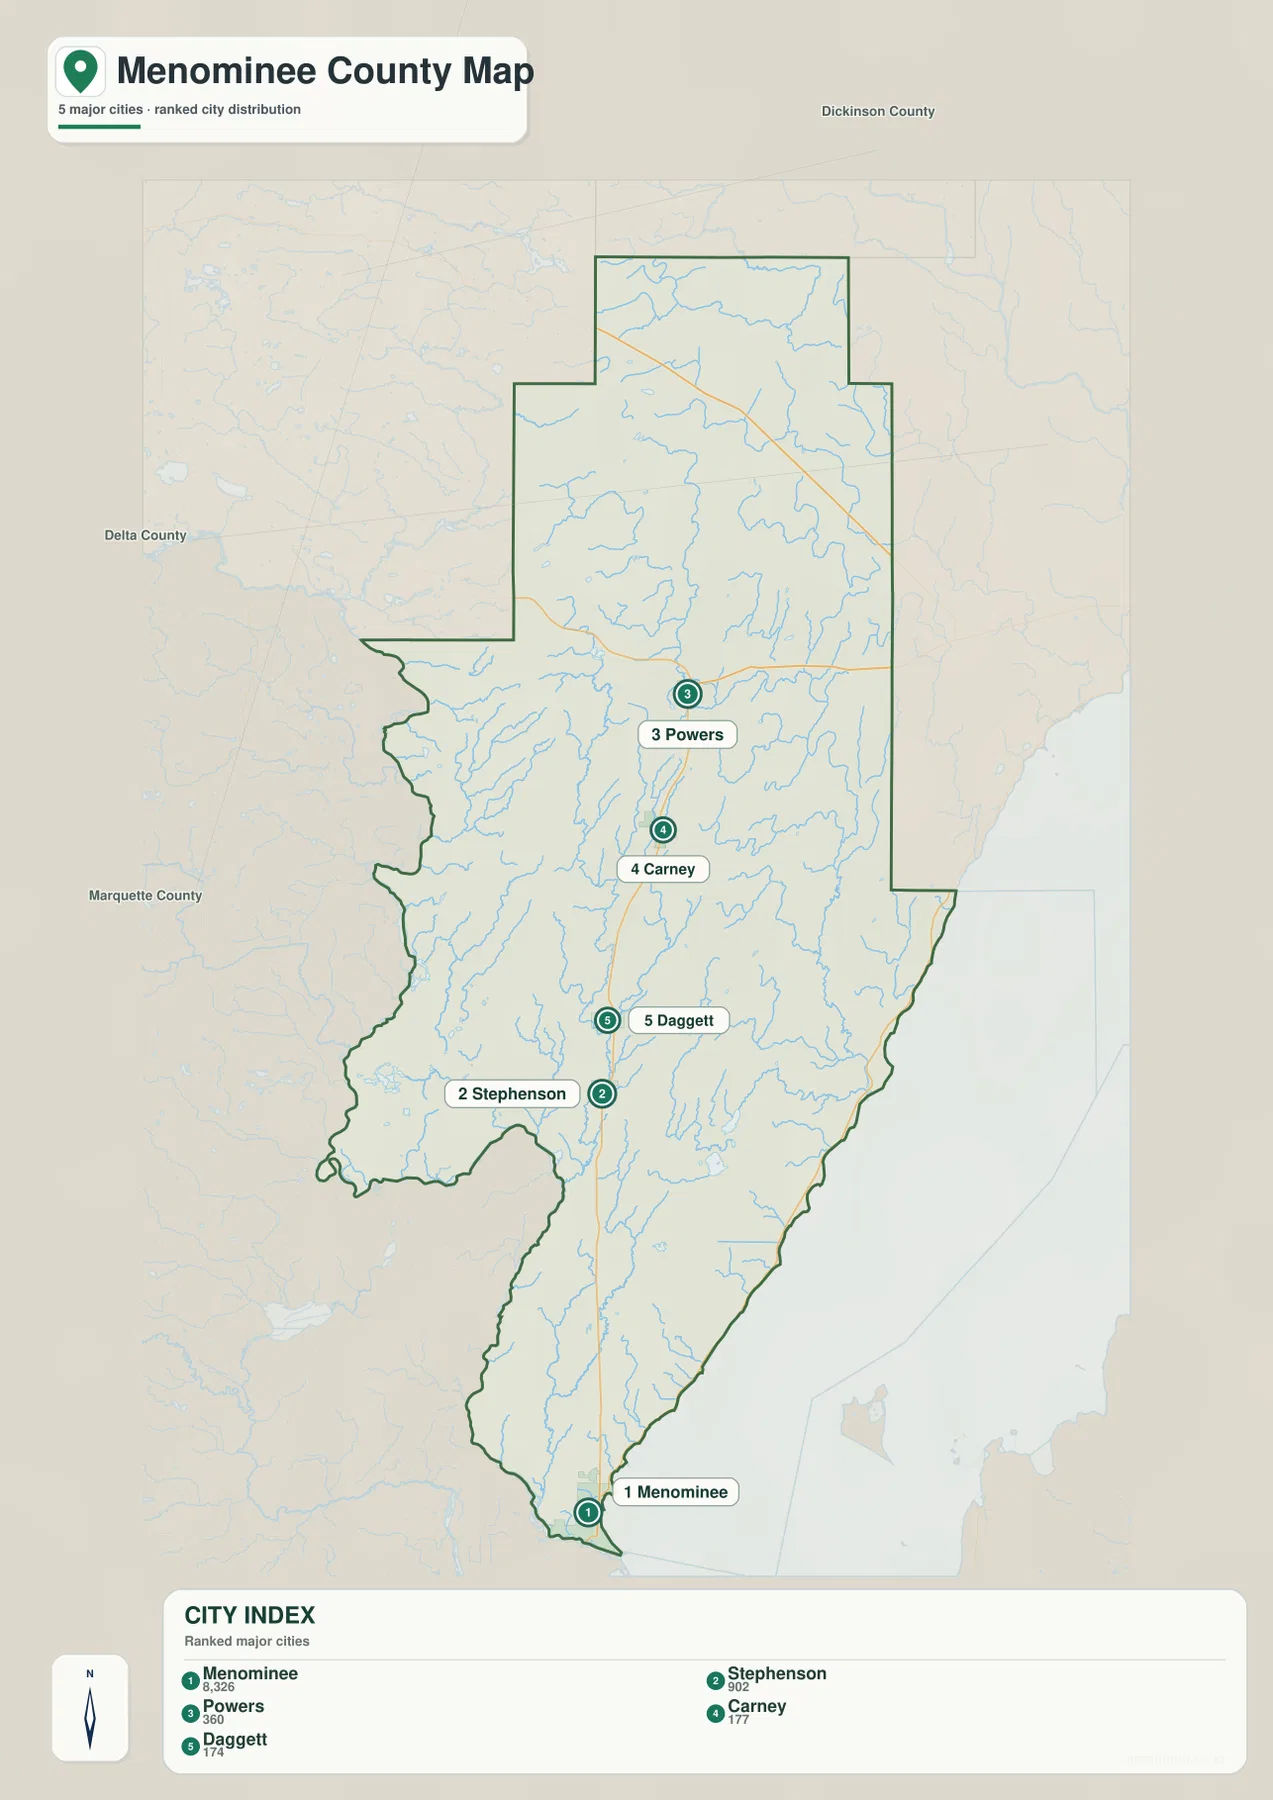
Comparing the city index with the general map also prevents a common misunderstanding. Menominee County is not centered on one compact urban cluster. The communities are spread over a long distance, and substantial areas between them are dominated by forest, streams, and smaller roads. Powers is especially useful as a northern reference because US-2 crosses nearby, while Menominee works as the southern reference because it sits beside both the river and Green Bay. Using those two endpoints makes the locations of Stephenson, Daggett, and Carney easier to place.
The Menominee River boundary and Green Bay shore frame a dense inland network of rivers and creeks
Water is one of the strongest geographic features on the map set. The Menominee River follows the southwestern edge and forms much of the Michigan–Wisconsin boundary in this part of the county. Green Bay occupies the opposite side along the east and southeast, creating a long coastal reference that is visible immediately on the terrain-and-water sheet. These two large water features give the county a clear frame before the smaller inland rivers are even considered.
Inside the county, Little River runs through the southern interior, while Little Cedar River and Big Cedar River become important farther north. Big Cedar River turns eastward toward Green Bay, and Ford River makes a prominent bend across the northern section. The map also labels Foxy Creek, Walton River, and Hayward Lake, among many smaller blue lines. The result is not a single dominant drainage corridor but a branching network that reaches both the Green Bay side and the Menominee River side of the county.
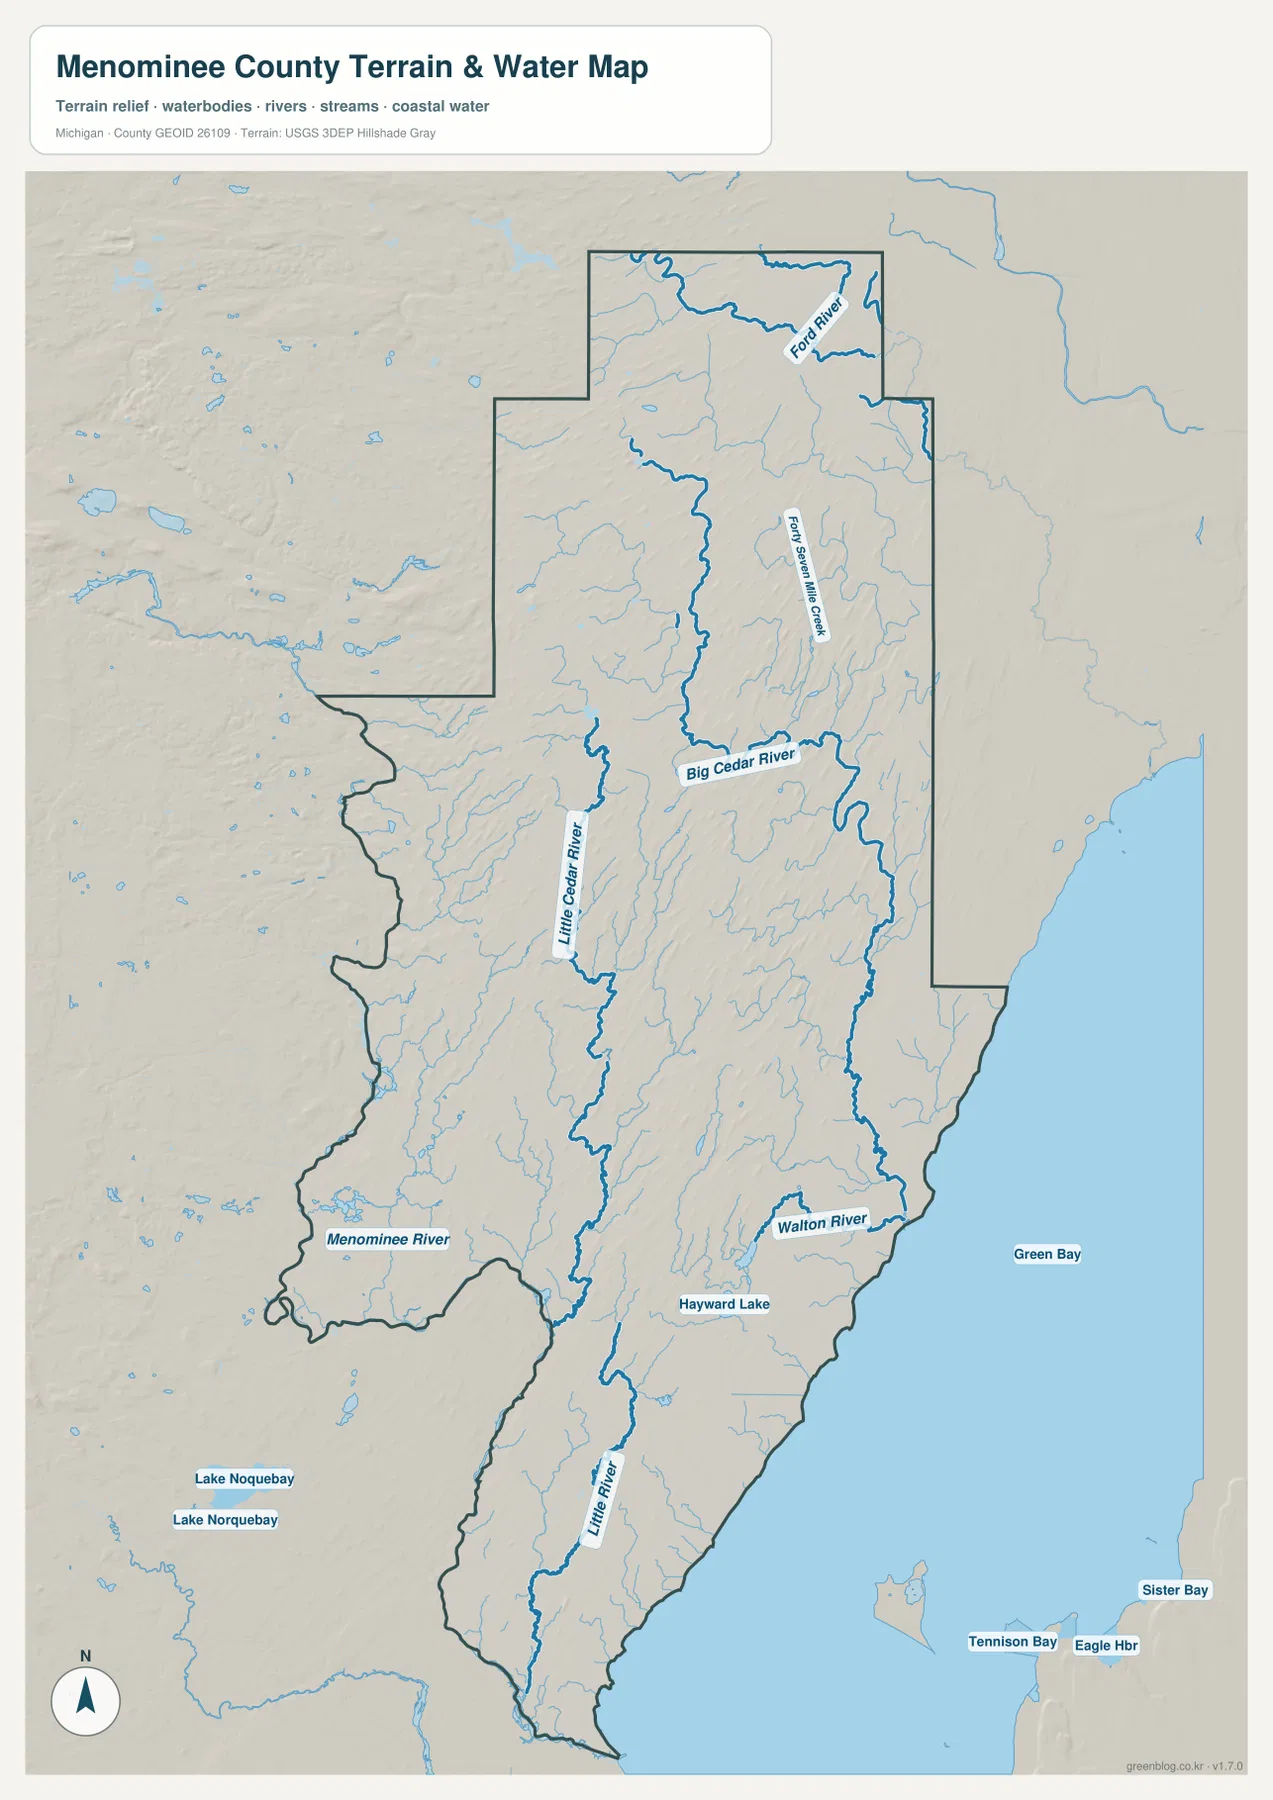
The water sheet is designed for county-scale location and comparison. It does not show current streamflow, flood probability, wetland regulatory limits, channel depth, or safe boating routes. Those questions require current specialized information from the USGS and appropriate Michigan or local agencies. For general study, a useful sequence is to begin with the Menominee River on the Wisconsin border, move across the Little River and Cedar River systems, and finish at the Green Bay shore. That progression makes the county’s many inland waterways much easier to organize.
Elevation of about 177–355 meters rises toward the north and northwest and drops toward Green Bay
The elevation map reports an actual county range of roughly 177 to 355 meters, with a mean near 239 meters. Lower green terrain dominates the southern tip and much of the eastern side near Green Bay. Around Menominee and the lower interior, the colors remain mostly in the lower part of the local scale, and several stream valleys continue those low bands farther north. The relationship becomes easier to see when the elevation sheet is compared directly with the water map.
Higher terrain is concentrated across the north and northwest, where tan and brown colors cover a broad area. The change is gradual in some places and broken by lower stream corridors in others, so the county is not a single smooth slope. Smaller ridges and upland patches appear across the west-central interior as well. Moving southeast, the colors generally shift back toward green as the land approaches Green Bay. This broad contrast explains why the northern interior looks more rugged on the shaded-relief surface than the flatter coastal and southern areas.
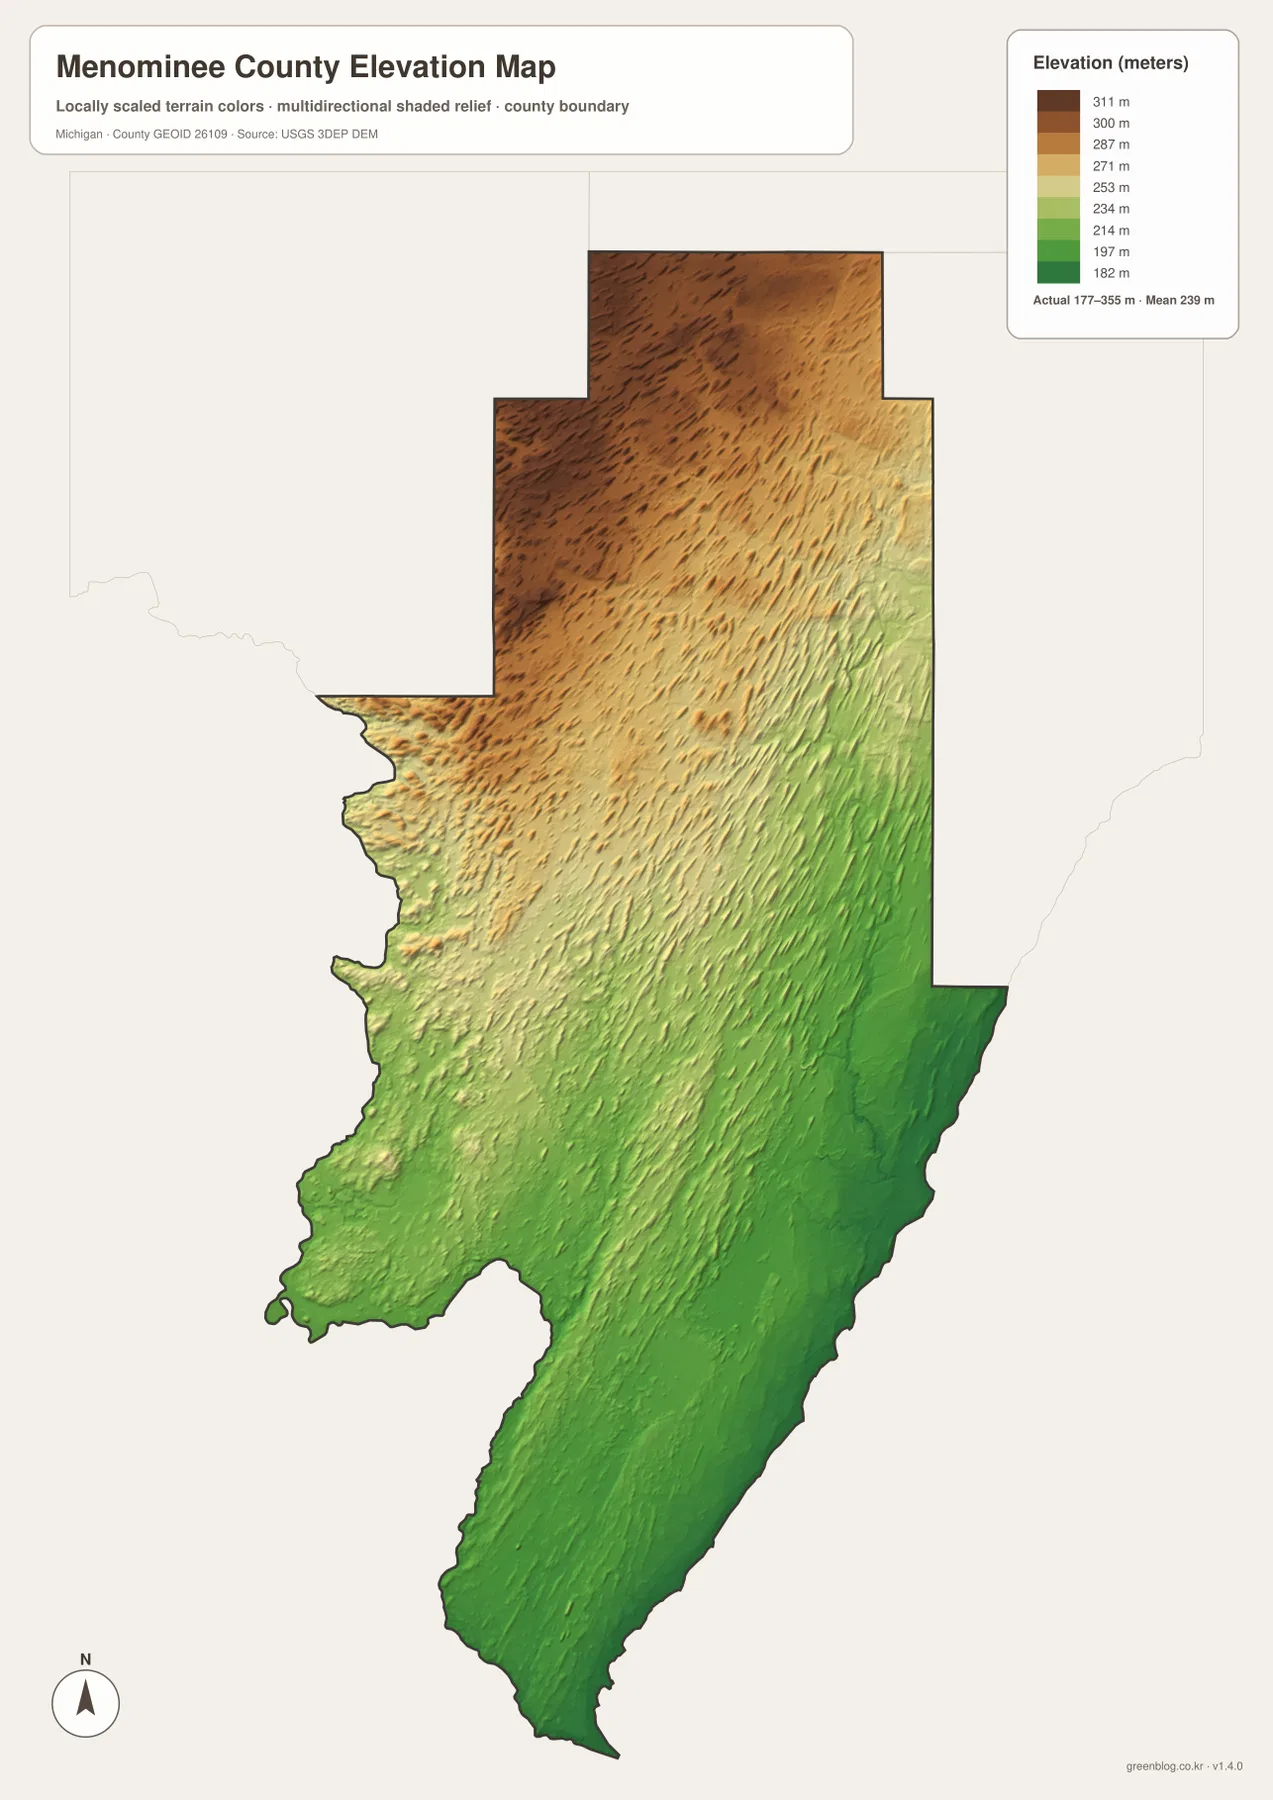
The colors are meant for broad geographic comparison rather than site-level measurement. Brown areas should not automatically be described as mountains, and green areas do not establish flood risk. Exact building-site elevations, drainage grades, road engineering, and parcel surveys require original elevation data and professional measurements when applicable. For county orientation, the map is most helpful for showing the simple regional contrast between higher northern ground and lower areas closer to Green Bay and the southern river mouth.
Combining the road, water, and elevation sheets explains why the county changes so much from south to north
A practical way to read Menominee County is to start at the southern tip. Find Menominee between the river and Green Bay, follow US-41 north through Stephenson, Daggett, Carney, and Powers, and then locate US-2 crossing the northern interior. On the terrain-and-water map, return to those same places and trace the Menominee River, Little River, Big Cedar River, and Ford River. Finally, compare the elevation colors to see the rise from the low southern and eastern areas into the higher north and northwest. Each map answers a different part of the same geographic story.
The general county map is the best choice for named places, major roads, and the boundary. The city-index map is simpler when the main goal is comparing the position of Menominee, Stephenson, Powers, Carney, and Daggett. The terrain-and-water sheet is preferable for river and shoreline names, while the elevation sheet shows the county-wide high-and-low pattern most clearly. None of these maps is intended to replace live navigation, parcel mapping, legal boundary records, flood maps, or engineering data.
The WebP images in the article are optimized for online viewing. The downloadable ZIP contains four high-resolution JPG originals at 3638 × 2572 pixels each, which makes them better for enlarging labels, printing a county reference sheet, or preparing classroom material. They remain general reference maps, so any task requiring current, legal, or survey-grade information should be checked against the appropriate official source.
Frequently Asked Questions
What is the easiest way to locate Menominee, Stephenson, and Powers on the maps?
Start with Menominee at the southern tip and follow US-41 north. Stephenson appears in the south-central part of the county, while Powers is much farther north near the US-2 corridor. The city-index map gives the simplest comparison, and the general county map adds the road network and surrounding geography.
Which map best shows the Menominee River, Cedar River system, and Green Bay?
The terrain-and-water map is the clearest choice. It emphasizes the Menominee River along the Wisconsin boundary, Green Bay on the east, and inland waterways including Little River, Little Cedar River, Big Cedar River, Ford River, and Walton River. It is a geographic reference rather than a flood or navigation map.
Can the 177–355 meter elevation range be used for construction or flood decisions?
No. The elevation map is a generalized county-scale surface intended to compare broad high and low areas. Exact site elevations, drainage design, flood assessment, road engineering, and parcel surveys should rely on authoritative source data and professional measurements when required.
Map File Information
The ZIP contains high-resolution JPG originals of the Menominee County general map, city-index map, terrain-and-water map, and elevation map. They are larger than the WebP images used in the article and are better suited to zooming and printing.
- Included Files: Use only the versions confirmed in the article and supplied images
- File Type: Use the confirmed download contents
- Intended Use: Printing, education, presentations, and map-based projects
Related Maps
Sources and references
- Menominee County area information: official county overview of location, shoreline, rivers, lakes, and local geography.
- Library of Michigan – Menominee County Guide: county history and reference resources.
- U.S. Census Bureau TIGER/Line Shapefiles: official geographic reference data for county boundaries and roads.
- USGS National Hydrography: authoritative reference information for rivers, streams, and lakes.
- USGS 3D Elevation Program: authoritative elevation-data reference.
Green Map creates custom-edited map images using open geographic data sources such as geoBoundaries, Natural Earth, OpenStreetMap, and government open data. These maps are edited visual materials, not raw data files, and are provided for education, documents, presentations, and graphic reference.