Public secondary institutions spend money on recurring items such as staff compensation, teaching materials, administration and ancillary services, as well as on longer-lived capital assets. World Bank indicator SE.XPD.CSEC.ZS measures the current-expenditure share of direct expenditure in public secondary educational institutions. A value of 95% means that about 95% of direct expenditure at that level was classified as current spending in the reported year.
The latest-available dataset covers 171 economies, but the observation years range from 2001 to 2024. Only 18 observations are from 2024, 22 are from 2023 and 40 are from 2022; 91 economies have a latest value from 2021 or earlier. The map therefore maximizes geographic coverage with each economy’s latest available value. It should not be read as a single-year global ranking.
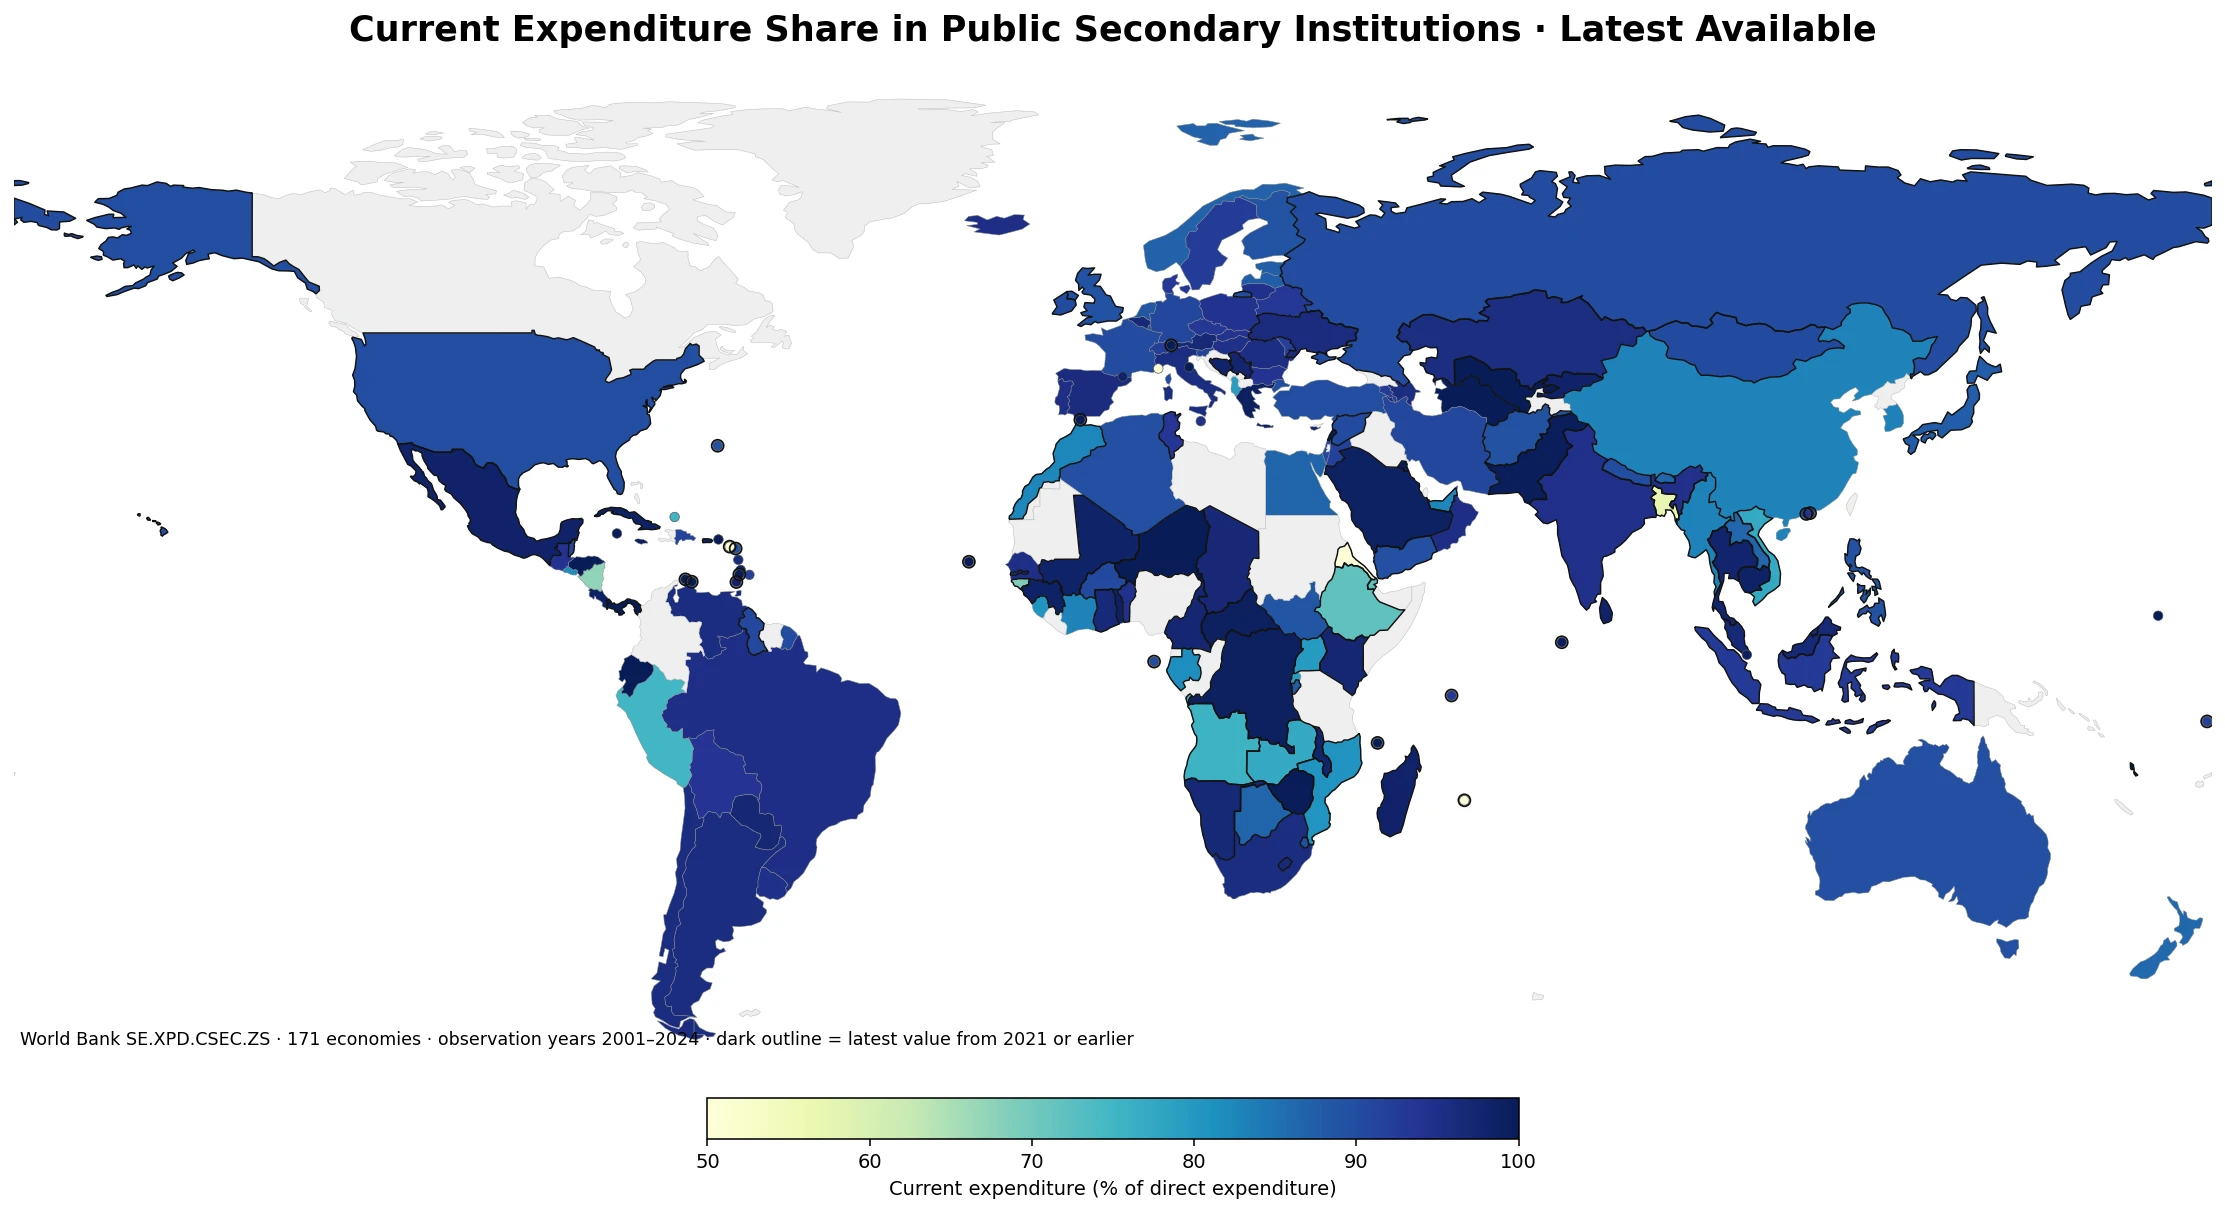
Table of Contents
This is not total education spending or education spending as a share of GDP
The denominator is direct expenditure in public secondary institutions, not a country’s entire education budget. Under the World Bank definition, current expenditure includes staff compensation and other recurring expenditure, such as teaching materials, ancillary services and administration. Financial aid to students and other transfers are excluded from direct expenditure. The indicator therefore answers a composition question rather than showing how much a country spends on education overall.
Current expenditure is consumed during the year and would need to be renewed if required again in the following year. Capital spending has a different time profile because it is associated with assets that can provide services for multiple years. A high current-spending share indicates an operating-cost-heavy mix of direct expenditure; it does not by itself show that education is well funded, efficient or high quality.
The median of 171 latest values is 94.18%, but the years differ
If all 171 latest available values are summarized together, the median is 94.18% and the simple mean is 91.20%. A total of 119 economies report 90% or more, 77 report at least 95%, and 14 report exactly 100%. These figures show that current expenditure makes up most direct public-secondary spending in many economies.
However, that pooled median is descriptive rather than a strict same-year benchmark. Financing structures can change with construction cycles, reforms and accounting practices. For cleaner country comparisons, the 2024, 2023 and 2022 groups below are kept separate instead of mixing their values into one league table.
| Latest observation year | Economies |
|---|---|
| 2024 | 18 |
| 2023 | 22 |
| 2022 | 40 |
| 2021 | 13 |
| 2020 or earlier | 78 |
The 2024 group has a median current-spending share of 93.42%
Among the 18 economies with a 2024 observation, the median is 93.42% and the simple mean is 88.80%. Honduras reports 100%, Ecuador 99.97%, Jamaica 98.92% and Togo 98.78%. At the lower end of this small 2024 group, Monaco reports 43.38%, Peru 74.97% and Rwanda 79.00%.
| Economy | 2024 current-expenditure share |
|---|---|
| Honduras | 100.00% |
| Ecuador | 99.97% |
| Jamaica | 98.92% |
| Togo | 98.78% |
| Paraguay | 97.00% |
| Monaco | 43.38% |
| Peru | 74.97% |
| Rwanda | 79.00% |
| El Salvador | 81.76% |
| Cote d’Ivoire | 83.02% |
The 2024 group is too small to represent a complete world ranking. A low share can be consistent with a relatively large capital component in direct expenditure during that year, but the indicator does not identify the project or policy behind the difference. Country-level budget documents would be needed to determine whether construction, renovation, equipment purchases or classification changes were important.
High current-spending shares are also common in the 2023 and 2022 groups
The 22 observations from 2023 have a median of 95.80% and a mean of 93.32%. The Cayman Islands and British Virgin Islands report 100%, Turkmenistan 99.90% and San Marino 99.84%. Nicaragua is at 67.34%, Albania at 79.47% and China at 83.08% within the same-year group.
The largest same-year cluster among the latest observations is 2022, with 40 economies. Its median is 93.09% and its mean is 92.01%. The Marshall Islands reports 100% and Greece 99.04%, while Turks and Caicos Islands is at 75.25% and Sierra Leone at 80.82%. Separating the years helps prevent apparent map differences from being mistaken for contemporaneous differences.
| Same-year group | Economies | Median | Mean |
|---|---|---|---|
| 2024 | 18 | 93.42% | 88.80% |
| 2023 | 22 | 95.80% | 93.32% |
| 2022 | 40 | 93.09% | 92.01% |
A lower share does not mean that a country invests less in education
This indicator measures a composition, not the size of the budget. A year with major school construction or equipment purchases can produce a lower current-expenditure share even when total education spending rises. Conversely, a 98% current share says nothing about whether overall spending per student is high or low. The ratio should therefore not be used as a score of education quality or fiscal commitment.
Useful companion measures include public education spending per student, spending as a share of GDP or government expenditure, enrollment, staff compensation and capital expenditure. The World Bank series used here combines staff compensation and other current costs in a single percentage, so it cannot show which recurring component explains a high value.
Three checks before comparing the map
- The color represents current expenditure as a share of direct spending in public secondary institutions, not a share of the national education budget.
- The 171 latest observations span 2001–2024, so the observation year must be checked before making a country-to-country comparison.
- A lower share may reflect a larger capital component in that year, but the cause cannot be determined from this indicator alone.
Source: World Bank, SE.XPD.CSEC.ZS. The World Bank defines the series as current expenditure expressed as a percentage of direct expenditure in public secondary educational institutions, excluding financial aid to students and other transfers from direct expenditure.
Frequently Asked Questions
What does a 100% current-expenditure share mean?
It means that nearly all direct expenditure in public secondary institutions was classified as current expenditure in that reported year. It does not mean that total education funding is sufficient or that education quality is high.
Why are countries not all compared using 2024 data?
The 171 latest observations span 2001–2024 and only 18 are from 2024. The map uses the latest available observation, while same-year summaries are kept separate.
Does a lower current-expenditure share mean lower education investment?
No. The ratio describes the composition of direct expenditure. A year with larger capital spending on buildings or equipment can have a lower current share even when total spending is substantial.
Related Articles
Green Map creates custom-edited map images using open geographic data sources such as geoBoundaries, Natural Earth, OpenStreetMap, and government open data.
These maps are edited visual materials, not raw data files, and are provided for education, documents, presentations, and graphic reference.