Government-financed health spending from domestic sources varied enormously across reporting economies in 2023. World Bank indicator SH.XPD.GHED.PP.CD expresses domestic general government health expenditure on a per-person basis in current international dollars at purchasing power parity (PPP). Of 217 source rows, 192 have a reported 2023 value and 25 are source-missing.
This is not a measure of total medical bills or the amount households paid out of pocket. It focuses on government health spending financed from domestic public sources and then converts that spending into a PPP-adjusted per-capita unit. It is useful for comparing the scale of public health financing, but a larger number does not by itself prove that care is more efficient, more accessible, or produces better health outcomes.
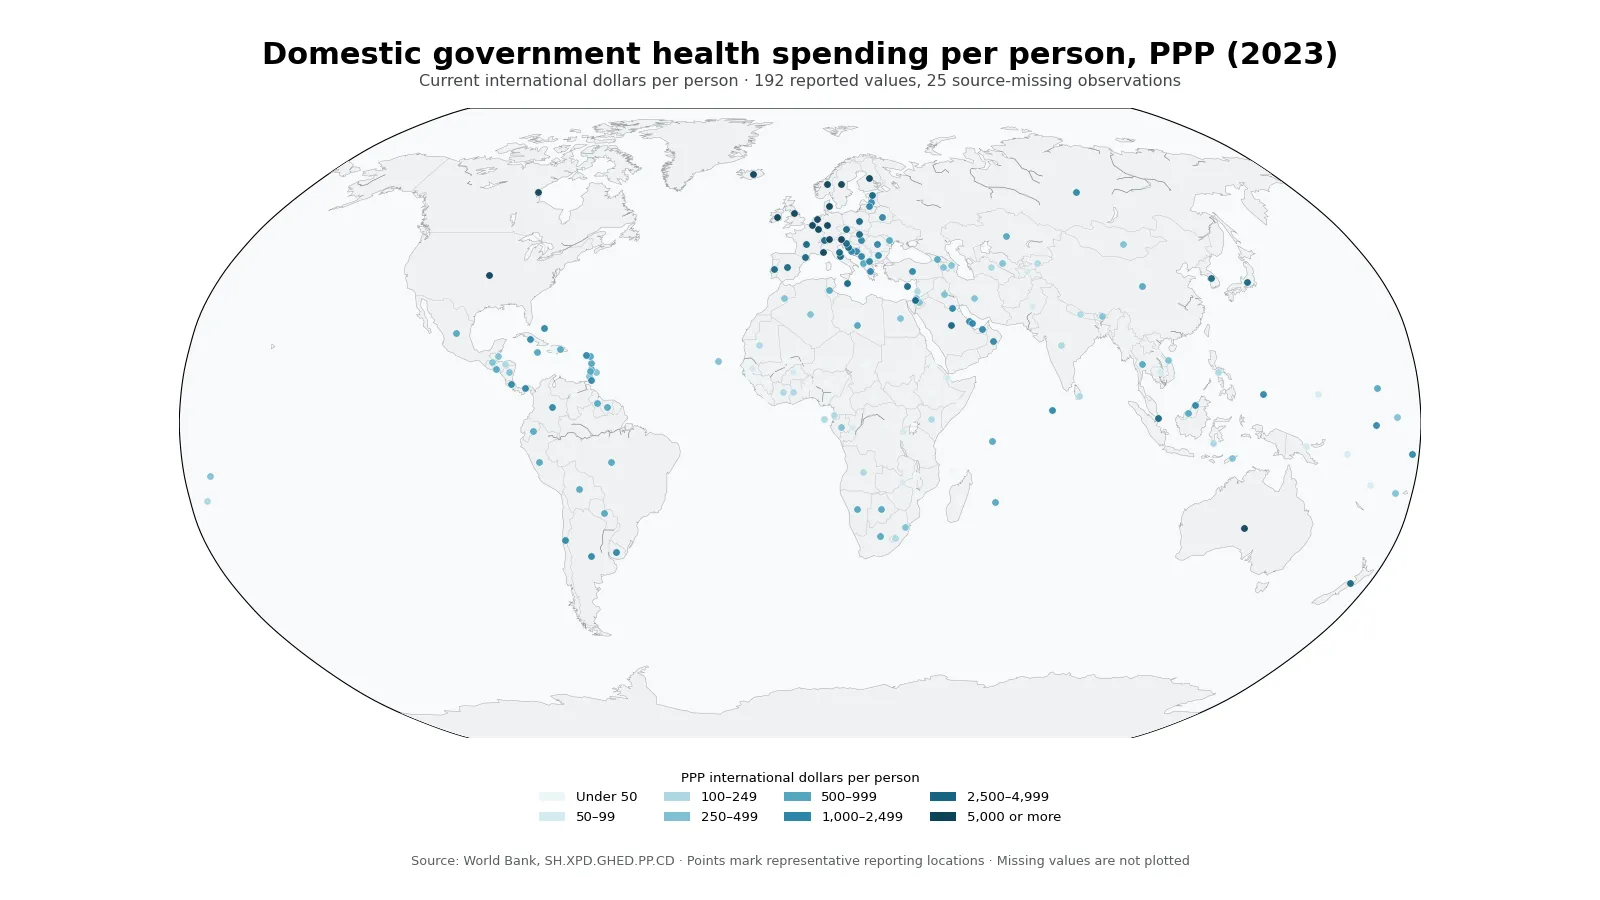
Table of Contents
Monaco and Norway exceeded 8,000 international dollars per person
Among the 192 reported observations, Monaco had the highest value at 8,391.42 international dollars per person, followed by Norway at 8,200.15. The United States recorded 7,269.29, Luxembourg 7,213.66, and Liechtenstein 6,763.04. Germany, Sweden, Ireland, Austria and Denmark also appear in the top ten.
Many of the highest observations are in Western and Northern Europe, but the ranking should be read as a financing comparison rather than a health-system scorecard. Population size, tax capacity, public insurance coverage, provider prices, wage levels and the boundary between public and private financing can all differ substantially. High spending can reflect generous coverage, high input costs, older populations or several factors at the same time.
| High rank | Economy | PPP intl. $ per person | Low rank | Economy | PPP intl. $ per person |
|---|---|---|---|---|---|
| 1 | Monaco | 8,391.42 | 1 | Afghanistan | 5.45 |
| 2 | Norway | 8,200.15 | 2 | Sudan | 5.86 |
| 3 | United States | 7,269.29 | 3 | South Sudan | 6.82 |
| 4 | Luxembourg | 7,213.66 | 4 | Somalia, Fed. Rep. | 7.38 |
| 5 | Liechtenstein | 6,763.04 | 5 | Haiti | 9.78 |
| 6 | Germany | 6,571.64 | 6 | Congo, Dem. Rep. | 10.81 |
| 7 | Sweden | 6,466.52 | 7 | Yemen, Rep. | 14.25 |
| 8 | Ireland | 6,333.61 | 8 | Burundi | 14.75 |
| 9 | Austria | 6,031.21 | 9 | Malawi | 16.07 |
| 10 | Denmark | 5,911.15 | 10 | Madagascar | 18.11 |
The bottom of the distribution falls to around 20 international dollars or less
Afghanistan recorded 5.45, Sudan 5.86, South Sudan 6.82, and Somalia 7.38 international dollars per person. Haiti was at 9.78 and the Democratic Republic of the Congo at 10.81. These values are far below the global median of the reported observations.
The indicator alone cannot identify why a country is low. Domestic public revenue, budget capacity, the size of the formal economy, reliance on external health assistance, population structure and the supply of health services may all matter. Because the measure is specifically about domestically financed government spending, it may also differ materially from the total resources available to health systems that receive substantial external funding.
A median of 613.58 and a mean of 1,417.11 show a strongly right-skewed distribution
The median across the 192 reported values is 613.58 international dollars per person, while the mean is 1,417.11. The first quartile is 101.16 and the third quartile is 1,991.42. In other words, the middle half of reporting economies lies roughly between 101 and 1,991 international dollars. The mean is more than twice the median because a relatively small group of very high-spending economies pulls the average upward.
| PPP international dollars per person | Observations | Share of 192 |
|---|---|---|
| Under 50 | 35 | 18.2% |
| 50–99 | 13 | 6.8% |
| 100–249 | 18 | 9.4% |
| 250–499 | 25 | 13.0% |
| 500–999 | 30 | 15.6% |
| 1,000–2,499 | 33 | 17.2% |
| 2,500–4,999 | 21 | 10.9% |
| 5,000 or more | 17 | 8.9% |
35 observations, or 18.2% of the reported set, are below 50 international dollars per person. At the other end, 17 are at 5,000 or more. The two middle bands from 500 through 2,499 contain 63 observations. The darkest map points are visually prominent, but much of the global reporting universe sits well below the top-income cluster.
Western and Northern Europe form a clear high-spending cluster, with meaningful differences inside it
Germany recorded 6,571.64 international dollars per person, the United Kingdom 5,204.64, France 4,549.73, Spain 3,611.58, and Italy 3,555.89. These are all far above the reported global median, yet there is still substantial variation within Europe. The map therefore shows both a regional high-spending cluster and important differences among neighboring systems.
North America also illustrates that geographic proximity does not guarantee similar public spending levels. The United States stood at 7,269.29, Canada at 5,171.55, and Mexico at 665.21 international dollars per person. The values describe domestic government financing intensity after PPP adjustment, not the total size or quality of each health system.
Asia spans from several thousand international dollars to low hundreds
Japan recorded 4,550.95, Singapore 3,829.90, South Korea 2,810.79, China 848.98, and India 135.12 international dollars per person. These examples underline how wide the financing range can be even within one broad region.
The Gulf also shows internal variation: the United Arab Emirates recorded 2,488.95, Saudi Arabia 2,702.44, Qatar 2,408.11, Kuwait 2,272.90, and Oman 1,232.64. Income level matters for fiscal capacity, but the public-private financing mix and policy choices determine how much of that capacity appears as domestic government health spending.
PPP international dollars adjust for purchasing power rather than market exchange rates
A current international dollar is not the same as a US dollar converted at the market exchange rate. PPP conversion is designed to account for differences in price levels so that a unit represents broadly comparable purchasing power across economies. This matters in health because wages, services and locally purchased inputs can cost very different amounts across countries.
PPP does not make health systems identical. It does not directly adjust for differences in quality, benefit packages, access, technology or the geographic distribution of providers. A country that spends 1,000 international dollars may organize and deliver care very differently from another country at the same level. The measure is therefore a useful financing benchmark, not a complete indicator of health-system performance.
Government spending is different from household out-of-pocket spending
A high government-spending figure does not automatically mean households face low medical bills. Some systems combine substantial public spending with significant private insurance or out-of-pocket payments, while others organize financing differently. To assess household financial burden, out-of-pocket spending per capita or out-of-pocket spending as a share of current health expenditure should be examined separately.
This indicator is also not the share of government budgets devoted to health and not health spending as a percentage of GDP. It uses population as the denominator. Questions about fiscal priority require a government-expenditure denominator, while questions about spending relative to the economy require a GDP denominator. The numerator may be related, but the interpretation changes when the denominator changes.
The 25 missing observations are not zero
Of the 217 source rows, 25 have no reported 2023 value. They are excluded from the rankings, mean, median, quartiles and distribution bands, and they are not plotted. Missing data do not mean a government spent zero, so zero-filling would distort both the low end of the distribution and the summary statistics.
The map uses representative points for all 192 reported observations, including small economies and territories that can disappear on area-based maps. Point size does not encode spending or population; only the color band represents the PPP per-capita spending level.
Source and calculation method
This analysis uses the 2023 observations from World Bank indicator SH.XPD.GHED.PP.CD. The indicator expresses domestic general government health expenditure per person in current international dollars at PPP. The reporting universe includes countries and separately reported economies, so the observation count is not a sovereign-state count.
Maximums, minimums, rankings, mean, median, quartiles and band counts were calculated directly from the 192 non-missing 2023 observations. No values from other years were mixed into the comparison, and missing values were neither estimated nor replaced with zero.
Frequently Asked Questions
What does this government health-spending indicator measure?
It measures domestically financed general government health expenditure per person, expressed in current international dollars at PPP. It is not total health spending or household out-of-pocket spending.
Is a PPP current international dollar the same as a US dollar?
No. It is a purchasing-power-adjusted comparison unit rather than a market-exchange-rate conversion, helping account for differences in price levels across economies.
Does higher government health spending per person mean better health care?
Not necessarily. Spending is one financing measure. Efficiency, access, service coverage, quality and health outcomes require additional indicators.
Were the 25 missing 2023 observations treated as zero?
No. They are source-missing values and are excluded from rankings and summary statistics, and they are not plotted on the map.
Related Maps
Green Map creates custom-edited map images using open geographic data sources such as geoBoundaries, Natural Earth, OpenStreetMap, and government open data.
These maps are edited visual materials, not raw data files, and are provided for education, documents, presentations, and graphic reference.