Rural population in 2025 varies enormously across countries and economies. In the World Bank World Development Indicators series SP.RUR.TOTL, India has the largest value at about 941.4 million people, followed by China at about 473.4 million and Pakistan at about 154.3 million. Bangladesh and Indonesia are also above 100 million. These figures measure the absolute number of people living in areas classified as rural, not the rural share of the national population, so large-population countries can rank highly even when a substantial share of their residents live in cities.
The 2025 comparison contains 217 country and territory rows and all 217 have numeric values. There are no missing observations in this year. Twelve rows are recorded as zero. A reported zero is not the same as a missing value, so those observations remain zero rather than being treated as unavailable or filled with another number. The map and tables use the source values as reported.
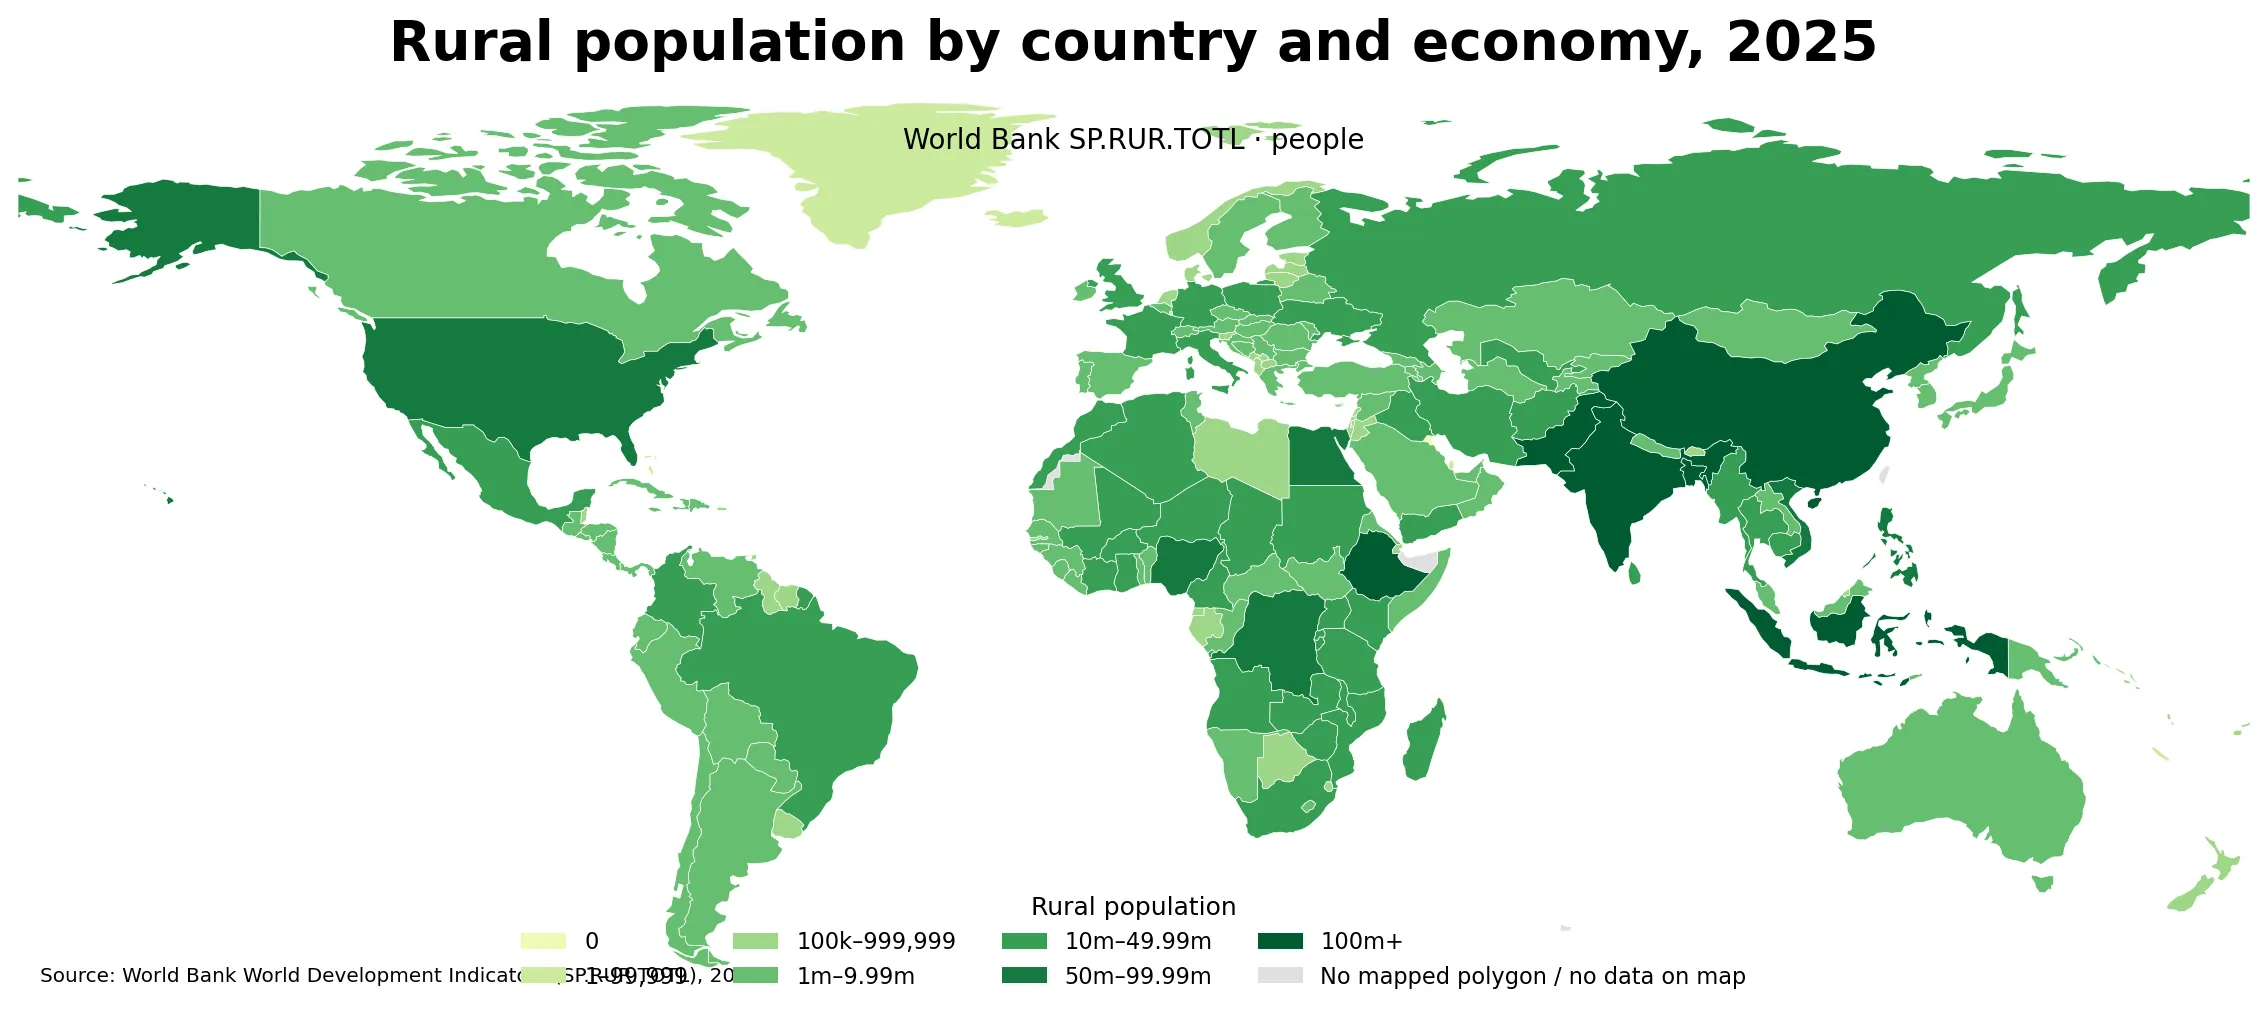
Table of Contents
What the rural population indicator measures
The World Bank describes rural population as people living in rural areas according to national statistical definitions. The series is calculated as the difference between total population and urban population. This is an important qualification for international comparisons: there is no single settlement-size threshold that makes every country’s rural category identical. National statistical systems differ in how they classify settlements, administrative areas, density, infrastructure and other characteristics. The indicator is therefore useful for broad cross-country comparison, but small differences between countries should not be interpreted as if every national definition were perfectly harmonized.
The measure answers a simple but important question: how many people live in places classified as rural? It does not directly answer what share of a country is rural. A country with 50 million rural residents can have a lower rural share than a country with 10 million rural residents if its total population is much larger. Absolute counts are especially useful when the question concerns the scale of potential demand for roads, health services, schools, electricity, connectivity or other services in rural areas. Rural shares are more useful when the question concerns settlement structure or the balance between urban and rural residence.
How wide is the 2025 distribution
Across the 217 observations, the median rural population is about 1.64 million. The first quartile is about 0.21 million and the third quartile about 9.73 million. That means the middle half of the observations falls roughly between those two values. India’s 941.4 million is hundreds of times the median, showing how strongly the distribution is stretched by a relatively small number of very large countries.
Six countries have at least 100 million rural residents, 12 have at least 50 million, and 53 have at least 10 million. A total of 128 observations are at or above one million, while 89 are below one million. This is a highly uneven distribution. Many countries and territories have comparatively small rural populations, while a limited number of populous countries account for extremely large absolute counts. That is why the map uses broad grouped bands instead of a single linear scale.
Countries with the largest rural populations
India has the largest 2025 rural population at 941,424,277. China follows at 473,414,440 and Pakistan at 154,342,491. Bangladesh has 117,289,303, Indonesia 116,023,090 and Ethiopia 102,810,152. Nigeria is next at 86,043,446, followed by the United States at 67,700,152, Egypt at 67,581,869 and Viet Nam at 62,147,904.
| Country or territory | Rural population, 2025 |
|---|---|
| India | 941.4 million |
| China | 473.4 million |
| Pakistan | 154.3 million |
| Bangladesh | 117.3 million |
| Indonesia | 116.0 million |
| Ethiopia | 102.8 million |
| Nigeria | 86.0 million |
| United States | 67.7 million |
| Egypt, Arab Rep. | 67.6 million |
| Viet Nam | 62.1 million |
These rankings should not be read as rankings of agricultural employment or farm output. Rural residents can work in manufacturing, services, mining, tourism, public administration and many other activities, and urban residents can also participate in agriculture-related industries. The indicator is about residence classification, not occupation. Treating rural population as if it were the agricultural workforce would therefore turn a population statistic into a different concept.
Why absolute counts need context
Absolute rural population is highly sensitive to total population size. India and China can remain near the top of the ranking even after decades of urban growth because their overall populations are so large. A smaller country may have a much higher rural share but still appear low in the absolute-count ranking. The phrase “large rural population” should therefore be understood literally as a large number of people, not as a judgment that a country is more rural in its economic structure or stage of urbanization.
The same count can also have very different practical implications depending on geography. Ten million rural residents spread across a very large territory create different transport and service-delivery challenges from ten million residents concentrated in a relatively compact area. Country-level totals do not show within-country density, remoteness, travel times or the location of settlements. Those questions require more detailed population grids, subnational statistics or infrastructure data.
Reported zeros are not missing observations
Twelve 2025 observations are recorded as zero: Bahrain, Bermuda, Cayman Islands, Gibraltar, Hong Kong SAR, China, Kuwait, Macao SAR, China, St. Martin (French part), Monaco, Naoero, Singapore, Sint Maarten (Dutch part). These entries are numeric zeros in the indicator, not blank records. They are therefore retained as zero in the comparison. A zero in this series should not be read as saying the place has no population at all; it means the rural-population indicator for that place is reported as zero.
Small islands and territories also create a visual limitation at global scale. Some have valid statistical values but are too small to appear clearly as separate polygons on a world map. The absence of a visible colored shape is therefore not evidence that the statistical row is missing. The map is best used for broad spatial patterns, while the country-level data are the better reference for small territories.
Rural population count and rural population share answer different questions
The count tells you how many people live in rural areas. The share tells you what percentage of the total population lives in rural areas. A large country can have a moderate rural share and still contain tens or hundreds of millions of rural residents. A small country can have a high rural share but only a few hundred thousand rural residents. The rankings produced by these two indicators can therefore look very different.
For service planning or market sizing, absolute population can be the more useful starting point because it describes the number of people potentially affected. For comparisons of urbanization or settlement structure, the rural share can be more informative. Using both measures avoids a common mistake: treating a large count as if it automatically meant a high share, or treating a high share as if it automatically meant a large population.
What the map reveals at a glance
The darkest bands appear in several of the world’s most populous countries. India exceeds 900 million rural residents and China exceeds 400 million. Pakistan, Bangladesh, Indonesia and Ethiopia are above 100 million. Nigeria, Egypt, Viet Nam, the Democratic Republic of the Congo and the Philippines are above 50 million. These large values help explain why broad parts of South Asia, East and Southeast Asia, and parts of Africa stand out on an absolute-count map.
Many European countries and small island economies fall into lower bands. That does not mean rural areas are unimportant there. A country with a small population can have a relatively small rural count even if rural communities occupy much of its territory or account for a substantial share of residents. The map is deliberately about population size, not about rurality as a social or geographic characteristic.
Why a single-year 2025 comparison is useful
All 217 observations in this comparison refer to 2025, so the map does not mix countries from different observation years. This makes the timing of the comparison clear and avoids a problem common in ‘latest available’ datasets, where some countries may be represented by much older observations. A common year does not eliminate differences in national definitions, but it does make the date dimension consistent.
A single year, however, cannot show direction of change. It cannot tell whether a country’s rural population is rising or falling, whether the pace of change is accelerating, or how quickly urbanization is proceeding. Those questions require a time series or a growth-rate indicator. The related rural population growth article focuses on change, while this article focuses on the 2025 level.
What this indicator can and cannot tell you
The data can show which countries have the largest rural populations, how wide the distribution is, and which broad count band each country occupies. It can also provide context for other development indicators by showing the size of the rural population potentially affected. For example, a high percentage of rural electricity access can still leave a large absolute number of people without access in a country with a very large rural population.
The indicator cannot by itself describe income, poverty, agricultural employment, internet use, education, health access, road connectivity or the quality of public services. Nor does it describe how rural residents are distributed within a country. Those are separate dimensions that need separate indicators. Rural population is best understood as a baseline scale measure rather than a complete description of rural living conditions.
How to read the map without overinterpreting it
First, darker categories mean larger absolute rural populations, not higher rural shares. Second, the 12 reported zeros are actual numeric values, not missing records. Third, small territories may be hard to see at world scale even when they have a data value. Fourth, the distribution is strongly skewed, so the median is often more informative than the mean for understanding a typical observation. Fifth, country definitions of rural areas are not perfectly identical.
The most striking feature of the 2025 distribution is the enormous gap between the largest countries and the middle of the table. India alone is above 900 million while the median across 217 observations is about 1.64 million. This makes rural population a useful example of why global country comparisons need both maps and distribution statistics. The map shows where the large counts are located, while the median, quartiles and threshold counts show how unusual the very largest observations actually are.
Frequently Asked Questions
Which country has the largest rural population in 2025?
India has the largest value in the World Bank SP.RUR.TOTL data at 941,424,277 people, followed by China and Pakistan.
Does a large rural population mean a high rural population share?
Not necessarily. This indicator measures the absolute number of rural residents. A very populous country can have a large rural count even when its rural share is moderate.
Are there missing values in the 2025 comparison?
No. All 217 country and territory rows have numeric values for 2025. Twelve rows are reported as zero, which is different from a missing observation.
Related Articles
Green Map creates custom-edited map images using open geographic data sources such as geoBoundaries, Natural Earth, OpenStreetMap, and government open data.
These maps are edited visual materials, not raw data files, and are provided for education, documents, presentations, and graphic reference.