Men ages 30–34 make up very different shares of the male population across countries and economies in 2025. Among 217 observations for World Bank indicator SP.POP.3034.MA.5Y, the United Arab Emirates has the highest value at 17.16%, while the Marshall Islands has the lowest at 3.50%. The median is 7.20%. At the top end, nearly one in six males is in this five-year age band; at the bottom, the share is closer to one in thirty.
The denominator is the total male population, not the total population. A value of 8% means that about 8 of every 100 males are ages 30–34. Women are not part of the denominator, and men ages 25–29 or 35–39 are not part of the numerator. The indicator therefore measures the relative thickness of one male age cohort rather than the headcount of men in their early thirties.
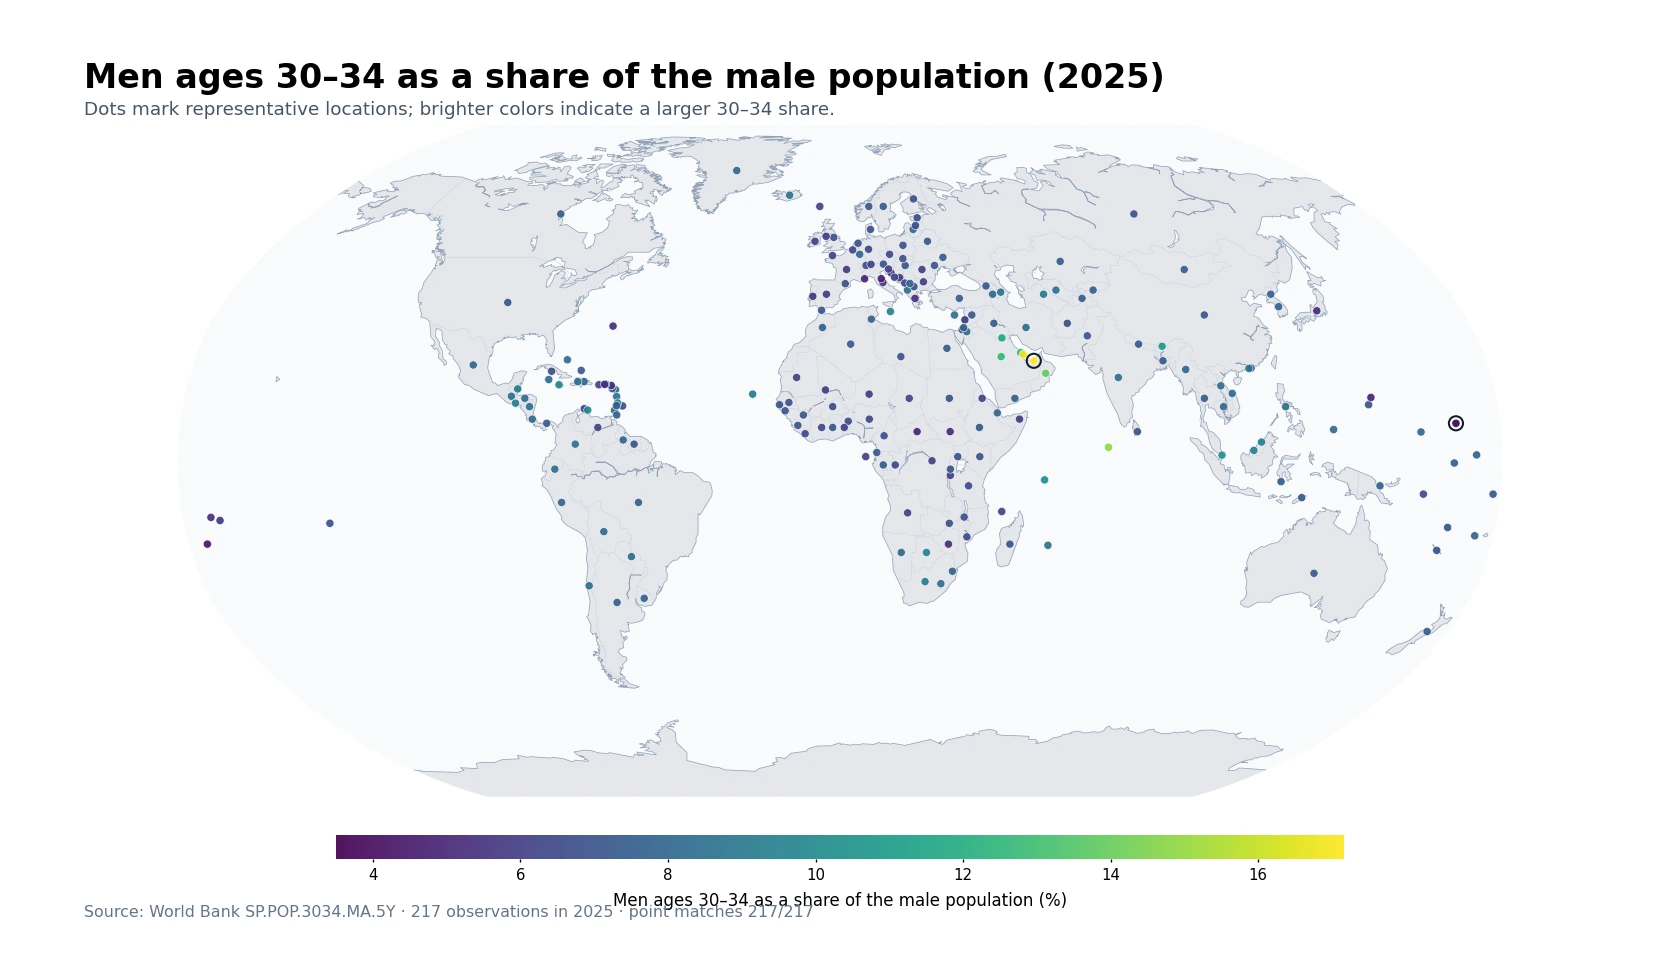
Table of Contents
The clearest high-share cluster is in the Gulf
The upper end is strongly concentrated in the Gulf. The United Arab Emirates leads at 17.16%, followed by Qatar at 16.78%, Oman at 13.80%, Bahrain at 12.93%, Saudi Arabia at 12.61%, and Kuwait at 11.53%. Having several neighboring economies in the top ten creates a pronounced regional pattern rather than a single isolated outlier.
This indicator alone cannot determine why the cluster exists. The share of men ages 30–34 is shaped by past cohort size, survival, age-selective migration, and the size of other male age groups in the denominator. Working-age male migration can materially alter age composition in some economies, but separating migration from birth-cohort effects requires age- and sex-specific migration data and absolute population counts.
Maldives, Bhutan, Singapore, and Seychelles broaden the upper group
High values are not confined to the Gulf. Maldives records 14.91%, Bhutan 10.70%, Singapore 10.53%, and Seychelles 10.16%, placing all four in the top ten. These economies differ greatly in population size, migration patterns, and geography, which is a reminder that similar percentages do not necessarily reflect the same demographic process.
A composition percentage also does not show the actual number of men ages 30–34. A small economy with a 12% share can have far fewer men in this age group than a large country with a 7% share. Questions about labor-market capacity, housing demand, or household formation therefore require age-specific headcounts in addition to this ratio.
The bottom group mixes island economies, older populations, and very young populations
At the low end, the Marshall Islands records 3.50%, the French part of St. Martin 3.63%, Tonga 4.16%, San Marino 4.75%, Monaco 4.82%, and the Northern Mariana Islands 4.84%. The Central African Republic is at 4.92%, Japan 5.14%, South Sudan 5.15%, and the U.S. Virgin Islands 5.18%.
Those places do not share one demographic profile. In Japan, a large older population can reduce the relative weight of men in their early thirties. In the Central African Republic and South Sudan, much younger age groups can occupy a large part of the population structure, also leaving a smaller share for ages 30–34. Small islands and territories can be especially sensitive to migration and a small denominator. The low percentage is an outcome to be explained with additional data, not a diagnosis by itself.
The full range spans 13.66 percentage points
The gap between the United Arab Emirates at 17.16% and the Marshall Islands at 3.50% is 13.66 percentage points. The maximum is about 4.9 times the minimum. That range shows how differently one five-year male cohort can fit into the broader male age structure across reporting economies.
| Top rank | Country or economy | Share | Bottom rank | Country or economy | Share |
|---|---|---|---|---|---|
| 1 | United Arab Emirates | 17.16% | 1 | Marshall Islands | 3.50% |
| 2 | Qatar | 16.78% | 2 | St. Martin (French part) | 3.63% |
| 3 | Maldives | 14.91% | 3 | Tonga | 4.16% |
| 4 | Oman | 13.80% | 4 | San Marino | 4.75% |
| 5 | Bahrain | 12.93% | 5 | Monaco | 4.82% |
| 6 | Saudi Arabia | 12.61% | 6 | Northern Mariana Islands | 4.84% |
| 7 | Kuwait | 11.53% | 7 | Central African Republic | 4.92% |
| 8 | Bhutan | 10.70% | 8 | Japan | 5.14% |
| 9 | Singapore | 10.53% | 9 | South Sudan | 5.15% |
| 10 | Seychelles | 10.16% | 10 | Virgin Islands (U.S.) | 5.18% |
The table is not a ranking of absolute population. A large country can have many more men ages 30–34 even if its percentage is near the middle of the distribution. Likewise, a small economy can rank very high on share while containing a modest number of people in the age band. Population counts are essential when the question is service demand or market size rather than demographic composition.
Most observations sit between 5% and 9%
Across all 217 observations, the mean is 7.41% and the median is 7.20%. The first quartile is 6.45% and the third quartile is 8.01%, so the middle half lies between about 6.45% and 8.01%. The mean is slightly above the median because the small group above 11% stretches the upper tail.
| Share band | Countries and economies |
|---|---|
| Below 5% | 7 |
| 5% to <7% | 81 |
| 7% to <9% | 108 |
| 9% to <11% | 14 |
| 11% or more | 7 |
There are 7 observations below 5%, 81 from 5% to under 7%, 108 from 7% to under 9%, 14 from 9% to under 11%, and 7 at 11% or more. The 7% to under 9% band contains 108 observations, making it the most common range, while only 7 observations reach 11% or more.
Being a working-age cohort does not make this an employment indicator
Ages 30–34 are often associated with active labor-force participation, but this population share is not an employment rate, unemployment rate, or labor-force participation rate. It only tells us how much of the male population falls in this age band. A country with a large 30–34 share does not necessarily have high employment among men of that age, and a low share does not by itself imply a shortage of workers.
Labor-market interpretation requires separate evidence: employment status, participation, occupation, industry, earnings, and migration composition. The age-structure measure is best used as demographic context that helps explain the size of the potential population in a given age band, not as a score of economic performance.
A single year cannot establish whether the cohort is expanding or contracting
The 2025 map is a cross-section. Over time, the current 25–29 cohort ages into 30–34, while the current 30–34 cohort moves into 35–39. Rankings can therefore change even without dramatic demographic shocks. A country that is high in 2025 is not guaranteed to remain high several years later.
Trend analysis requires multiple years of the same series and should separate numerator and denominator effects. The number of men ages 30–34 can rise while their percentage falls if the rest of the male population grows faster. The percentage can also increase despite a smaller headcount if other male age groups shrink more rapidly.
All 217 observations are retained even when map points overlap
The World Bank country-and-economy series includes sovereign states as well as separately reported territories and economies. The count of 217 should therefore not be interpreted as the number of sovereign countries in the world. The rankings, quartiles, mean, median, range, and distribution bands use all 217 rows supplied for 2025.
For the map, each observation is linked to a representative geographic point, and 217 of 217 observations are successfully matched. Small islands and densely packed territories can overlap at world scale, so the table and numerical summaries are the better way to read exact values. Map visibility does not determine whether an observation is included in the calculations.
Data source and calculation
The analysis uses the 2025 observations from the World Bank API series SP.POP.3034.MA.5Y. The World Bank indicator page provides the official series definition and time series. The unit is men ages 30–34 as a percentage of the total male population.
Regional and income-group aggregates are excluded, leaving country-and-economy rows. All 217 rows contain a 2025 value, so no missing value is replaced with zero and no earlier observation is substituted. The maximum, minimum, rankings, mean, median, quartiles, range, and distribution counts are calculated directly from those same 217 values.
Frequently Asked Questions
What does an 8% share for men ages 30–34 mean?
It means that about 8 of every 100 males in that country or economy are ages 30–34. It does not mean that 8% of the total population consists of men in this age group.
Does a high 30–34 male share mean employment is high?
No. This indicator describes age composition only. Employment conditions require separate age-specific data on employment, unemployment, labor-force participation, and population counts.
Can the 2025 value show whether the early-thirties cohort is growing?
No. Growth or decline requires multiple years of the same series and, ideally, absolute population counts to separate changes in the age-group numerator from changes in the total male population.
Related Maps
Green Map creates custom-edited map images using open geographic data sources such as geoBoundaries, Natural Earth, OpenStreetMap, and government open data.
These maps are edited visual materials, not raw data files, and are provided for education, documents, presentations, and graphic reference.