This article is built around a specific EIA data identity: annual 2024 `heat-content`, fueltypeid=PET, sectorid=99, and 51 jurisdictions consisting of the 50 states plus the District of Columbia. That identity is deliberately stated first because a nearby EIA series uses the separate petroleum-liquids identifier PEL. The two should not be treated as one dataset just because both can be described loosely as petroleum heat content.
The PET extract has its own numerical fingerprint. The District of Columbia is highest at 6.3000 million Btu per barrel, Michigan is lowest at 4.5115, the median is 5.8081, and the unweighted mean is 5.7955. Thirty-three of 51 observations fall between 5.7 and 5.9. The defining story is therefore a compressed middle, a pronounced Michigan low outlier, and a D.C. observation at the top—not a generic repetition of a petroleum-liquids state ranking.
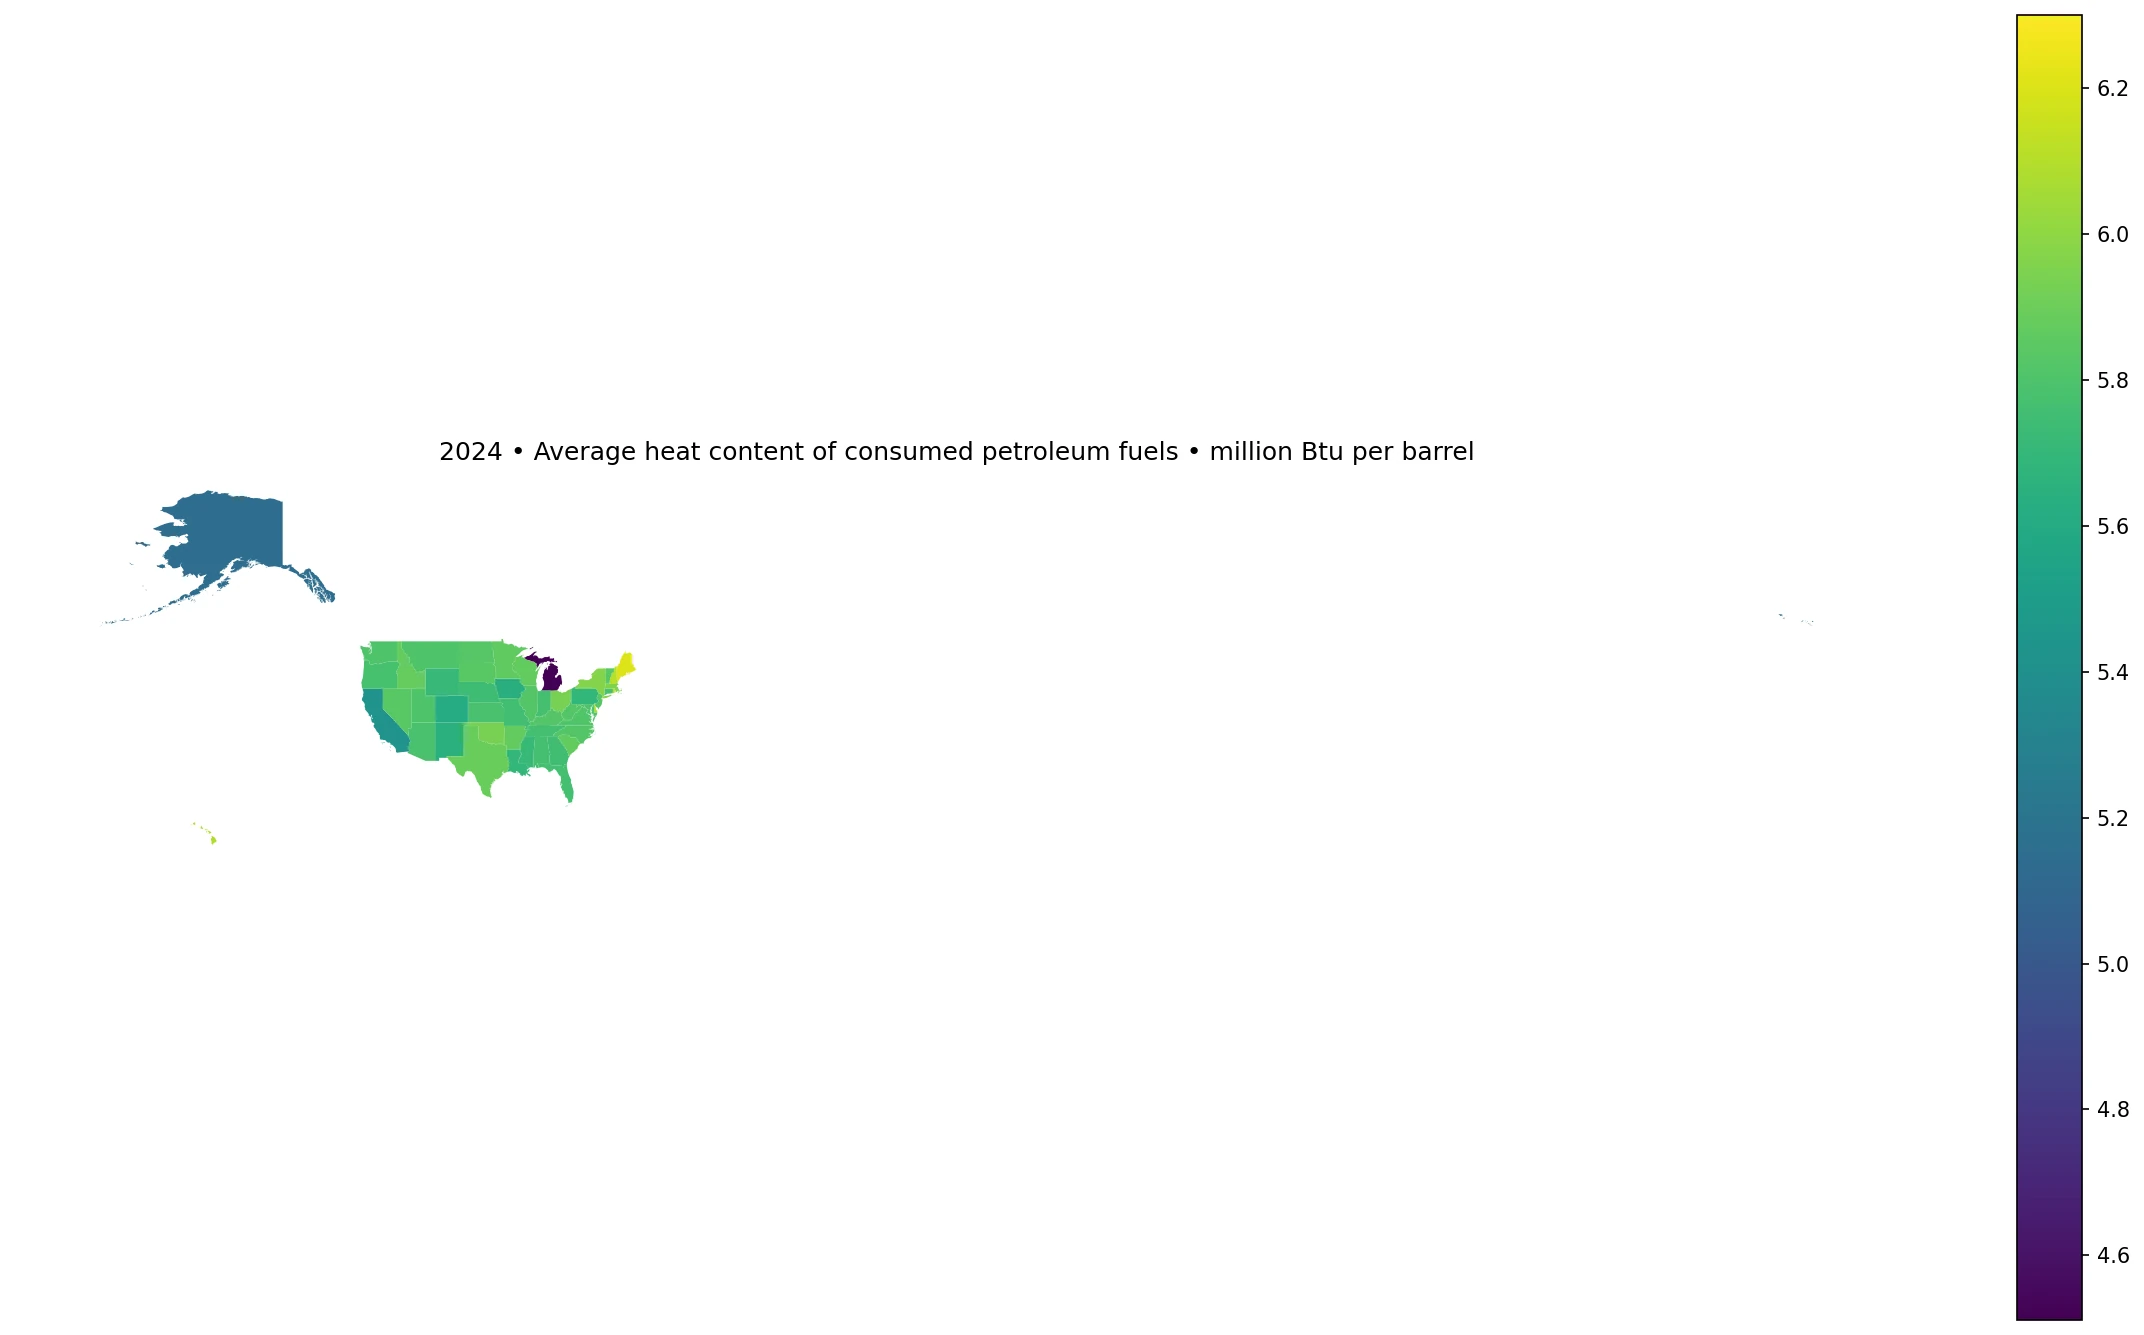
Table of Contents
Identity check: PET and PEL are different EIA fuel facets
When two energy articles have similar titles, the safest duplicate check is to compare the structured fields before comparing prose. This dataset uses PET. EIA also publishes a petroleum-liquids facet identified as PEL. If the fueltypeid changes, the series identity changes even when the year, geography, and heat-content field look similar.
The current extract also has 51 jurisdictions because D.C. is included. Its correct identity key is therefore `2024 + heat-content + PET + sectorid=99 + 51 jurisdictions`. That combination is more precise than a broad phrase such as ‘petroleum heat content by state.’
Michigan at 4.5115 is the clearest PET outlier
Michigan is 1.2966 million Btu per barrel below the median. Alaska, the second-lowest observation, is 5.1413, leaving a 0.6298 gap between the two lowest entries. California is next at 5.4296, after which the lower tail starts moving back toward the central group.
The full distance from Michigan to D.C. is 1.7885 million Btu per barrel. That spread is visually important, but it is not a power-plant efficiency score or a fuel-quality grade. Heat content describes energy per barrel of the petroleum mix represented by the PET series.
D.C. is not just included—it is the maximum
The District of Columbia has an official 2024 value of 6.3000, the highest of all 51 observations. This matters because a 50-state-only extract and a 50-states-plus-D.C. extract do not have the same sample size or necessarily the same maximum.
Geographic coverage is therefore part of the identity. If an article omits D.C., its summary statistics, top ranking, and map coverage can differ even if the metric name otherwise looks close.
Most jurisdictions are tightly compressed between 5.7 and 5.9
The middle of the distribution is unusually tight. 33 of 51 observations are at least 5.7 but below 5.9. Narrow the band to 5.75–5.9 and 30 jurisdictions still remain. The first quartile is 5.7591 and the third quartile is 5.8722, only 0.1130 apart.
Only 6 observations reach 6.0 or more, while only 3 are below 5.5. This makes the central pattern more important than small rank changes among states separated by only a few hundredths of a million Btu per barrel.
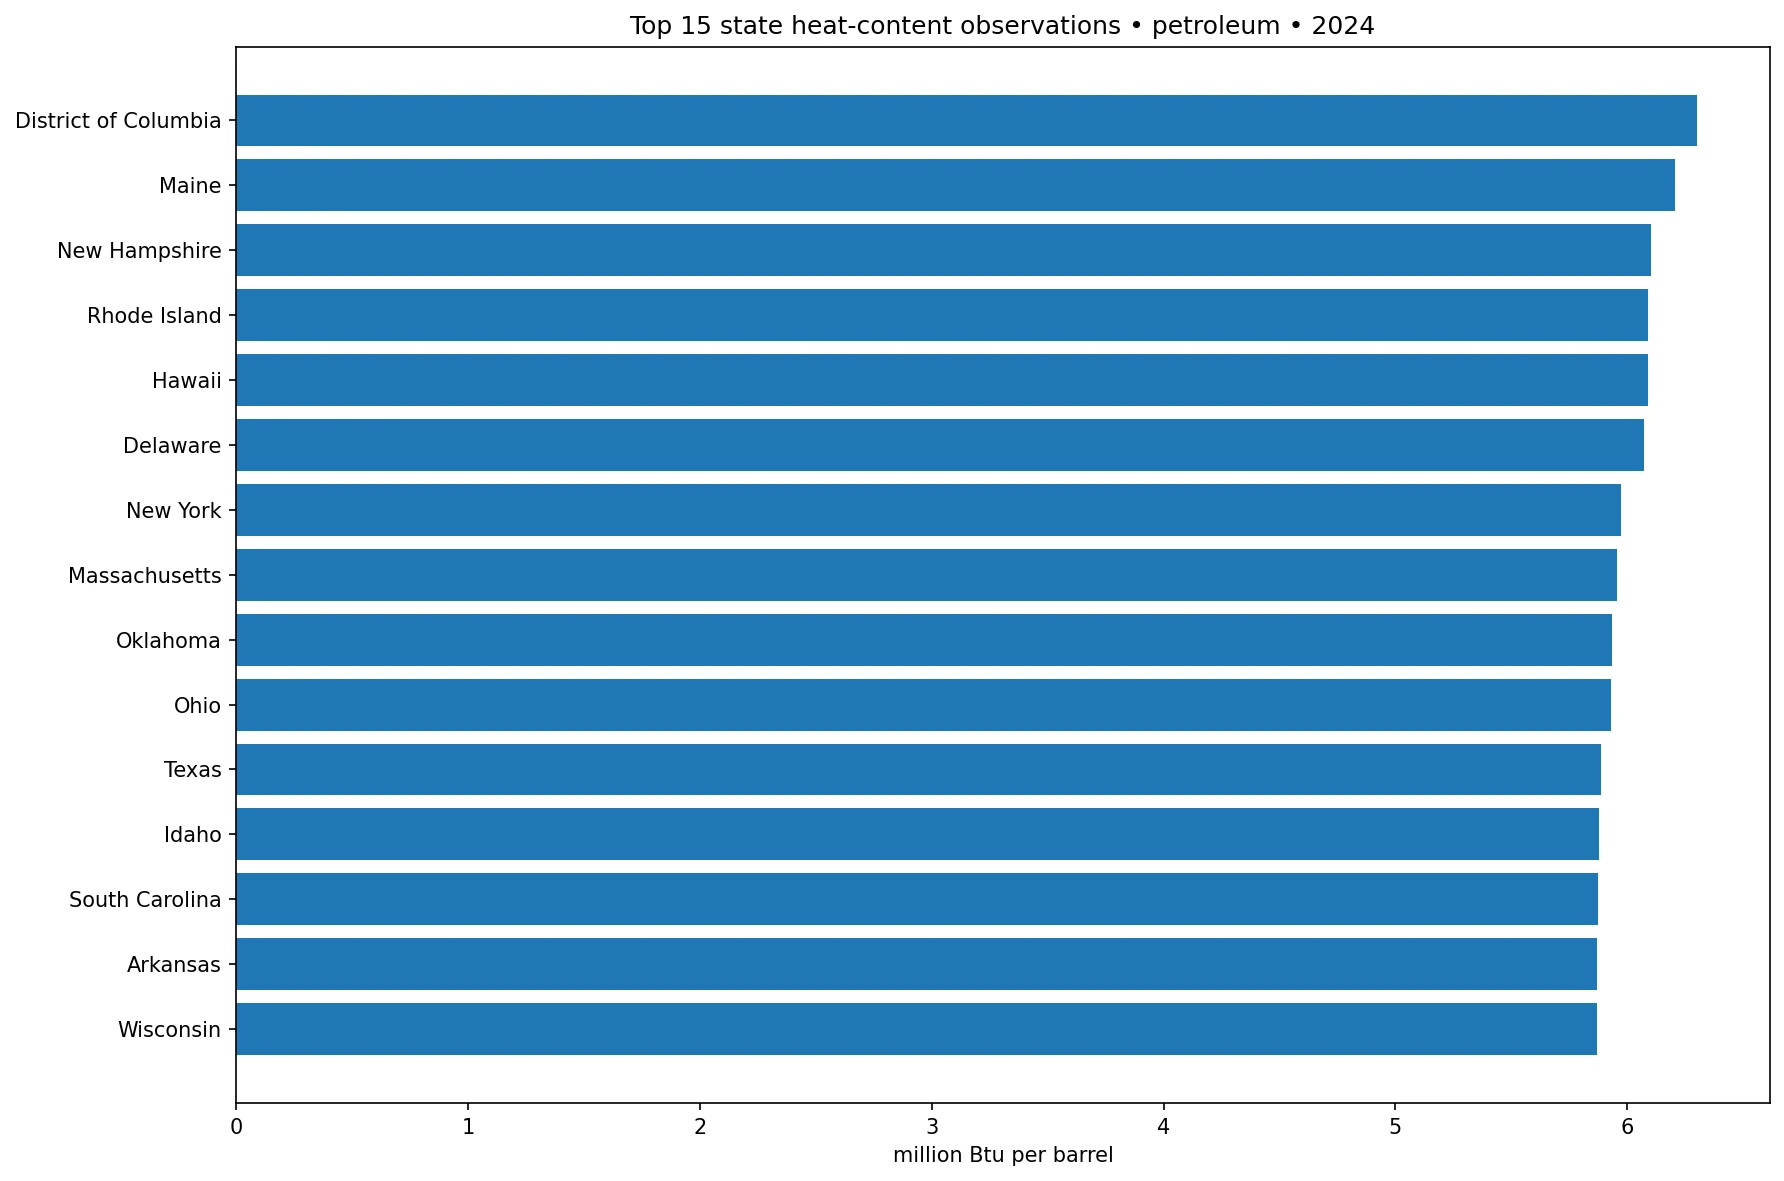
The ten highest PET observations
| State or jurisdiction | PET average heat content (million Btu/barrel) |
|---|---|
| District of Columbia | 6.3000 |
| Maine | 6.2084 |
| New Hampshire | 6.1027 |
| Rhode Island | 6.0919 |
| Hawaii | 6.0881 |
| Delaware | 6.0726 |
| New York | 5.9716 |
| Massachusetts | 5.9554 |
| Oklahoma | 5.9346 |
| Ohio | 5.9307 |
D.C. is followed by Maine at 6.2084, New Hampshire at 6.1027, Rhode Island at 6.0919, Hawaii at 6.0881, and Delaware at 6.0726. Those six are the only values at or above 6.0. New York, Massachusetts, Oklahoma, and Ohio round out the top ten in the upper 5.9 range.
The upper group is geographically mixed. Several Northeast jurisdictions appear, but Hawaii and Oklahoma make a simple regional explanation inadequate. The aggregate PET figure does not identify which petroleum products or plant-level consumption patterns produced each average.
The low end is not a smooth bottom-ten group
| State | PET average heat content (million Btu/barrel) |
|---|---|
| Michigan | 4.5115 |
| Alaska | 5.1413 |
| California | 5.4296 |
| Colorado | 5.6058 |
| Iowa | 5.6409 |
| New Mexico | 5.6442 |
| Pennsylvania | 5.6882 |
| Louisiana | 5.6942 |
| Wyoming | 5.7092 |
| Mississippi | 5.7167 |
Michigan is clearly separated from Alaska and California. Colorado, Iowa, and New Mexico are already above 5.60, and the remaining lower-ranked states are close to the main 5.7–5.9 band. The lower tail is therefore better described as one major outlier, two secondary low observations, and several values approaching the center.
That shape matters because a simple bottom-ten list can make the ten entries look equally unusual. They are not. Michigan carries most of the lower-tail separation.
PET heat content measures energy per barrel, not petroleum volume
A value near 5.8 million Btu per barrel tells us about the energy represented by a barrel on average. It does not tell us how many barrels were consumed. A jurisdiction with a high heat-content factor may have very little petroleum use, while another with a lower factor may consume much more fuel.
Total energy input depends on both quantity and energy content per unit. Electricity generation, fuel cost, and emissions each add another dimension. This series is therefore best treated as a fuel-property dataset rather than a measure of petroleum-use scale.
Why the 51 averages cannot be added
Per-barrel averages are not additive. Adding all 51 values would not create a valid U.S. heat-content total. A meaningful national average would require weighting each jurisdiction by the physical quantity of petroleum represented in the same data definition.
The 5.7955 mean in this article is explicitly an unweighted descriptive mean across states and D.C. It helps characterize the cross-jurisdiction distribution but should not be substituted for a national consumption-weighted EIA factor.
Michigan’s result is an observation, not a causal explanation
The aggregate PET table does not reveal which individual petroleum products drove Michigan’s 4.5115 result. Testing a cause would require product-level physical consumption and heat-content factors under the same 2024 and sector definitions.
That distinction prevents speculation from turning into a factual claim. The verified statement is that Michigan is the minimum in this PET extract. The mechanism behind the minimum remains a follow-up research question.
Five fields prevent accidental merging with related petroleum articles
A reliable identity review should check five items: field, fueltypeid, sectorid, year, and geographic coverage. For this article they are `heat-content`, PET, 99, 2024, and 51 jurisdictions including D.C.
Titles can converge semantically even when one structured identifier differs. Using those five fields first makes it easier to distinguish a true duplicate from a related but valid separate series.
Heat content is not an efficiency or emissions ranking
More energy per barrel is a physical characteristic. Generation efficiency depends on electricity output relative to fuel-energy input. A high PET heat-content value does not prove that plants in that jurisdiction convert fuel into electricity more efficiently.
The same caution applies to carbon emissions. Total emissions depend on fuel quantities and product-specific carbon characteristics. Similar heat-content factors can coexist with very different total petroleum use and emissions.
The 2024 PET view is a snapshot
Every observation in this dataset is from 2024, so the article does not mix reporting years. It still cannot show whether Michigan remains low in other years or whether D.C. consistently appears at the top.
A clean trend analysis would have to hold `heat-content`, PET, sectorid=99, geography, and unit constant over time. Switching to PEL or another sector would create a definition break instead of a pure year-to-year comparison.
Data source and calculation method
The source is the U.S. Energy Information Administration’s Electric Power Operations API. This analysis uses annual 2024 `heat-content` observations with fueltypeid=PET and sectorid=99. Petroleum heat content is interpreted on the million-Btu-per-barrel scale. The dataset contains 51 official observations covering all 50 states and the District of Columbia.
The median, unweighted mean, quartiles, ranking tables, and interval counts are calculated directly from those 51 values. No missing observation is converted to zero. All 51 rows match the state/D.C. boundary layer used in the map.
Frequently Asked Questions
Is this PET dataset the same as EIA’s petroleum-liquids PEL series?
No. This article uses fueltypeid=PET. PEL is a separate petroleum-liquids fuel identifier, so the two series should not be merged.
Why is Michigan’s 4.5115 value important?
It is the lowest of the 51 PET observations and is clearly separated from Alaska, the second-lowest value.
Can the 51 heat-content averages be summed?
No. Per-barrel averages are not additive. A national average would require weights based on actual fuel quantities.
Related Articles
Green Map creates custom-edited map images using open geographic data sources such as geoBoundaries, Natural Earth, OpenStreetMap, and government open data. These maps are edited visual materials, not raw data files, and are provided for education, documents, presentations, and graphic reference.