The average heat content of renewable fuels consumed by Independent Power Producers varies sharply across U.S. states in 2025. In the U.S. Energy Information Administration’s Electric Power Operations data, the `heat-content` field with fueltypeid=REN and sectorid=94 provides 51 official observations covering all 50 states and the District of Columbia. Vermont has the highest value at 9.5316, followed by South Carolina at 8.8269, Maine at 7.8973, Louisiana at 7.4654, and Connecticut at 7.3352. The median is 0.5429 and the simple state mean is 1.8671.
This is not a renewable-energy consumption total and it is not electricity generation. Heat content is an energy-per-physical-unit measure. The official EIA metadata report the unit as Btu per physical unit. A state can therefore have a high heat-content value while consuming a relatively small quantity of renewable energy, or a low heat-content value while producing substantial renewable electricity. The series answers a per-unit energy-characteristic question rather than a scale question.
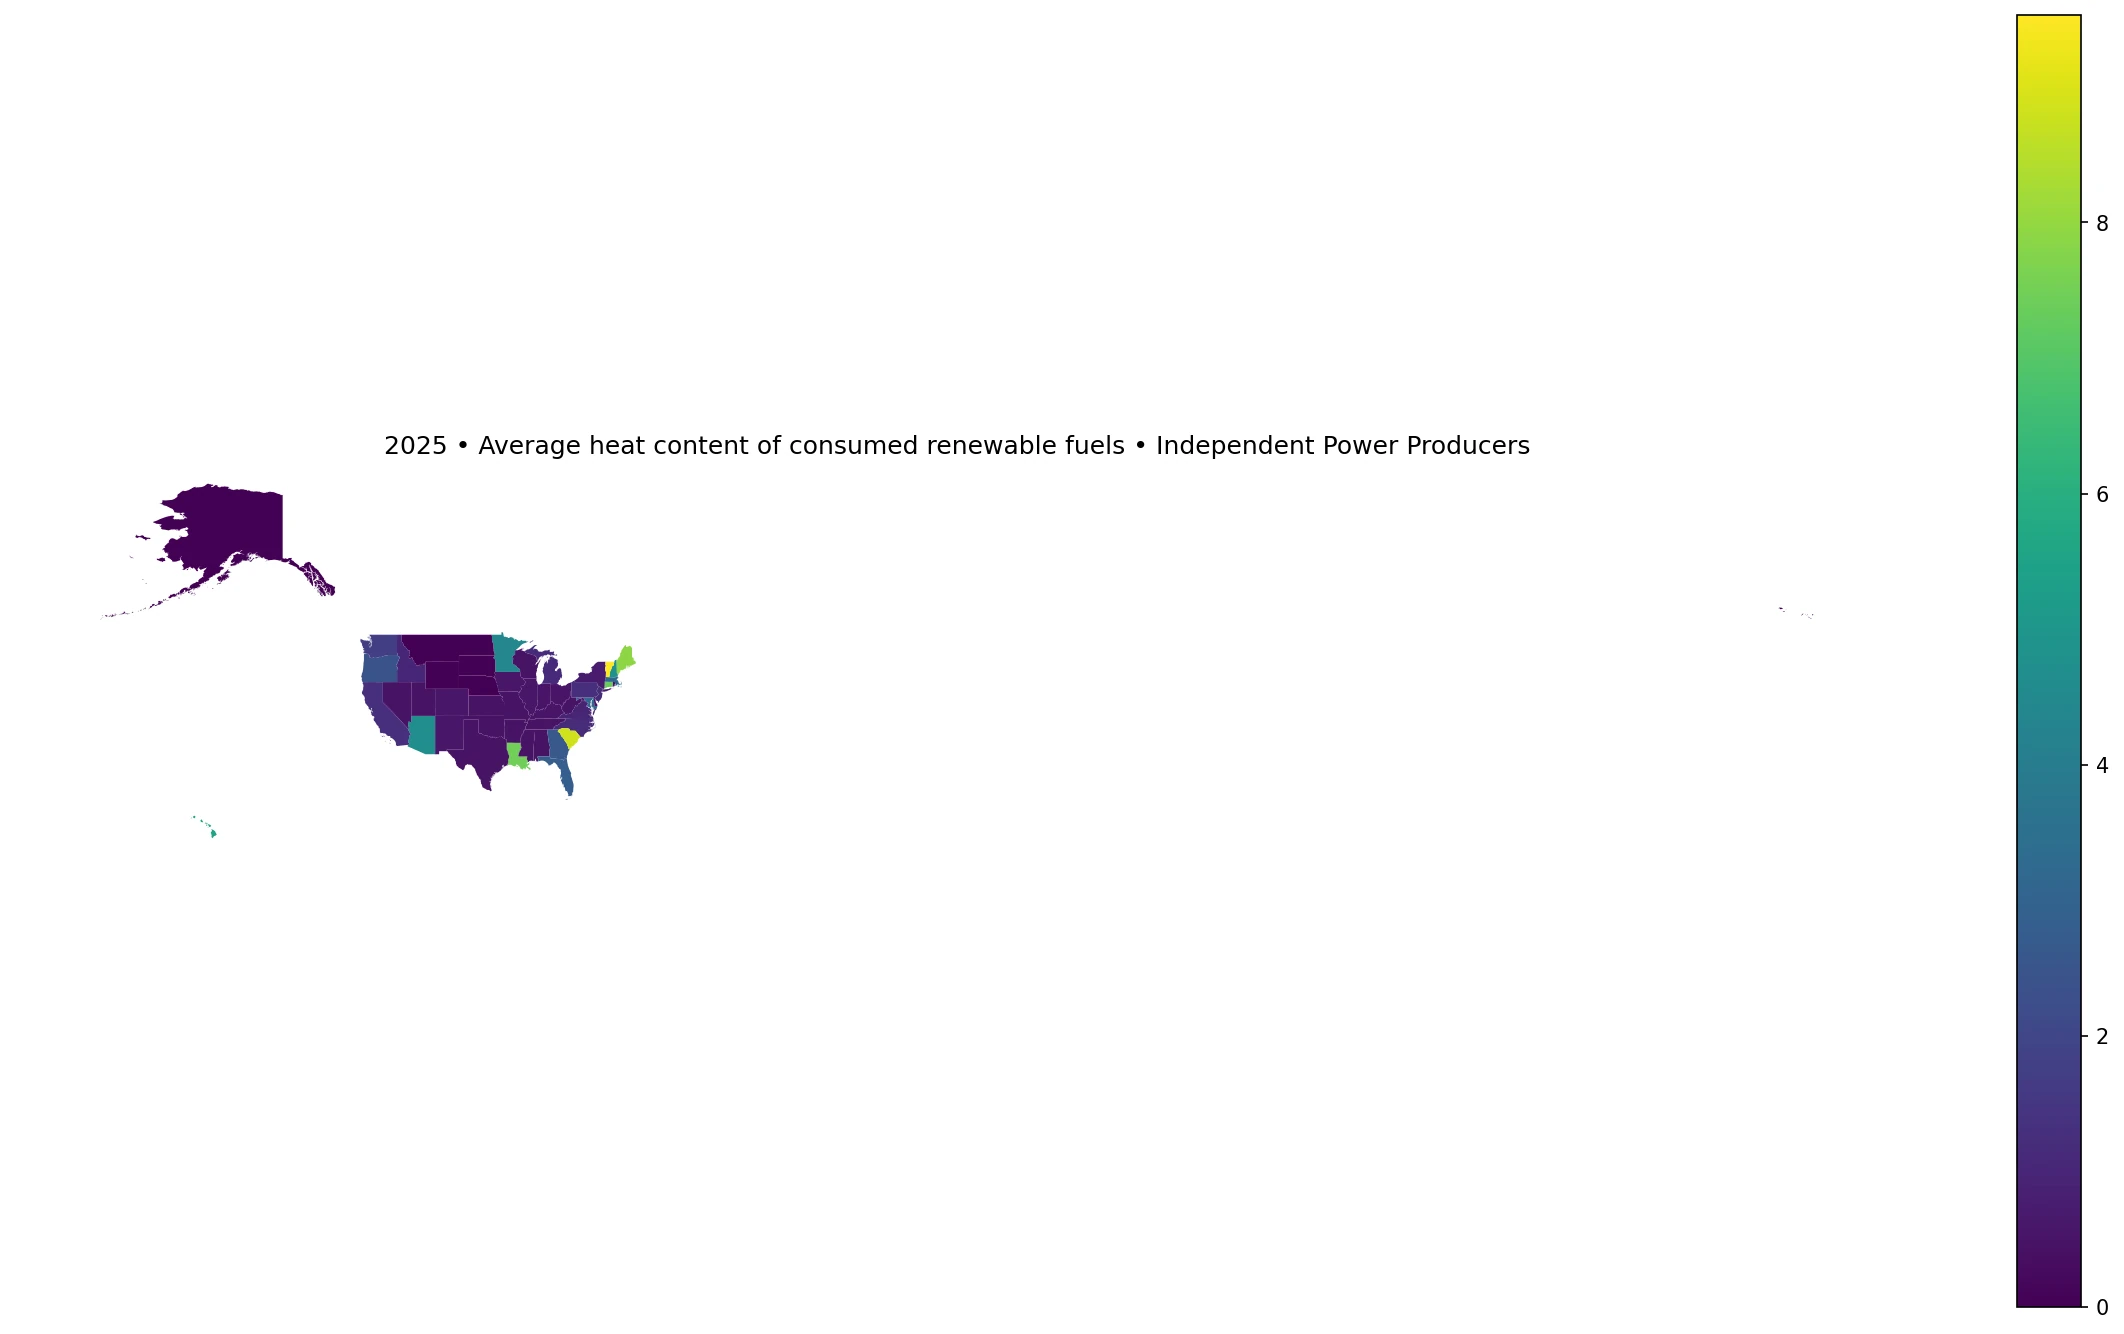
Table of Contents
The median is 0.5429 while the simple state mean is 1.8671
The first quartile is 0.4759 and the third quartile is 2.5338, so the middle half of the 51 observations lies between roughly 0.48 and 2.53. The mean is more than three times the median because a small group of states sits far above the center of the distribution. Vermont’s 9.5316 is about eighteen times the median.
Six states have values of at least 5, and 11 are at or above 3. By contrast, 30 jurisdictions are below 1. Thirteen observations are packed into the narrow 0.47 to 0.48 interval, including 11 states with exactly 0.4759. The repeated values are an important feature of the distribution, although the state-level aggregate alone does not establish why they repeat.
The ten highest state observations
| State | 2025 average heat content |
|---|---|
| Vermont | 9.5316 |
| South Carolina | 8.8269 |
| Maine | 7.8973 |
| Louisiana | 7.4654 |
| Connecticut | 7.3352 |
| Hawaii | 5.5296 |
| New Hampshire | 4.7325 |
| Arizona | 4.6726 |
| Minnesota | 4.4035 |
| Massachusetts | 3.1310 |
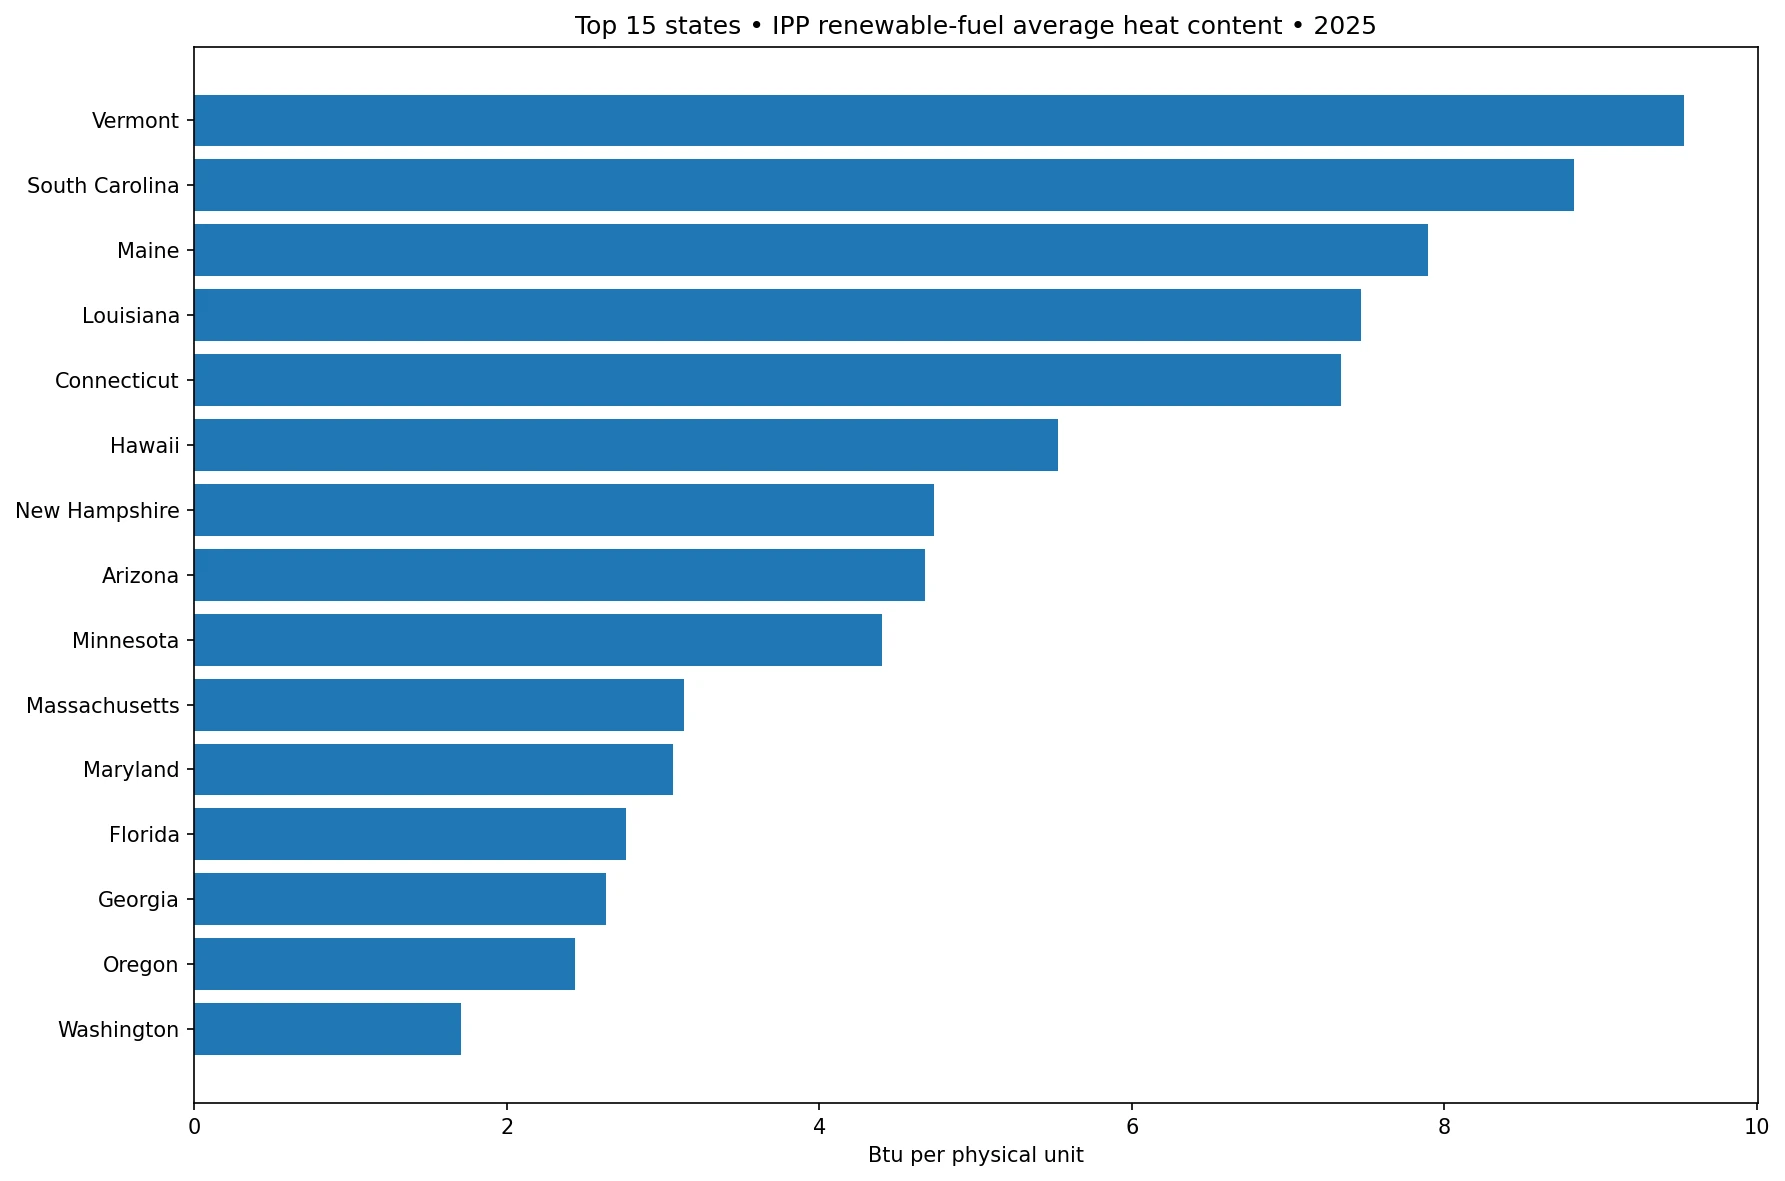
Vermont leads at 9.5316 and South Carolina follows at 8.8269. Maine, Louisiana, and Connecticut are all above 7. Hawaii records 5.5296, New Hampshire 4.7325, Arizona 4.6726, Minnesota 4.4035, and Massachusetts 3.1310.
The highest values are spread across New England, the South, the West, the Midwest, and an island state. There is no simple geographic gradient. The most plausible analytical next step is to examine which renewable energy sources independent producers consume in each state, but the aggregated REN series does not provide that source-level decomposition.
Seven jurisdictions have an official zero
| State or jurisdiction | 2025 average heat content |
|---|---|
| Alaska | 0.0000 |
| North Dakota | 0.0000 |
| Montana | 0.0000 |
| District of Columbia | 0.0000 |
| Nebraska | 0.0000 |
| South Dakota | 0.0000 |
| Wyoming | 0.0000 |
| Rhode Island | 0.4751 |
| Nevada | 0.4759 |
| Tennessee | 0.4759 |
Alaska, the District of Columbia, Montana, North Dakota, Nebraska, South Dakota, and Wyoming all have a published value of 0.0000. Rhode Island is at 0.4751, while Alabama and Arkansas are at 0.4759. The zeros are source observations; they are not missing entries that were filled with zero during processing.
An official zero should not be expanded into a claim that the state has no renewable generation or no independent power producers. This series is a specific EIA combination of `heat-content`, REN, sectorid=94, state geography, and 2025. Generation, capacity, fuel volumes, and other EIA sectors are separate measures.
State values should not be summed into a national total
Average heat content is not an additive quantity. Adding the 51 state averages would not create a meaningful ‘U.S. total heat content.’ A national average would require appropriate weights based on the underlying quantities consumed or another relevant physical measure.
For the same reason, the 1.8671 figure reported here is simply an unweighted arithmetic mean across the 51 state observations. It is useful for describing the shape of the state distribution, but it is not an EIA-published national weighted average. Medians, quartiles, thresholds, and rankings are more appropriate for this analysis.
The Independent Power Producers sector is a defining part of the series
The dataset uses sectorid=94, identified in the official metadata as Independent Power Producers. A heat-content series using the same REN fuel category can produce different values if it covers the broader Electric Power sector or another producer class. Sector scope changes which facilities and fuel use contribute to the state observation.
A valid one-to-one comparison therefore requires matching field, fueltypeid, sectorid, year, geography, and unit. The identity of this dataset is 2025 annual `heat-content`, REN, sectorid=94, U.S. states, Btu per physical unit. A change in any of those elements creates a different series rather than a simple continuation.
Renewable energy is not one homogeneous fuel
REN is an aggregate category rather than a single chemically uniform fuel. Renewable energy can include combustible sources such as biomass as well as noncombustible sources such as wind, hydro, and solar. Physical units and energy-conversion treatment can differ across those components, which makes an aggregate renewable heat-content number less intuitive than the heat content of a single petroleum product or natural-gas stream.
To explain why Vermont or South Carolina is high, or why a group of states clusters near 0.4759, source-level renewable data would be needed. The state aggregate used here can describe the pattern accurately, but it cannot determine whether biomass composition, conversion conventions, or another source mix is responsible.
Heat content and renewable generation answer different questions
Electricity generation is an output measure, usually reported in megawatthours. Heat content is an energy-per-unit characteristic of the energy source being consumed. A state with large renewable generation does not have to rank high in this heat-content series, and a state with high average heat content does not necessarily have a large renewable share of electricity.
A fuller picture of independent renewable producers would combine net generation, physical fuel consumption, capacity, source mix, and this heat-content measure. Treating one of those variables as a substitute for the others would confuse the scale of activity with the energy characteristics of the inputs.
The cluster near 0.4759 is a real feature of the data
Alabama, Arkansas, Delaware, Kansas, Missouri, Mississippi, Nevada, Oklahoma, Tennessee, Texas, and Utah all report exactly 0.4759. Rhode Island at 0.4751 and West Virginia at 0.4761 bring the number of observations in the 0.47–0.48 interval to 13.
The repeated values may invite a hypothesis about common conversion factors or similar source composition, but the verified state table does not contain enough evidence to choose among those explanations. The safest interpretation is descriptive: a substantial group of states shares nearly identical published average heat-content values.
The official zeros are analytically different from missing data
Missing observations indicate that no usable value is available in the dataset. A published zero is a numeric observation. Converting missing values to zero would distort maps, summary statistics, and rankings, but that was not done here. All seven zeros are retained exactly as provided by EIA.
This distinction also matters visually. The map’s low end includes the official zeros as observed values rather than treating them as blank areas. Because every one of the 51 observations matches a state or District boundary, no state is omitted from the geographic join.
A single year cannot establish a trend
The map describes 2025 only. It does not show whether Vermont has consistently ranked first, whether a state’s value is rising, or whether the seven zeros persist over time. Changes in source composition, reporting, or the physical quantities consumed can all move an average heat-content value from one year to another.
A proper time series should keep the EIA route, `heat-content` field, fueltypeid=REN, sectorid=94, state geography, and unit unchanged for every year. Comparing this series directly with a 2024 heat-content article using another sector would mix a sector change with a time change.
How to read the map, table, and chart together
The map shows that high observations are geographically dispersed. The table preserves the exact values, including seven official zeros and the repeated values around 0.4759. The top-15 chart makes the long upper tail visible: the distribution drops from values near 8–10 to roughly 1–3 within a relatively small number of states.
The contrast between median and mean is especially useful. An average of 1.8671 can make a typical state appear much higher than it is. In reality, half of the observations are at or below 0.5429 and 30 are below 1. The upper tail, not the center of the distribution, is what drives the mean upward.
What this indicator can and cannot tell us
It can tell us how the published average heat-content values differ across states for renewable energy consumed by Independent Power Producers in 2025. It can identify outliers, repeated values, and the spread of the distribution. It cannot by itself tell us which state used the most renewable energy, generated the most renewable electricity, or operated most efficiently.
Those other questions require volume, generation, or output/input measures. Keeping the semantic boundary clear is particularly important because EIA Electric Power Operations contains many fields with similar state and annual structures but very different meanings.
Data source and calculation method
The source is the U.S. Energy Information Administration’s Electric Power Operations (Annual and Monthly) API. The reference year is 2025, the field is `heat-content`, fueltypeid=REN, and sectorid=94 for Independent Power Producers. The official metadata report the unit as Btu per physical unit, and the verified dataset contains 51 observations for the 50 states and the District of Columbia.
The mean, median, quartiles, threshold counts, and ranking tables are calculated directly from those 51 values. Missing values are not converted to zero; the seven official zeros are retained. State codes were joined to U.S. state boundaries, and all 51 observations matched successfully for a 100% geographic join rate.
Frequently Asked Questions
Does higher average heat content mean a state consumed more renewable energy?
No. `heat-content` is a per-physical-unit average. Consumption volume and electricity generation are separate measures.
Are the seven zero values missing data?
No. They are official numeric observations in the source. Missing values were not replaced with zero.
Can the 51 state values be added to create a U.S. heat-content total?
No. Average heat-content values are not additive. A meaningful national average would require appropriate weights based on underlying quantities.
Related Articles
Green Map creates custom-edited map images using open geographic data sources such as geoBoundaries, Natural Earth, OpenStreetMap, and government open data. These maps are edited visual materials, not raw data files, and are provided for education, documents, presentations, and graphic reference.