A country can have a large higher-education system and still show a gender gap in first-degree graduation. It can also have nearly identical female and male graduation ratios while the absolute level for both groups remains modest. The adjusted gender parity index (GPIA) is designed to separate that relative gender-balance question from the underlying level of graduation.
This page focuses on the 2023 UNESCO Institute for Statistics (UIS) indicator GGR.6T7.GPIA. It compares the female and male gross graduation ratios for first-degree programmes at ISCED levels 6 and 7. The 2023 national extract used for this topic covers 75 observations. GPIA is an index centered on 1, not a graduation percentage and not a score in which a larger number is automatically better.
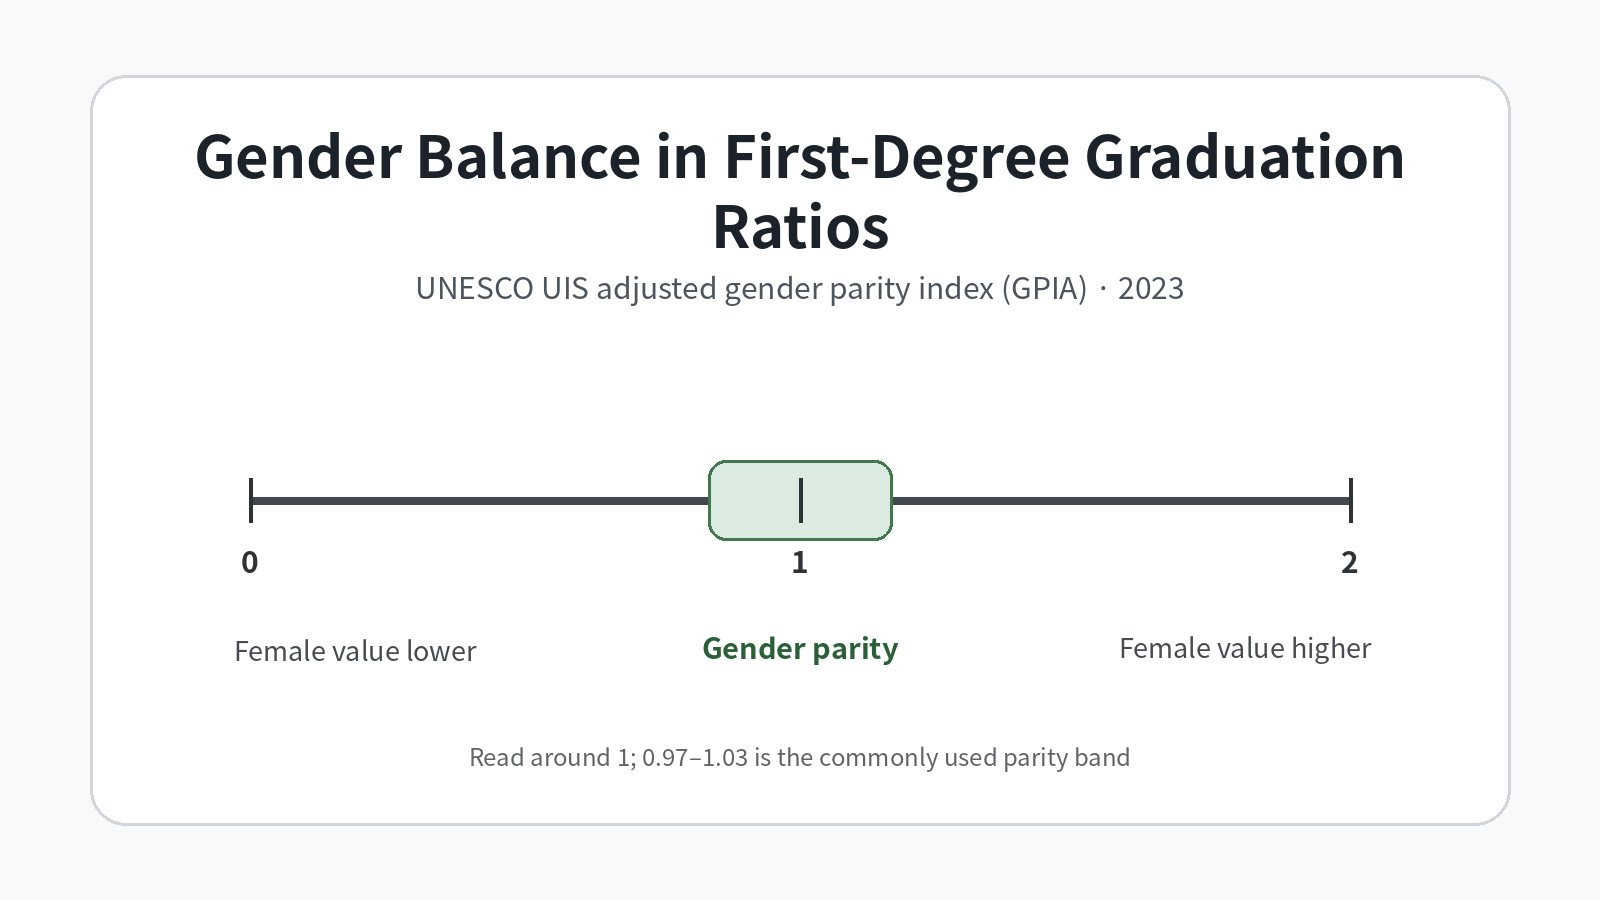
Table of Contents
The gross graduation ratio is not the share of entrants who finish a degree
UIS defines the gross graduation ratio from first-degree tertiary programmes as the number of graduates from first-degree programmes at ISCED levels 6 and 7 expressed as a percentage of the population at the theoretical graduation age of the most common first-degree programme. That denominator is very different from a cohort of students who entered university several years earlier.
Because graduates of any age can be included, the gross ratio can be affected by delayed study, accelerated study, programme structure, international mobility and the age profile of the population. It can even exceed 100 in unusual cases. The measure is therefore useful for comparing the volume of graduates with a population benchmark, but it should not be relabeled as a student completion probability or a direct dropout measure.
GPIA answers a relative gender-balance question
A conventional gender parity index compares the female value of an indicator with the male value. A value of exactly 1 means the two underlying values are equal. For a favorable indicator such as graduation, a value below 1 points to a lower female value relative to the male value, while a value above 1 points in the opposite direction.
The ordinary female-to-male ratio is not symmetric around 1. A ratio of 0.80 and the reversed relationship of 1.25 describe equal proportional gaps, yet their numerical distances from 1 differ. UIS uses an adjusted parity approach so that the index behaves symmetrically around 1 and is bounded between 0 and 2. This makes distances on the two sides of parity easier to compare.
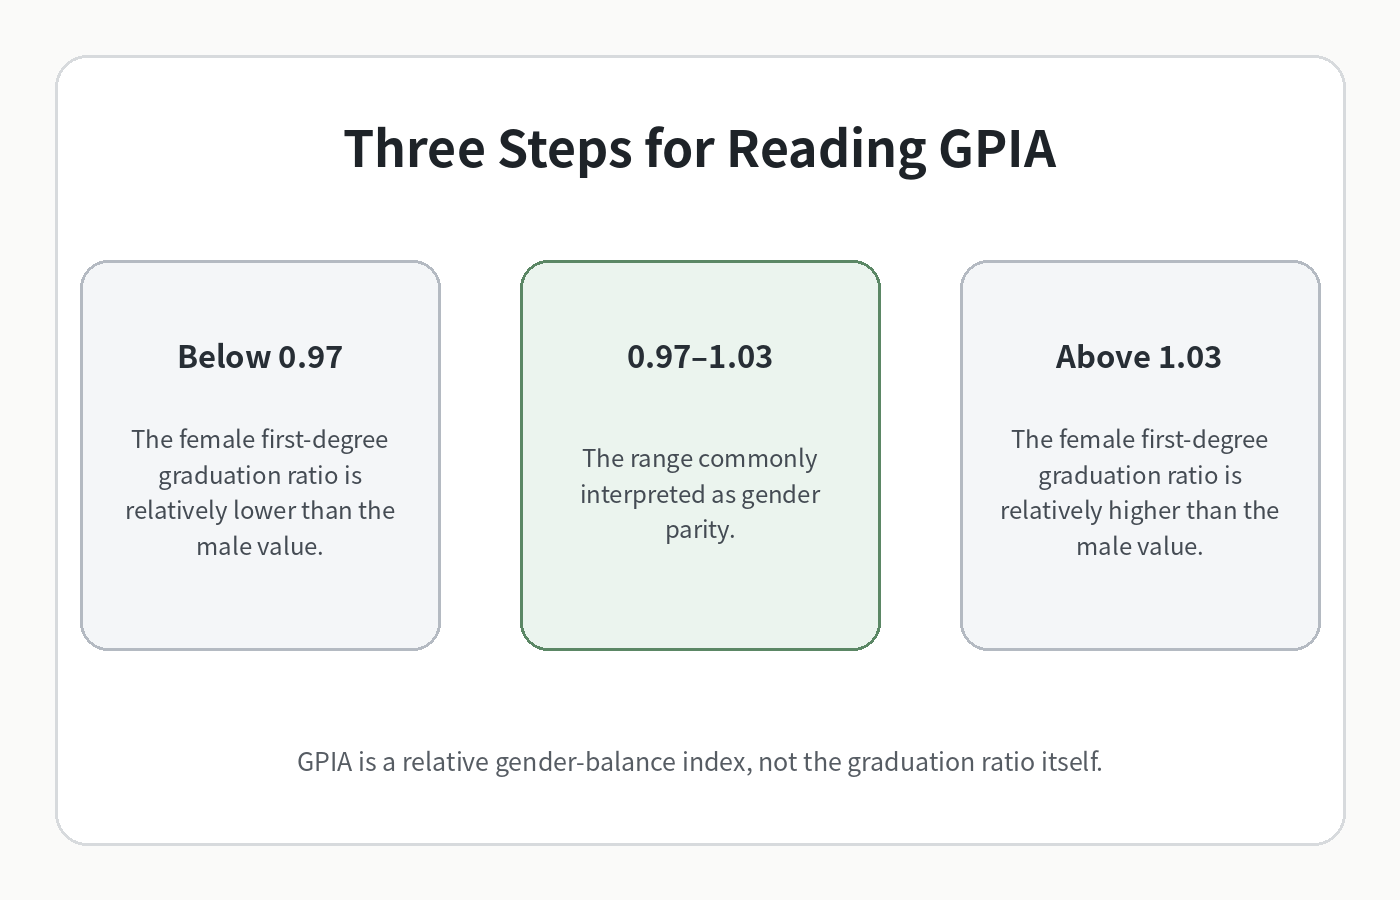
The 0.97–1.03 band prevents tiny differences from becoming false rankings
UIS materials commonly interpret values from 0.97 to 1.03 as gender parity. That convention recognizes that a small difference such as 0.99 versus 1.01 should not be presented as a dramatic divide. Both are close to 1 even though they point in opposite directions. Values farther from 1 indicate a larger relative disparity between the female and male versions of the underlying indicator.
| GPIA range | Interpretation for first-degree gross graduation ratios |
|---|---|
| Below 0.97 | Female graduation-ratio value is relatively lower than the male value |
| 0.97–1.03 | Commonly interpreted as the gender-parity range |
| Above 1.03 | Female graduation-ratio value is relatively higher than the male value |
The table is not a performance ladder. A value of 1.05 is not inherently superior to 1.02, and a value above 1 is not automatically a policy success. The most direct reading is direction and distance from 1. To judge the level of graduation, the female and male gross graduation ratios themselves are still needed.
The 2023 higher-education context shows why level and parity should be separated
UNESCO’s 2026 global higher-education trends report describes a world gross graduation ratio for first-degree programmes of about 27% in 2023, compared with about 22% in 2013. The female ratio was about 30% in 2023, up from roughly 23% a decade earlier. Those figures show a broad expansion in the volume of first-degree graduates relative to the theoretical graduation-age population.
The report also describes female ratios above the overall level in several world regions, while data availability is weaker for some regions and years. These aggregates provide context, but they do not substitute for country observations. A national GPIA can only be interpreted correctly when the female and male indicators use the same definition and reference period.
Coverage of 75 observations is not the same as complete world coverage
The 2023 cross-section associated with this topic contains 75 national observations. Countries without a reported value are missing observations, not zeros. They should not be assigned a color, rank or parity status by assumption. The number of available rows also should not be turned into a population-weighted global estimate, because every reporting country would otherwise receive the same weight regardless of population size.
This is another reason to avoid treating the index as a simple league table. A country near 1 may have balanced but low graduation ratios, while another country farther from 1 may have high graduation ratios for both sexes but a noticeable relative difference. Parity and level answer two different questions, and a good comparison keeps them separate.
Three checks make country comparisons more useful
- Direction: identify whether the index is below or above 1 before attaching any interpretation.
- Distance from parity: check whether the value lies inside the 0.97–1.03 band and how far it is from 1.
- Underlying level: where possible, read the female and male gross graduation ratios alongside GPIA so that parity at a low level is not confused with strong graduation outcomes.
Reference year, reporting coverage and national higher-education structure matter as well. First-degree programmes differ in length and organization, and the theoretical graduation age is a population benchmark rather than a tracked student cohort. Broad patterns and material gaps are therefore more defensible than fine decimal-place rankings.
GPIA does not identify the cause of a gender gap
The index contains no information about why female and male graduation ratios differ. Potential explanations can involve earlier education pathways, access to tertiary education, programme choice, tuition and financial aid, work and family timing, migration, military service, international students or institutional structure. Establishing a cause requires country-specific evidence aligned to the same period.
GPIA also addresses only one dimension of inequality. It does not reveal disparities by income, region, disability, migration background or other population characteristics. A value close to 1 is evidence of similarity between the two sex-disaggregated indicator values; it is not evidence that every aspect of equity in tertiary education has been achieved.
Data source and interpretation limits
The primary source is the UNESCO Institute for Statistics. UIS defines the first-degree gross graduation ratio in the UIS Data Browser glossary, and the broader OPRI education dataset is available through UNESCO DataHub. The indicator used here is GGR.6T7.GPIA for reference year 2023.
A missing country is not a zero. GPIA should not be formatted as a percentage, and a value of 1 does not mean a 100% graduation ratio. It means that the female and male underlying values are equal. Trend claims require multiple comparable years; a single 2023 cross-section can describe parity at that point in time but cannot by itself show whether a country is improving or deteriorating.
Frequently Asked Questions
Does a GPIA of 1 mean a 100% graduation ratio?
No. A value of 1 means the female and male underlying graduation-ratio values are equal. Their actual levels must be checked separately.
Why is 0.97–1.03 treated as the parity band?
UIS commonly uses this interval so that very small differences around 1 are not overinterpreted as meaningful gender disparities.
Is the gross graduation ratio the percentage of entrants who complete university?
No. It compares first-degree graduates with the population at the theoretical graduation age of the most common first-degree programme.
Should a country with no value be treated as zero?
No. Missing or unreported data are not zeros and should remain explicitly missing in comparisons and visualizations.
Related Articles
- Education-Field Share Among Tertiary Graduates by Country
- Tertiary Graduates in Services Fields by Country
- Tertiary Graduates by Field: Social Sciences, Journalism & Information
Green Map creates custom-edited map images using open geographic data sources such as geoBoundaries, Natural Earth, OpenStreetMap, and government open data.
These maps are edited visual materials, not raw data files, and are provided for education, documents, presentations, and graphic reference.