Distillate fuel oil (DFO) consumed for electricity generation and useful thermal output in the U.S. Electric Power sector was highly concentrated across states in 2024. The U.S. Energy Information Administration series used here fixes annual frequency, `total-consumption`, fueltypeid=DFO, and sectorid=98. The 50 state observations sum to 9,695.418 thousand short tons. Hawaii is the largest at 2,518.630, equal to 25.98% of the 50-state sum, while Alaska and Maryland rank second and third.
The metric is intentionally broader than a series limited to electricity generation alone. EIA’s `total-consumption` field combines fuel consumed for electricity generation with fuel allocated to useful thermal output within the selected Electric Power sector. That makes it different from `consumption-for-eg`, which isolates electricity generation, and `consumption-uto`, which isolates useful thermal output. It is also a physical-units series rather than the BTU-based total-consumption measure. Field, fuel, sector, year, and unit are all part of the statistical identity.
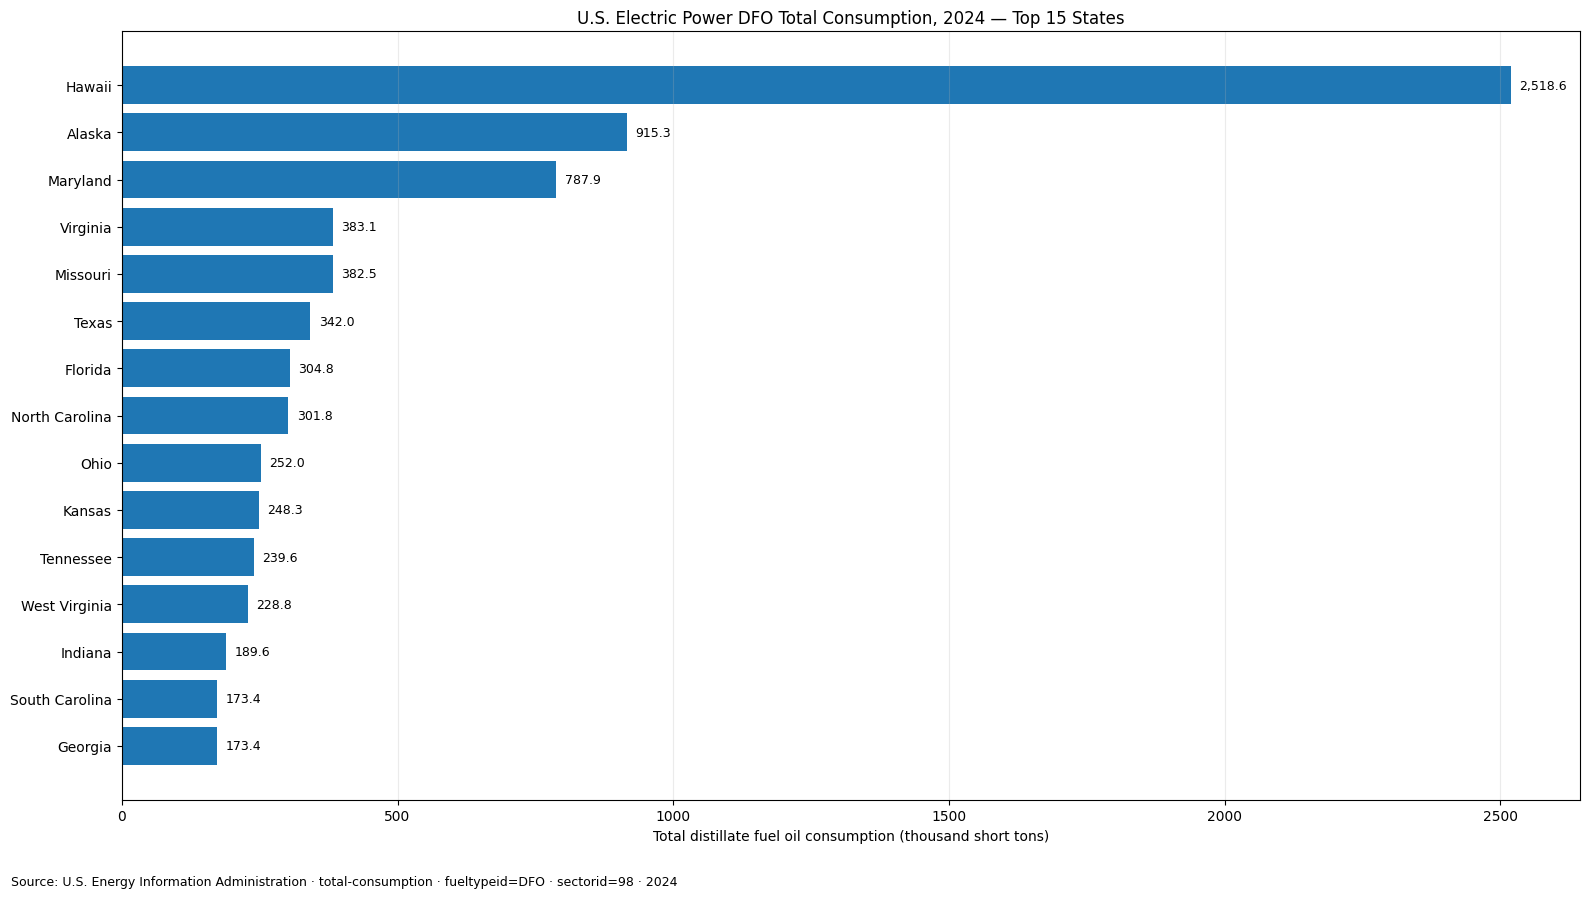
Table of Contents
Hawaii alone accounts for more than one quarter of the 50-state sum
Hawaii reports 2,518.630 thousand short tons, about 2.75 times Alaska’s 915.341. Maryland follows at 787.864. There is then another step down to Virginia at 383.092 and Missouri at 382.480, followed by Texas at 342.047. The distribution therefore has several distinct levels rather than a smooth progression from first to fiftieth. Hawaii is an exceptional upper observation, Alaska and Maryland form a second tier, and most states lie far below them.
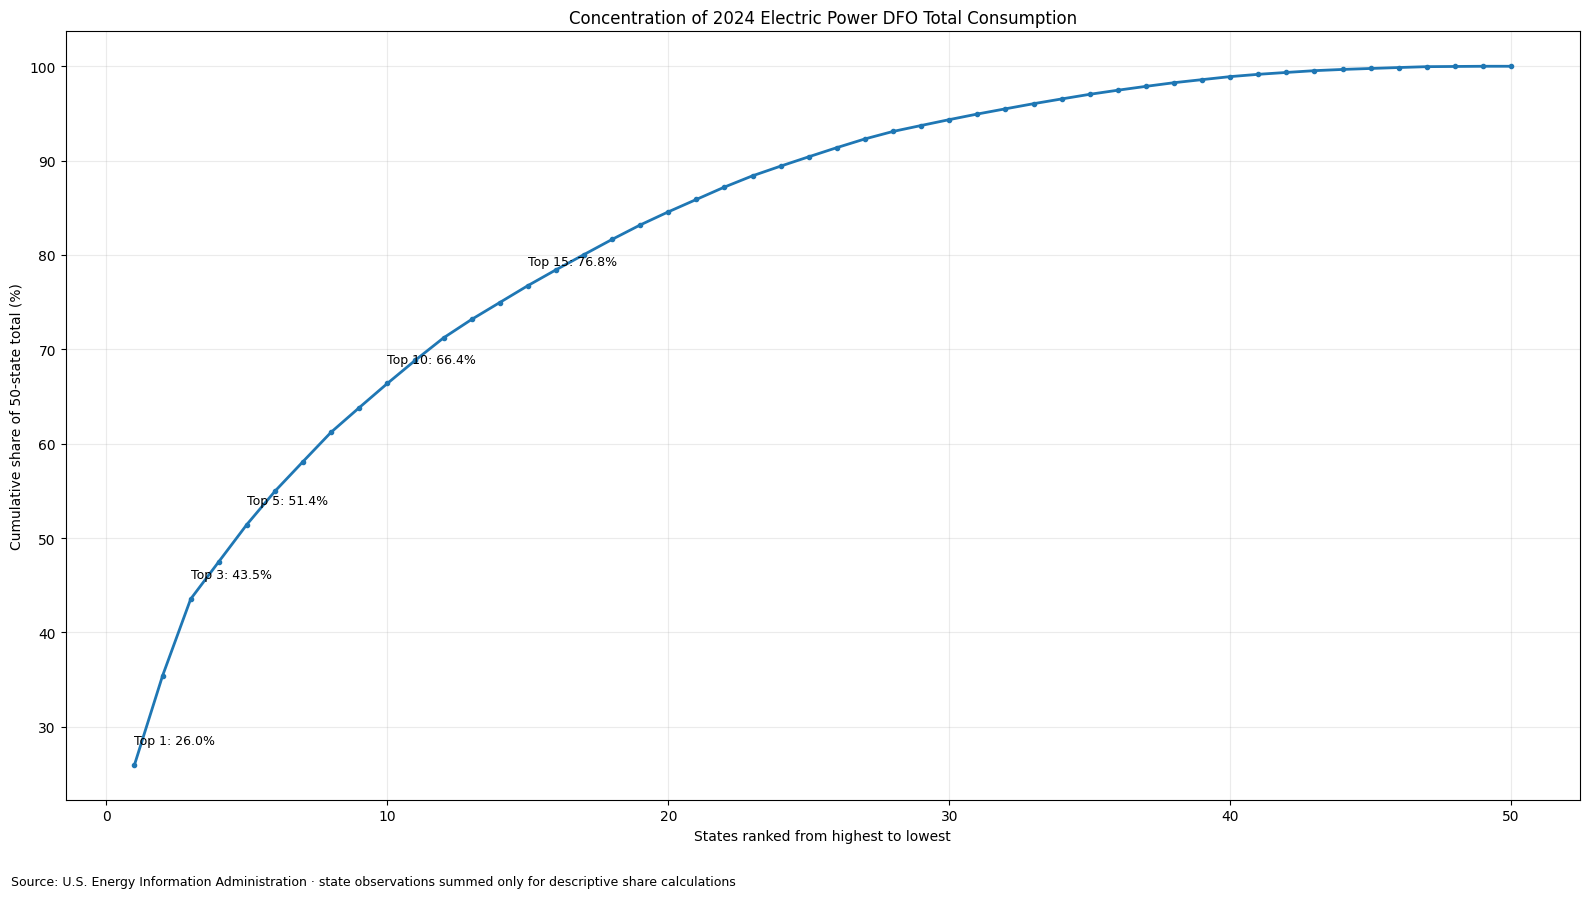
Cumulative shares make that structure clearer. The largest state represents 25.98% of the 50-state sum, the top three 43.54%, the top five 51.44%, and the top ten 66.39%. Expanding the group to the top fifteen raises the cumulative share to 76.75%. In other words, 30% of the states account for more than three quarters of the physical DFO total measured in this series.
| Rank | State | 2024 total consumption (thousand short tons) |
|---|---|---|
| 1 | Hawaii | 2,518.630 |
| 2 | Alaska | 915.341 |
| 3 | Maryland | 787.864 |
| 4 | Virginia | 383.092 |
| 5 | Missouri | 382.480 |
| 6 | Texas | 342.047 |
| 7 | Florida | 304.833 |
| 8 | North Carolina | 301.835 |
| 9 | Ohio | 252.029 |
| 10 | Kansas | 248.311 |
| 11 | Tennessee | 239.570 |
| 12 | West Virginia | 228.792 |
| 13 | Indiana | 189.649 |
| 14 | South Carolina | 173.427 |
| 15 | Georgia | 173.403 |
The median is less than half the mean
The unweighted mean across the 50 states is 193.908 thousand short tons, while the median is only 94.971. The first quartile is 38.158 and the third quartile is 185.594, placing the middle half of states within a much narrower range than the full distribution. The mean is elevated by a small set of very large observations, so it is not a good standalone description of a typical state.
Only 3 states are at or above 500 thousand short tons, 9 are at or above 250, and 23 reach at least 100. At the other end, 17 states are below 50 and 5 are below 10. Those counts show why both the median and cumulative concentration measures add information that a simple ranked list does not provide.
The smallest observations are positive values, not missing records
Idaho is the minimum at 0.083 thousand short tons. New Mexico reports 2.011, Maine 2.028, Vermont 8.925, and Mississippi 9.613. The dataset contains 0 reported zeros and no missing values in its 50 rows. A tiny positive observation such as Idaho’s should therefore remain distinct from both zero and missing data. That distinction matters in automated ranking, mapping, and aggregation workflows.
| Low-end position | State | 2024 total consumption (thousand short tons) |
|---|---|---|
| 1 | Idaho | 0.083 |
| 2 | New Mexico | 2.011 |
| 3 | Maine | 2.028 |
| 4 | Vermont | 8.925 |
| 5 | Mississippi | 9.613 |
| 6 | Rhode Island | 10.001 |
| 7 | Nevada | 12.557 |
| 8 | Louisiana | 18.310 |
| 9 | Alabama | 19.213 |
| 10 | Oregon | 23.643 |
A low value does not imply low electricity demand or a small power system. This series isolates only distillate fuel oil. A state can produce large amounts of electricity from natural gas, coal, nuclear, hydro, wind, solar, or other sources while using very little DFO. The ranking should therefore be read as a DFO physical-consumption ranking inside one sector, not as an overall ranking of electricity production or energy use.
Total consumption combines two fuel-use purposes
The `total-consumption` field is the main feature that separates this series from closely related DFO indicators. `consumption-for-eg` is limited to fuel assigned to electricity generation, while `consumption-uto` is limited to useful thermal output. The total-consumption field covers the combined physical quantity under the selected sector definition. This broader scope is why it can answer a different question even when the fuel, geography, and year look identical.
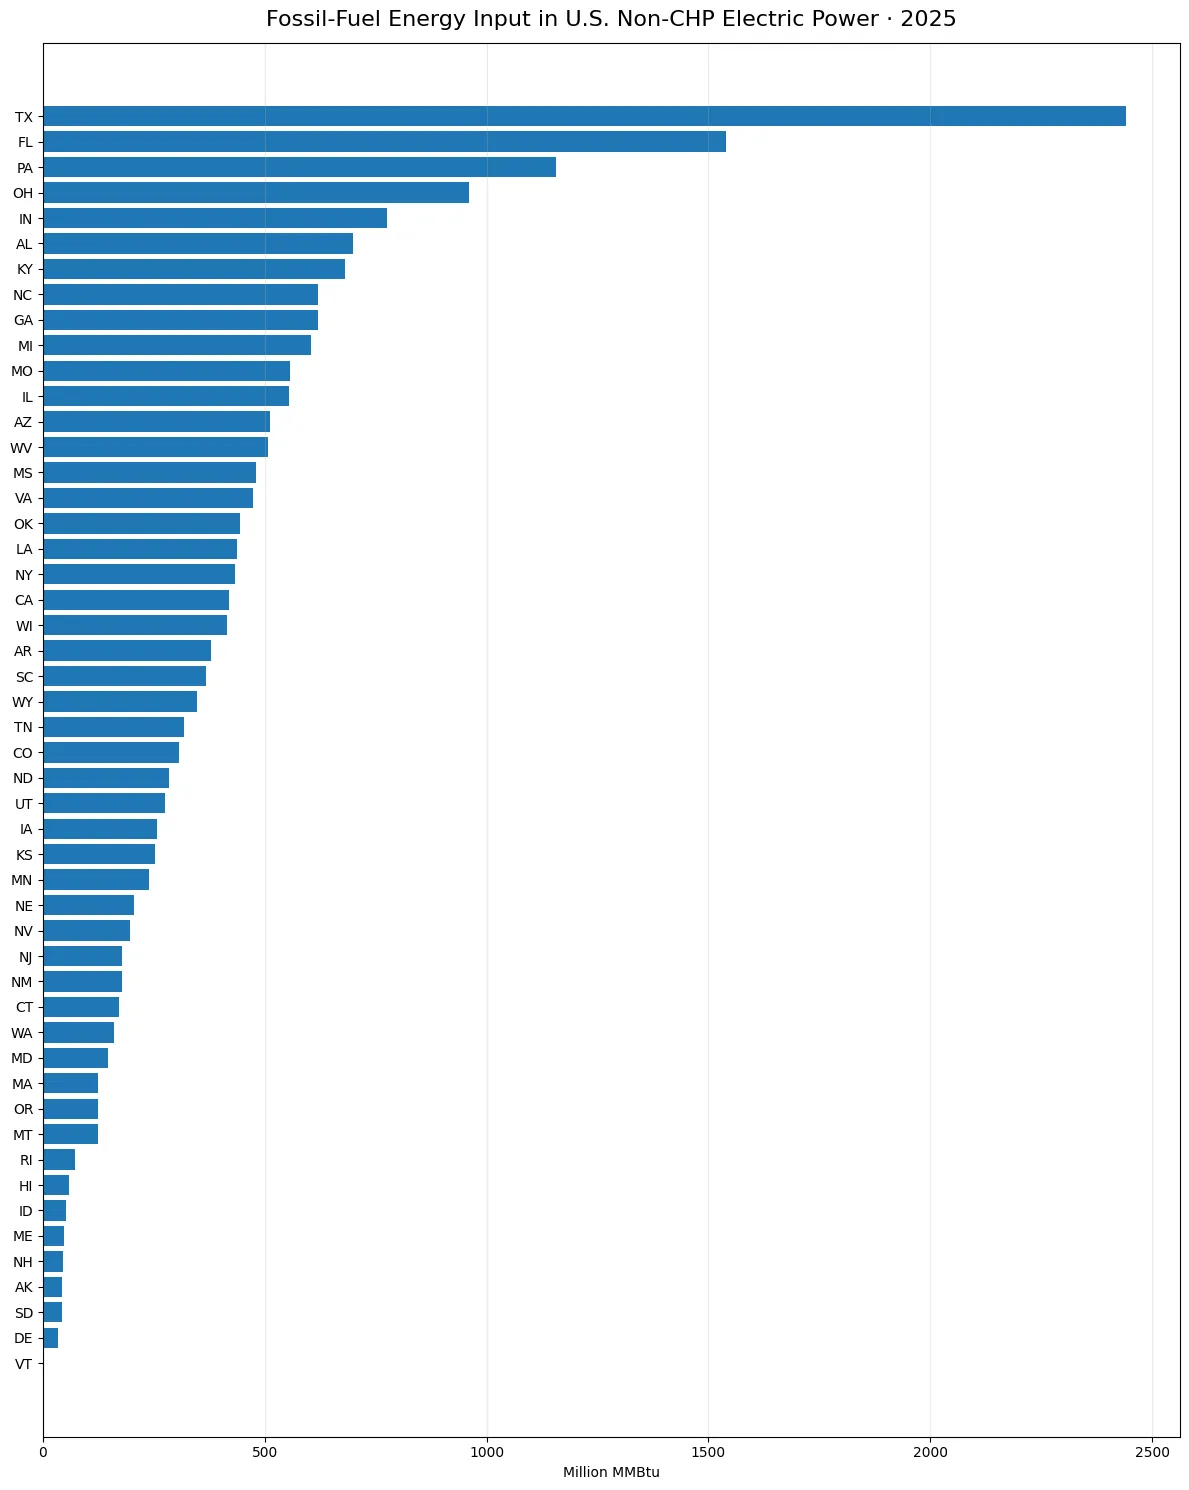
The distinction is especially relevant where combined-heat-and-power activity exists. Useful thermal output can create a separate fuel-allocation component that is absent from an electricity-generation-only series. Likewise, sectorid=98 Electric Power is not the same as sectorid=90 Electric Power Sector Non-CHP. Changing the sector changes the set of plants and activities included, so two total-consumption series with the same fuel and year can still be materially different.
Physical quantity is not the same as BTU energy input
The supplied series uses thousand short tons as its physical unit. A related `total-consumption-btu` series expresses the heat-energy content of DFO consumption in million MMBtu. Those measures are connected, but they are not interchangeable. Physical quantity answers how much fuel material was consumed under the source definition, while the BTU series answers how much energy that consumed fuel represented.
The two series also should not be added together. They are alternative representations of related fuel use, not separate consumption categories. Heat content can vary somewhat by observation, so a physical-unit ranking and an energy-content ranking need not be numerically identical in every detail. For that reason, the unit belongs in the identity of the metric rather than being treated as a cosmetic label.
Absolute DFO volume is not a measure of oil dependence
Hawaii’s 25.98% share means that Hawaii accounts for 25.98% of the sum of these 50 state DFO total-consumption observations. It does not mean Hawaii produces 25.98% of U.S. electricity from oil, consumes 25.98% of all U.S. petroleum, or has a 25.98% petroleum share in its own power mix. Each of those claims would require a different denominator and, in some cases, a different dataset.
The ranking also says nothing by itself about generating efficiency. Efficiency analysis requires both input energy and electricity output, while emissions analysis requires fuel-specific emissions information and operating context. This dataset directly supports a narrower conclusion: the 2024 physical amount of DFO used for the combined electricity-generation and useful-thermal-output purposes varied greatly across states.
The 2024 cross-section does not establish a trend
All observations refer to the same 2024 period, which is useful for cross-state comparison. It does not show whether Hawaii increased from 2023, whether Maryland is on a declining path, or whether concentration among the leading states is rising over time. A valid trend analysis would hold `total-consumption`, DFO, sectorid=98, annual frequency, and the unit constant across multiple years.
The 9,695.418 thousand-short-ton total used in this article is the direct sum of the 50 state observations. That is an internally consistent denominator for state-share calculations, but it should not automatically be substituted for a separately published national EIA aggregate. National totals can follow different reporting, revision, or aggregation rules, so an official national figure should be checked in the matching source series.
What the 2024 distribution shows most clearly
The central result is strong concentration combined with a long lower distribution. Hawaii alone contributes 25.98% of the analytical 50-state sum, the top three contribute 43.54%, and the top ten 66.39%. At the same time, the median state is only 94.971 thousand short tons. A few large observations therefore shape the aggregate much more than the typical state does.
For reuse, five qualifiers should remain attached to every figure: 2024, DFO, Electric Power sectorid=98, total-consumption, and physical units. Changing any one of those creates a different EIA slice. That discipline is particularly important when a publishing system contains several articles with similar fuel names but different fields, sectors, and units.
Source and calculation method
The source is the U.S. Energy Information Administration electricity/electric-power-operational-data API. The selected slice uses annual 2024 observations, field `total-consumption`, fueltypeid=DFO, and sectorid=98 for Electric Power. The supplied metadata identifies the unit as thousand short tons. The dataset contains all 50 states with numeric observations and no missing rows.
The sum, mean, median, quartiles, rankings, threshold counts, and cumulative shares were calculated directly from those 50 values. No missing value was filled with zero, no other year was substituted, and the charts and tables use the same source observations.
Frequently Asked Questions
Does this metric include only DFO used for electricity generation?
No. total-consumption combines DFO used for electricity generation and useful thermal output within Electric Power sectorid=98.
Which state has the largest 2024 value?
Hawaii is highest at 2,518.630 thousand short tons, equal to 25.98% of the 50-state sum.
Is this the same as the BTU total-consumption series?
No. This is a physical-units series, while total-consumption-btu expresses fuel energy content in million MMBtu.
Are the very small state values missing data?
No. All 50 state rows are numeric, with no missing values and no reported zeros in the supplied dataset.
Related Articles
Green Map creates custom-edited map images using open geographic data sources such as geoBoundaries, Natural Earth, OpenStreetMap, and government open data. These maps are edited visual materials, not raw data files, and are provided for education, documents, presentations, and graphic reference.