In 2024, the 50 U.S. states reported 55.98 million MMBtu of distillate fuel oil energy consumed in the Electric Power sector for electricity generation and useful thermal output. The comparison comes from the U.S. Energy Information Administration Electric Power Operational Data with fueltypeid=DFO, sectorid=98 and the total-consumption-btu field held constant across every state.
Hawaii stands apart at 14.53 million MMBtu, or 26.0% of the 50-state total. Alaska follows at 5.18, while Maryland records 4.56. Those three states alone account for 43.4% of the measured total. This is a comparison of absolute fuel-energy input, not electricity output, efficiency, emissions, or the share of a state power mix supplied by oil.
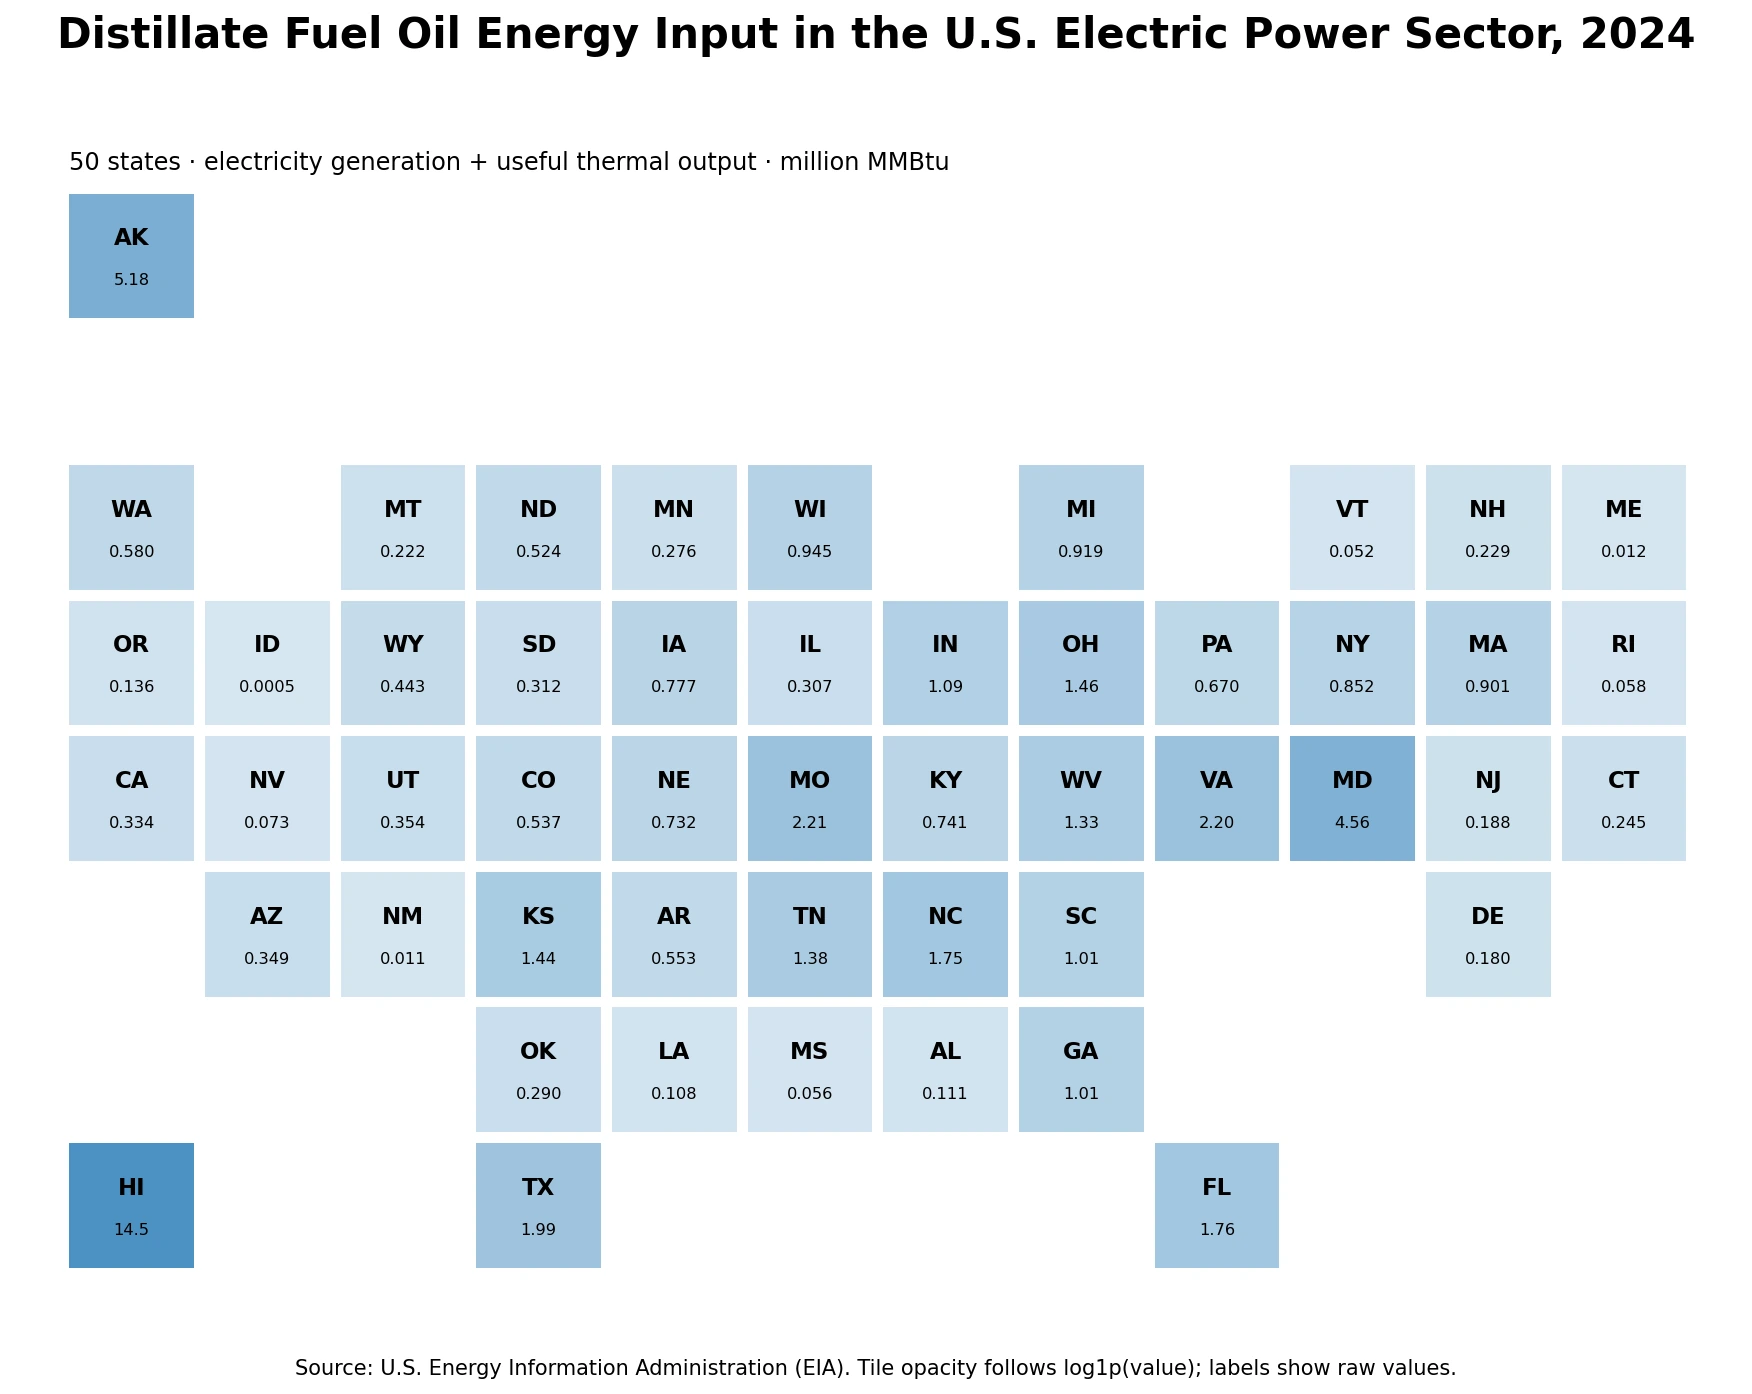
Table of Contents
Distillate fuel oil is narrower than petroleum or petroleum liquids
The fuel definition is the first safeguard against confusing this series with other EIA petroleum indicators. Distillate fuel oil is one petroleum-product category. Broader petroleum series can include residual fuel oil, petroleum coke or other liquid fuels depending on the table and facet. A state can therefore rank differently in DFO than it does in a broader petroleum total.
That distinction matters for duplicate control as well as interpretation. A title that says only “petroleum fuel use” would hide the narrower identity of this dataset. Here the analytical question is specifically where distillate fuel-oil energy input was concentrated within the Electric Power sector during 2024.
Hawaii led by a wide margin and the distribution was strongly skewed
Hawaii used about 2.8 times the distillate fuel-oil energy reported for Alaska, the second-ranked state. Maryland ranked third. Missouri and Virginia were next at 2.21 and 2.20 million MMBtu. The first five states accounted for 51.2% of the total, while the first ten reached 66.2%.
| State | 2024 DFO input (million MMBtu) | Share of 50-state total |
|---|---|---|
| Hawaii | 14.529 | 26.0% |
| Alaska | 5.184 | 9.3% |
| Maryland | 4.559 | 8.1% |
| Missouri | 2.211 | 4.0% |
| Virginia | 2.196 | 3.9% |
| Texas | 1.993 | 3.6% |
| Florida | 1.756 | 3.1% |
| North Carolina | 1.753 | 3.1% |
| Ohio | 1.456 | 2.6% |
| Kansas | 1.437 | 2.6% |
The mean across 50 states was 1.12 million MMBtu, compared with a median of only 0.54. That gap signals a right-skewed distribution in which a few large observations pull the arithmetic average upward. The interquartile range runs from 0.22 to 1.07 million MMBtu.
Fifteen states above 1 million MMBtu held more than three-quarters of the total
Exactly 15 states reported at least 1 million MMBtu, and together they represented 76.6% of the 50-state total. The other 35 states shared the remaining 23.4%. The bottom ten states combined for only 1.1%. These concentration measures show why the median is more representative of a typical state than the mean.
Concentration does not automatically mean those states rely more heavily on distillate fuel oil in proportional terms. A state with a large electric system can record a high absolute quantity even if DFO represents a small fraction of all fuel input. Measuring dependence would require a denominator such as total fuel energy consumed by that state’s Electric Power sector.
The unit is an energy-input unit, not a generation unit
MMBtu means one million British thermal units. The table unit, million MMBtu, is therefore one million MMBtu per displayed unit, equivalent to one trillion Btu. Hawaii’s 14.52942 million MMBtu corresponds to about 14.53 trillion Btu of distillate fuel-oil energy input under this EIA series definition.
Electricity generation is normally expressed in kilowatthours or megawatthours. Fuel input and electric output are related through conversion efficiency, but they are not interchangeable. A heat-rate calculation can connect Btu input to kWh output; the present dataset does not provide that ratio and should not be used as an efficiency ranking.
Total consumption includes electricity generation and useful thermal output
The field name total-consumption-btu is important. In this operational dataset, the total fuel consumption measure covers fuel used for electricity generation plus fuel allocated to useful thermal output. Useful thermal output is relevant to combined-heat-and-power operations where recoverable heat serves a thermal use in addition to electric production.
The value reported here is still fuel energy consumed, not the useful heat delivered. A CHP facility may consume fuel for both electric and thermal functions, and EIA publishes fields that separate those functions as well as a total. Using the total field makes this article broader than an electricity-generation-only DFO comparison.
Very small state values are observations, not missing data
Idaho is the minimum at 0.00049 million MMBtu. New Mexico and Maine are also close to the bottom at 0.01135 and 0.01170. All 50 rows are 2024 observations and none is missing or equal to zero. The visualization therefore does not fill a missing state with zero and does not replace small published values with a generic minimum.
Because the range runs from 0.00049 to 14.52942 million MMBtu, a simple linear intensity scale would compress much of the country into nearly the same visual shade. The tile graphic varies opacity using log1p(value), but every label, table entry, share and descriptive statistic is calculated from the untransformed EIA value.
Why a high absolute value does not by itself explain the state power mix
The dataset answers a narrow spatial question: how much DFO energy was consumed within this Electric Power-sector definition in each state during 2024? It does not explain why a state used that amount. Fuel availability, isolated grids, generator fleets, reliability needs, CHP operations and short-term operating conditions can all affect the result.
A causal explanation would need additional state-level evidence. For Hawaii, for example, the large absolute value is clearly visible in the data, but the dataset alone is not enough to assign a single cause. A responsible reading separates the observed ranking from hypotheses about infrastructure or energy policy.
Population and state size are not denominators in this ranking
The figures are not per capita, per dollar of state GDP, per megawatthour generated or per unit of installed capacity. That is why small-population states can appear near the top and very large states can sit lower. The metric is intentionally an absolute energy quantity. Normalized comparisons would answer different questions and should be labeled as separate calculations.
This distinction also limits environmental conclusions. Total DFO energy input is not a direct CO₂-emissions measure. Emissions require fuel-specific emissions factors and a clearly defined system boundary. Nor does a low value necessarily mean a cleaner electricity system; another fuel could dominate the state mix.
A one-year cross-section cannot establish a trend
Every row belongs to 2024, so the cross-state comparison avoids mixing observation years. That makes the spatial comparison cleaner than a latest-available dataset with different dates. It does not, however, establish whether DFO use is rising or falling in any state. A trend analysis would need the same EIA series for several years.
Year-to-year DFO use can also be sensitive to unusual operating conditions. Weather events, plant outages, fuel-price changes, reserve requirements and temporary substitution among generators can produce large annual movements. The 2024 map should therefore be treated as a snapshot of that year rather than a permanent structural ranking.
How this differs from broader petroleum and electricity-only articles
The closest-looking articles on the site use broader petroleum categories or different EIA fields. Changing DFO to petroleum liquids changes the fuel basket. Changing total-consumption-btu to a generation-only field changes the end use. Changing sectorid changes which power producers are included. Those dimensions are part of the metric identity, not minor technical details.
For that reason, the public title highlights distillate fuel oil and the combined electricity-generation/useful-thermal-output scope. Readers can then distinguish this article from a broader petroleum consumption map even when both use 2024 state data and similar energy units.
Source and calculation method
U.S. Energy Information Administration Electric Power Operational Data is the primary source. The verified slice uses annual 2024 observations, fueltypeid=DFO, sectorid=98, total-consumption-btu, and million MMBtu. The file contains 50 state rows with no imputed states and no substituted years.
From the published state values, the calculated total is 55.98, mean 1.12, median 0.54, first quartile 0.22, and third quartile 1.07 million MMBtu. Hawaii contributes 26.0%; the top three contribute 43.4%; the top ten contribute 66.2%.
Frequently Asked Questions
Which state had the largest Electric-Power distillate fuel-oil energy input in 2024?
Hawaii ranked first at 14.53 million MMBtu, equal to 26.0% of the 50-state total. Alaska and Maryland followed.
Does total-consumption-btu measure electricity generation?
No. It measures fuel-energy input. Electricity output and efficiency require generation data or a heat-rate calculation.
Why is this separate from a broader petroleum-fuel article?
This series fixes fueltypeid=DFO, which is distillate fuel oil only. Broader petroleum or petroleum-liquids series include additional fuel categories and are different metrics.
Is the series limited to fuel used only for electricity generation?
No. The total-consumption-btu field covers fuel used for electricity generation plus fuel allocated to useful thermal output.
Related Articles
Green Map creates custom-edited map images using open geographic data sources such as geoBoundaries, Natural Earth, OpenStreetMap, and government open data. These maps are edited visual materials, not raw data files, and are provided for education, documents, presentations, and graphic reference.