U.S. Energy Information Administration (EIA) operational data show a strongly uneven state distribution for all renewables consumed for electricity generation in 2024. The series covers 51 jurisdictions—the 50 states and the District of Columbia—and is reported in million MMBtu. The 51-jurisdiction sum is 2,647.14612, the median is 26.73656, and the mean is 51.90483.
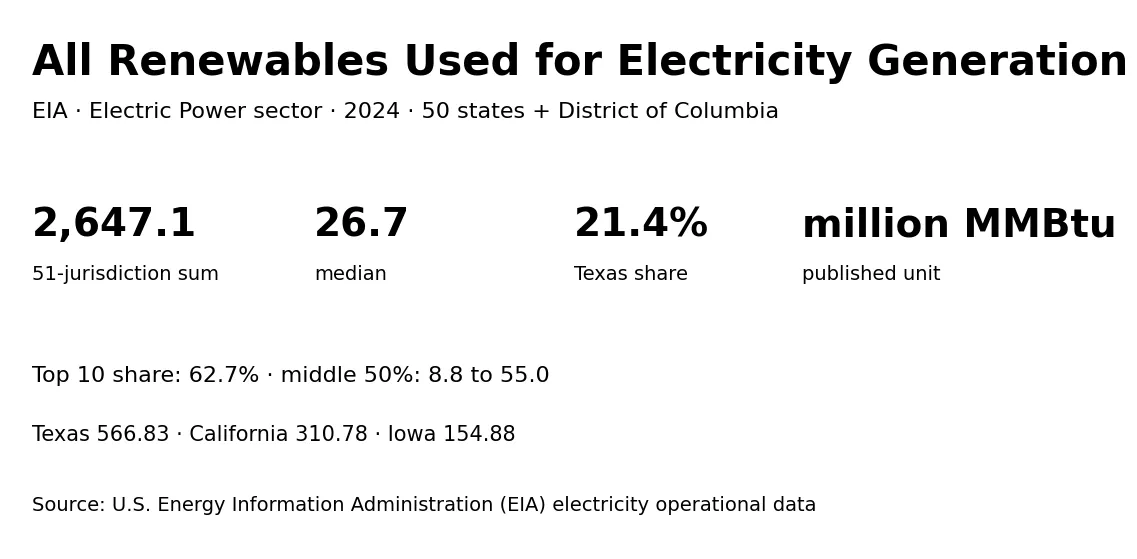
The measure is fuel or energy heat input for electricity generation, not renewable electricity output. The EIA field is consumption-for-eg-btu and the fuel grouping is all renewables (AOR). It should therefore be kept separate from total-consumption-btu, which can cover a broader operational scope, and from net generation, which measures electricity produced rather than energy input.
Table of Contents
Texas leads with 566.83266 million MMBtu
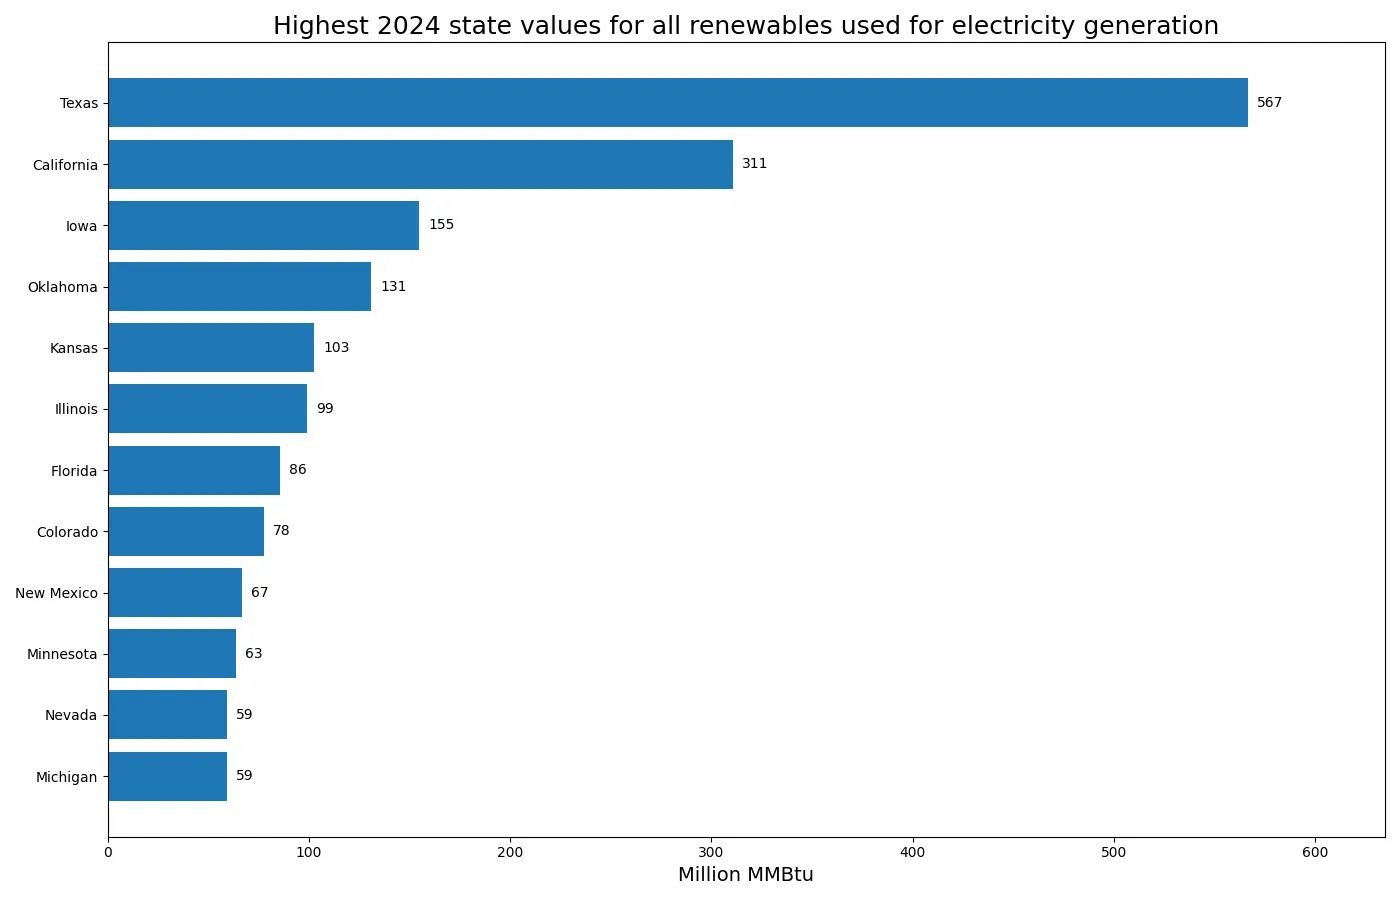
Texas records 566.83266 million MMBtu, about 21.4% of the total. California follows at 310.78183, Iowa at 154.87743, Oklahoma at 130.86233, and Kansas at 102.63743. The gap between Texas and California is 256.05083 million MMBtu.
| State or jurisdiction | 2024 value (million MMBtu) |
|---|---|
| Texas | 566.83266 |
| California | 310.78183 |
| Iowa | 154.87743 |
| Oklahoma | 130.86233 |
| Kansas | 102.63743 |
| Illinois | 99.19360 |
| Florida | 85.61364 |
| Colorado | 77.74392 |
| New Mexico | 66.66846 |
| Minnesota | 63.46462 |
The top three jurisdictions account for 39.0% of the total, the top five for 47.8%, and the top ten for 62.7%. Texas alone contributes more than one-fifth of the sum, but the remaining 41 jurisdictions still account for roughly 37%, so the distribution is concentrated without being completely dominated by a handful of states.
Texas ranking first here does not mean it necessarily has the highest renewable share of electricity generation. These are absolute heat-input totals. A state with a large electricity system can record a high total even if renewables represent a smaller share of its generation mix than in a smaller state. Renewable generation share requires a different denominator and a different calculation.
The median is 26.73656 million MMBtu
The median is 26.73656, while the first quartile is 8.78668 and the third quartile is 54.95124. The middle half of the observations therefore lies between about 8.8 and 55.0 million MMBtu. The maximum is roughly 21.2 times the median, illustrating the gap between Texas and a typical jurisdiction.
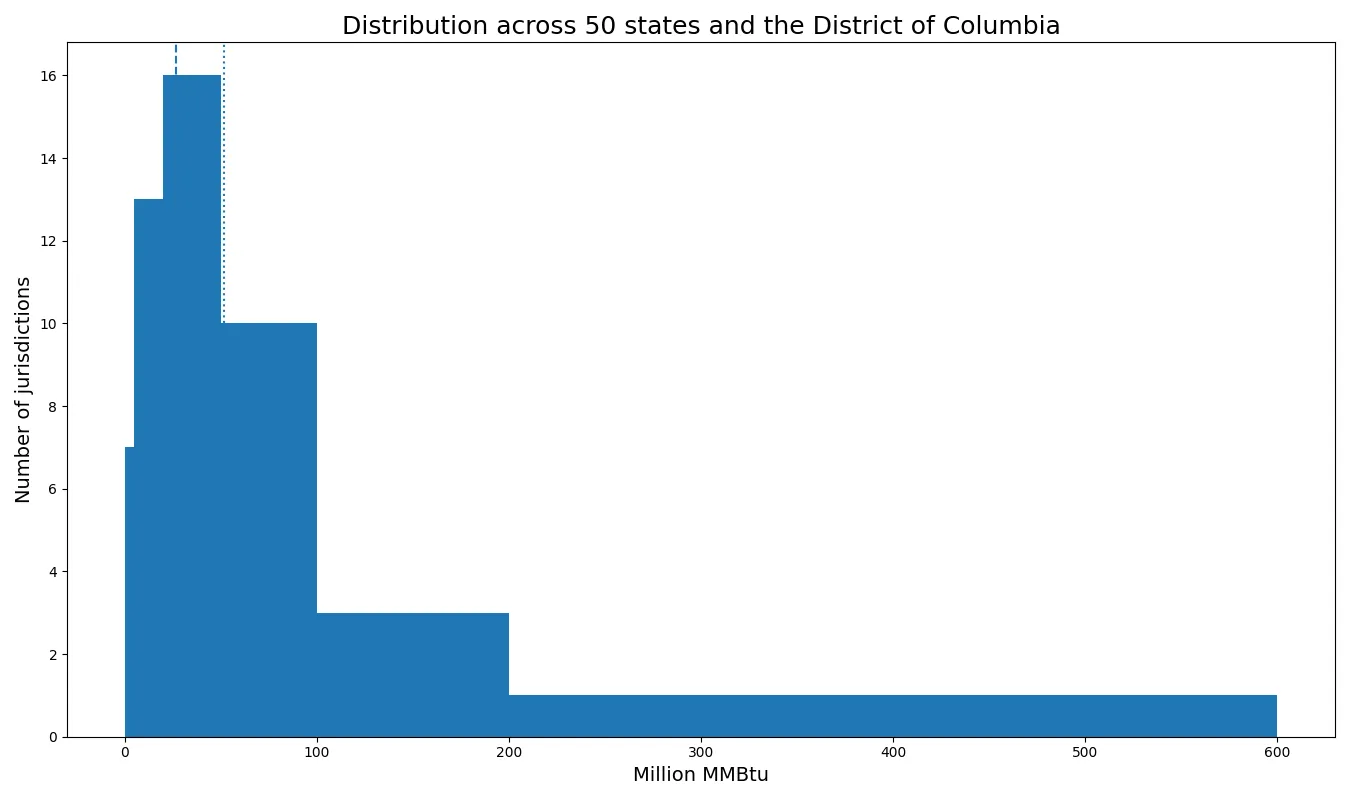
By value band, 7 jurisdictions are below 5 million MMBtu, 13 are from 5 to under 20, 16 from 20 to under 50, 10 from 50 to under 100, 3 from 100 to under 200, and only 2 reach 200 or more. The 20–50 range contains the largest group, while the far upper end contains very few states.
The mean of 51.90483 is almost twice the median of 26.73656. Large observations in Texas and California pull the arithmetic average upward. In a right-skewed distribution, the median and quartiles provide useful context for what a more typical state value looks like.
District of Columbia is lowest, but there are no official zeros
District of Columbia has the smallest observation at 0.10798 million MMBtu. Alaska follows at 0.44746, Delaware at 0.82685, Kentucky at 2.16398, and Tennessee at 4.66221. All 51 rows contain positive numeric values, with no official zeros or missing observations.
| State or jurisdiction | 2024 value (million MMBtu) |
|---|---|
| District of Columbia | 0.10798 |
| Alaska | 0.44746 |
| Delaware | 0.82685 |
| Kentucky | 2.16398 |
| Tennessee | 4.66221 |
| Rhode Island | 4.70251 |
| Alabama | 4.75432 |
| Louisiana | 5.39148 |
| Hawaii | 6.27220 |
| Mississippi | 7.03125 |
Very small positive values should not be rounded into zeros or treated as missing. District of Columbia at 0.10798 and Alaska at 0.44746 remain positive observations in the source series. Because all 50 states and the District of Columbia are present, the comparison does not require imputation or zero-filling.
A small value also does not mean that renewable energy is absent from the jurisdiction. The measure is limited to the Electric Power sector and to energy input assigned to electricity generation under the AOR fuel grouping. Distributed generation, renewable use in other sectors, electricity imports, capacity, and other measures can show different patterns.
The top ten account for 62.7%
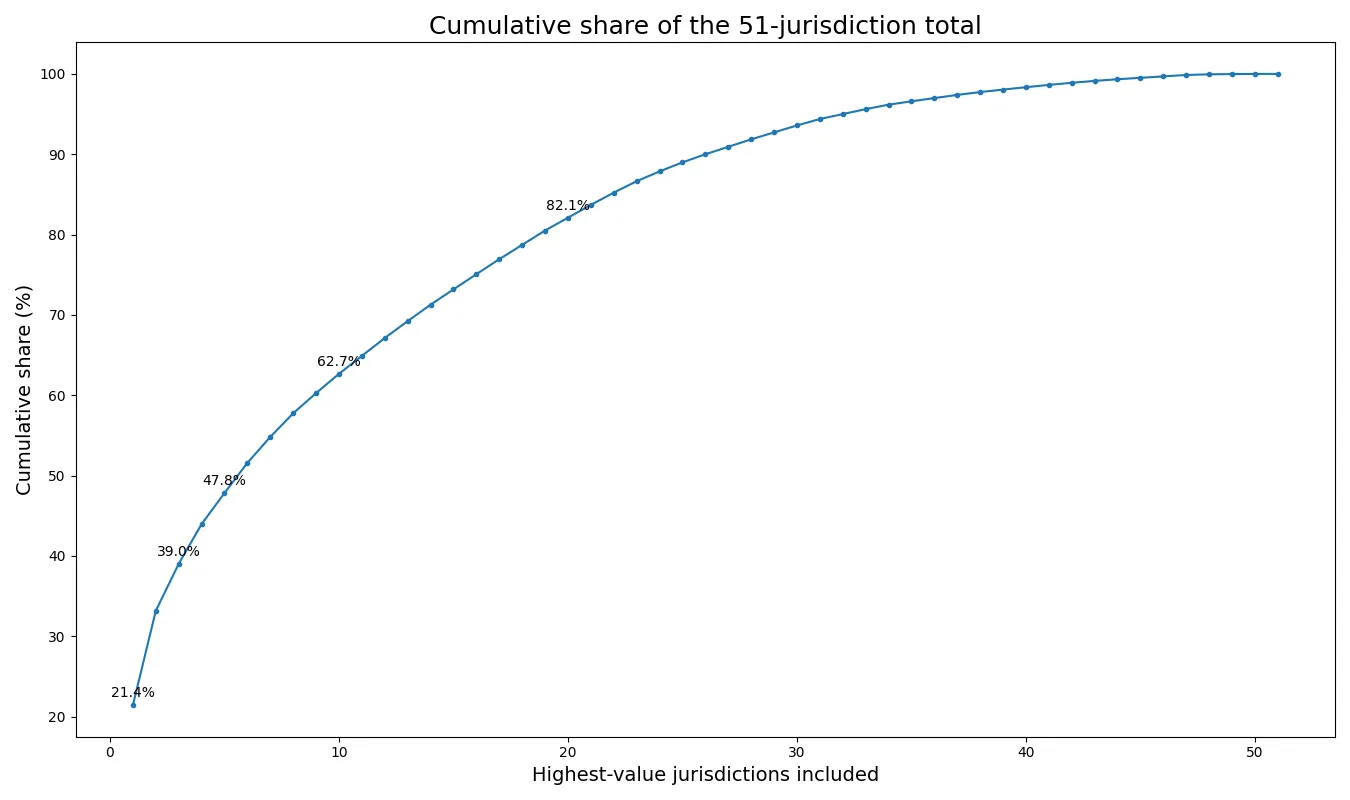
Texas accounts for 21.4% of the total, the top three for 39.0%, the top five for 47.8%, and the top ten for 62.7%. The cumulative curve rises quickly at first but continues to climb steadily after the tenth state, showing both concentration at the top and meaningful contributions from mid-sized jurisdictions.
This concentration calculation is descriptive. It does not measure wholesale electricity-market concentration, utility ownership, or market power. It simply reports how much of the summed state heat input is contained in the largest observations.
Iowa, Oklahoma, and Kansas are all in the top five
Iowa records 154.87743 million MMBtu, Oklahoma 130.86233, and Kansas 102.63743. Illinois follows at 99.19360, Florida at 85.61364, and Colorado at 77.74392.
The ranking is not simply a population ranking. State results can reflect the mix of wind, hydro, biomass, and other renewable resources, the size and utilization of generating fleets, electricity demand, and flows between states. The aggregate AOR measure shows the combined renewable energy input, but identifying which source drives each state requires fuel-specific detail.
Million MMBtu measures energy input, not electricity output
MMBtu is a heat-content unit. The series measures the energy content of renewable inputs used for electricity generation and does not directly report megawatthours of electricity. Electricity output depends on technology and conversion efficiency, so heat input and net generation should be treated as related but distinct measures.
The all-renewables grouping also combines different renewable energy sources. A single physical quantity such as barrels or tons would not provide a consistent common basis across those sources. Heat-content aggregation provides a common energy unit, but it does not identify the composition of the renewable mix in each state.
Electricity-generation consumption should not be mixed with total consumption
EIA electric-power operational data contain several consumption fields. Consumption-for-eg-btu assigns heat input to electricity generation, while total-consumption-btu can have a broader scope that includes useful thermal output. Combined heat and power facilities can make that difference particularly important.
A valid comparison must keep fuel grouping, sector, field, geography, frequency, and unit consistent. A 2024 all-renewables total-consumption series should not be substituted for this 2024 electricity-generation series merely because the titles are similar.
Totals and intensity answer different questions
These state values are totals. They are not normalized by population, electricity generation, gross state product, or installed renewable capacity. A large state can rank high because its power system is large, while a smaller state can have a much higher renewable share or per-capita value but a smaller absolute total.
An intensity analysis would require a denominator chosen for the question being asked. Dividing by electricity generation could describe heat input per unit of output; dividing renewable generation by total generation would describe renewable share. Those are separate metrics and should not be inferred from the totals shown here.
One year cannot establish a trend
The data provide a 2024 cross-section. They do not show whether renewable heat input is increasing or decreasing in Texas, California, or any other state. A trend would require multiple years of the same AOR fuel grouping and consumption-for-eg-btu field at the same state geography and million-MMBtu unit.
Absolute input and renewable share can also move in different directions over time. Renewable heat input can rise while its share of total generation input falls if total energy use rises even faster. Conversely, the share can rise even when the absolute amount changes little. This series provides the absolute input measure only.
Source and the main 2024 pattern
The observations come from U.S. Energy Information Administration electricity data. The EIA Open Data documentation explains the fields and facets used to retrieve annual state observations. This comparison keeps the 2024 year, all-renewables fuel grouping, Electric Power sector, electricity-generation heat-input field, and million-MMBtu unit fixed.
The main 2024 pattern is a strongly right-skewed distribution led by Texas. Texas represents 21.4% of the total and the top ten 62.7%. The median is 26.73656, compared with a mean of 51.90483, and there are no official zero or missing values. A few very large state totals sit above a broad group of medium and small observations.
Frequently Asked Questions
What is the unit of this EIA series?
The unit is million MMBtu, representing the heat content of all renewables used for electricity generation.
Does Texas ranking first mean it has the highest renewable electricity share?
No. This is an absolute heat-input total, not renewable generation share or net generation.
Is District of Columbia a zero value?
No. Its value is 0.10798 million MMBtu, and all 51 observations are positive.
Why is the mean much higher than the median?
Texas and California pull the average upward. The mean is 51.90483, while the median is 26.73656.
Related Articles
Green Map creates custom-edited map images using open geographic data sources such as geoBoundaries, Natural Earth, OpenStreetMap, and government open data. These maps are edited visual materials, not raw data files, and are provided for education, documents, presentations, and graphic reference.