The share of upper-secondary students enrolled in public institutions varies dramatically across education systems. In the UNESCO Institute for Statistics ETOIP.3.PU series for 2024, 82 countries and economies have an observed value. The public-institution share ranges from 3.58% to 100%, with a mean of 78.21% and a median of 84.30%. Most of the observed systems therefore place a large majority of upper-secondary enrolment in public institutions, but a smaller group has a much larger private or non-public sector.
This is not an upper-secondary enrolment rate. The denominator is the students already enrolled in upper-secondary education, and the numerator is the subset enrolled in public institutions. A value of 100% therefore means that all recorded upper-secondary enrolment is in public institutions within the statistical definition. It does not mean that every teenager of upper-secondary age is enrolled in school. A value of 40% means that roughly two fifths of enrolled students are in public institutions, leaving a large role for non-public providers.
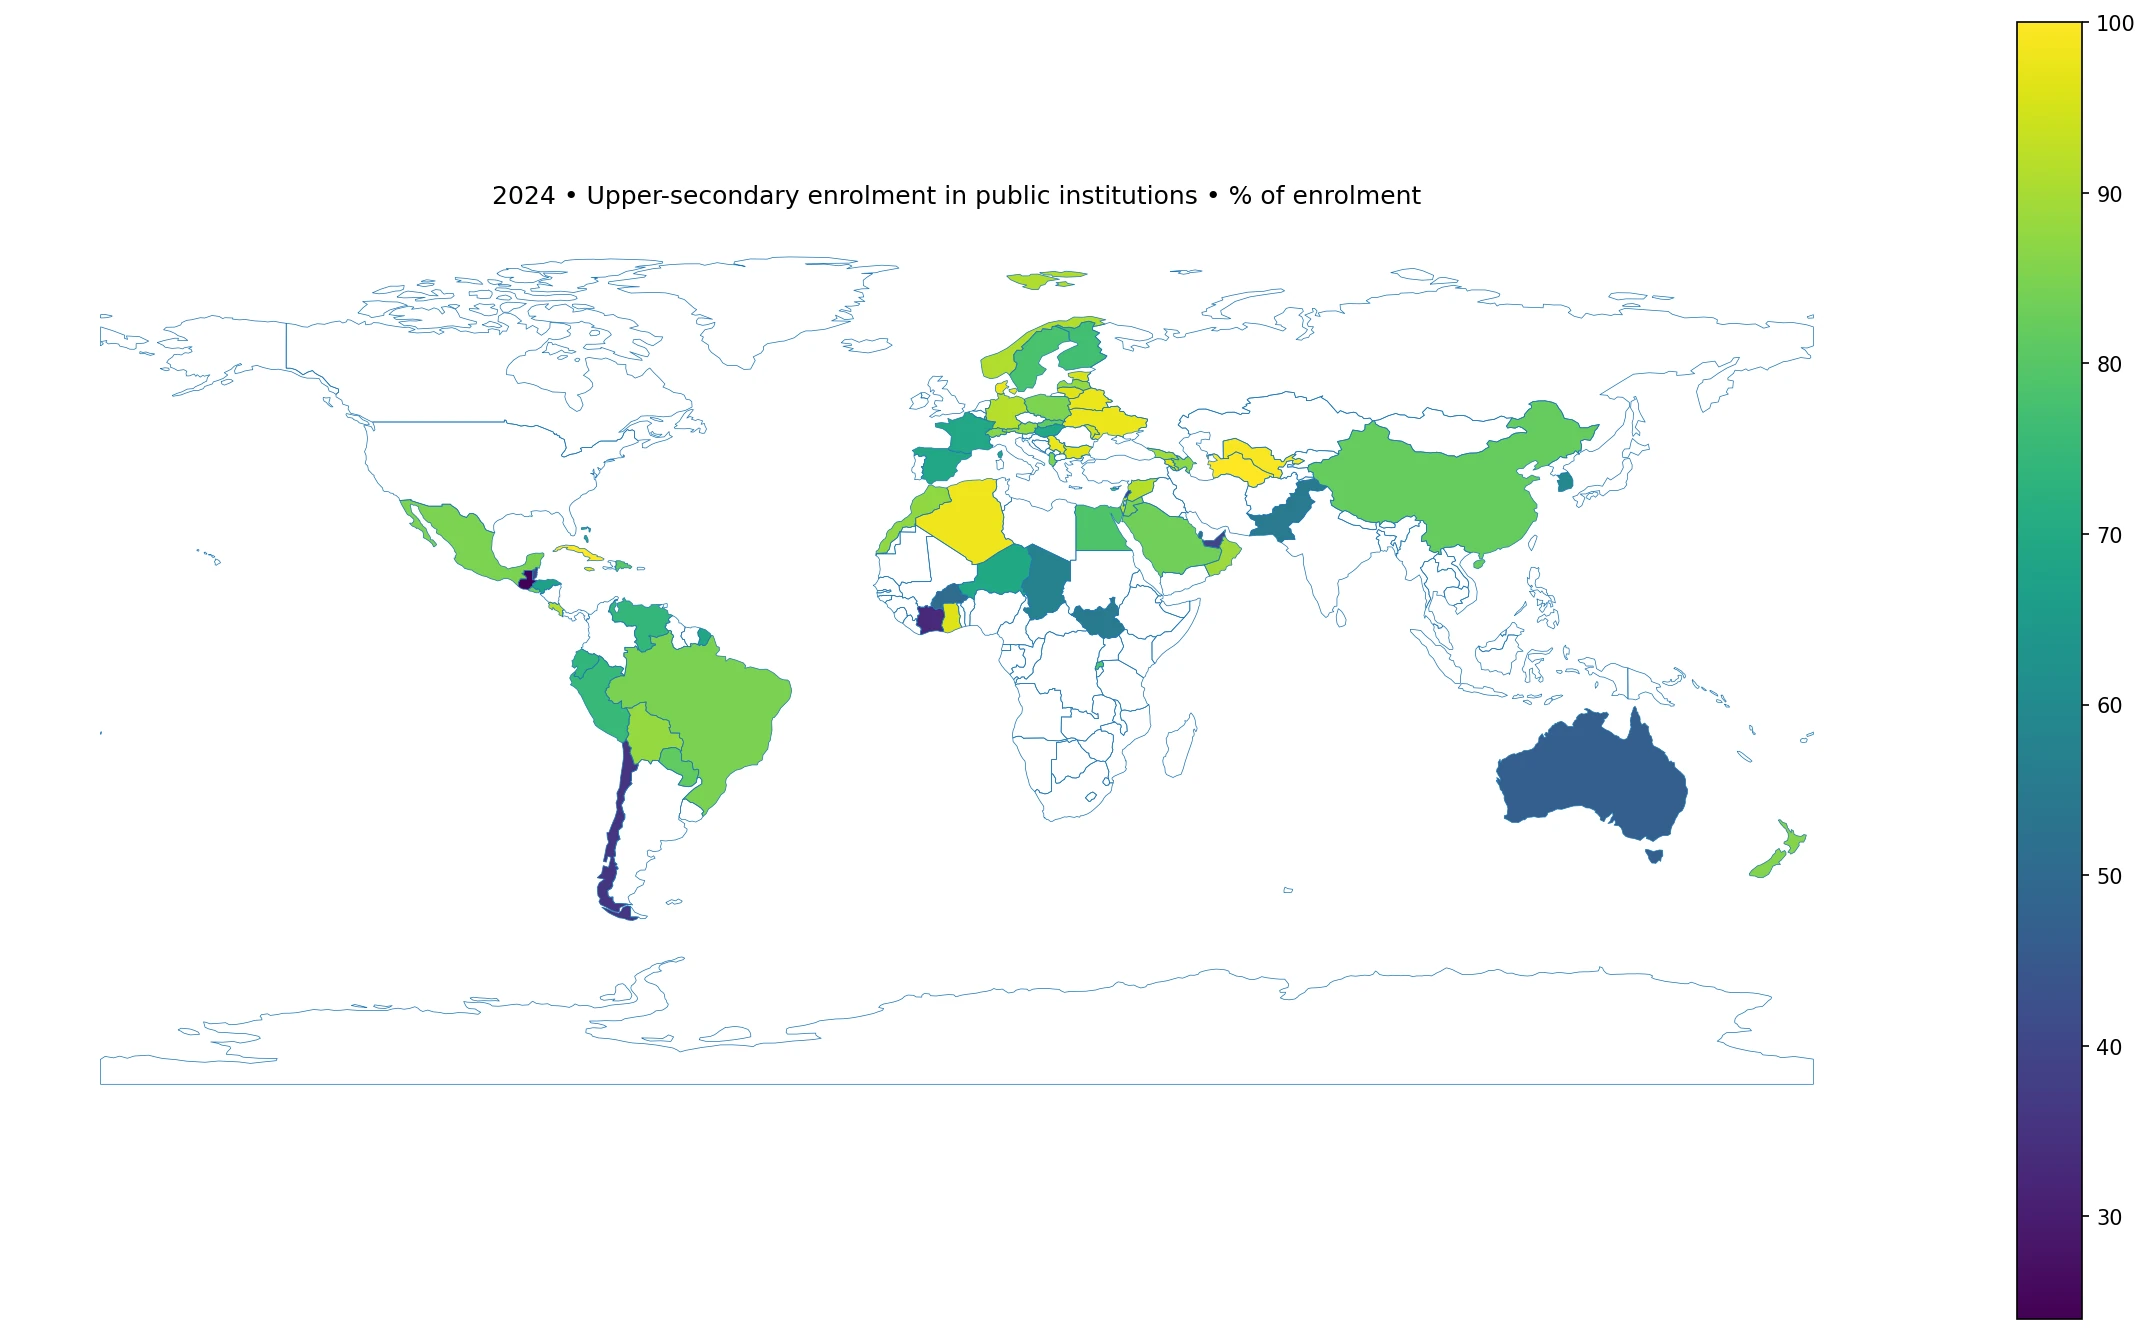
Table of Contents
What the indicator measures
The indicator describes the institutional composition of upper-secondary education. A high value means that most students who are enrolled at this level attend institutions classified as public. A lower value means that private, independent, religious, international or other non-public institutions account for a larger share of enrolment. The exact institutional arrangements behind those categories can differ from one country to another, so the percentage is best treated as a structural measure rather than a direct measure of funding or school quality.
Public provision and educational participation are separate questions. A country can have a 95% public share and still have a relatively low upper-secondary enrolment rate if many young people are outside the school system. Another country can have a public share below 50% while maintaining broad access through a large private sector. To evaluate participation, this indicator needs to be paired with gross or net enrolment ratios, completion rates and out-of-school measures.
The center of the 2024 distribution is in the 80s
The first quartile is 69.40%, the median is 84.30%, and the third quartile is 92.63%. Half of the observed countries therefore sit between about 69% and 93%. Twenty-six observations are at 90% or above, and another 30 fall between 75% and 90%. Combined, 56 of 82 observed systems place at least three quarters of upper-secondary enrolment in public institutions.
Only nine observations are below 50%. Two are below 25%, while seven are between 25% and 50%. This asymmetry explains why the global-looking map is dominated by medium-to-high values even though a handful of countries have very low public shares. The median is a useful description of the typical observed system, while the lower tail reveals education systems in which non-public providers play a particularly large role.
Highest public shares of upper-secondary enrolment
| Country or economy | Public share |
|---|---|
| Cuba | 100.00% |
| Curaçao | 100.00% |
| Niue | 100.00% |
| San Marino | 100.00% |
| Turkmenistan | 100.00% |
| Uzbekistan | 99.30% |
| Algeria | 98.36% |
| Ukraine | 97.88% |
| Belarus | 97.87% |
| Serbia | 97.78% |
Cuba, Curaçao, Niue, San Marino and Turkmenistan are all recorded at 100%. Uzbekistan follows at 99.30%, Algeria at 98.36%, Ukraine at 97.88%, Belarus at 97.87%, and Serbia at 97.78%. These values indicate that nearly all recorded upper-secondary students are enrolled in public institutions in the relevant statistical year.
A very high public share should not be interpreted as evidence of better learning outcomes, greater efficiency or more equitable access. The balance between public and private provision reflects historical institutions, regulation, public finance, the role of religious or nonprofit providers, vocational education arrangements and many other features of an education system. The percentage tells us how enrolment is distributed by provider type, not which model performs better.
Lowest public shares of upper-secondary enrolment
| Country or economy | Public share |
|---|---|
| China, Macao Special Administrative Region | 3.58% |
| Guatemala | 23.99% |
| Côte d'Ivoire | 32.73% |
| Chile | 35.70% |
| Lebanon | 37.94% |
| United Arab Emirates | 39.76% |
| Belize | 40.01% |
| Mauritius | 46.08% |
| Australia | 46.79% |
| Burkina Faso | 50.62% |
Macao has the lowest observed value at 3.58%, followed by Guatemala at 23.99%, Côte d’Ivoire at 32.73%, Chile at 35.70%, Lebanon at 37.94%, the United Arab Emirates at 39.76%, Belize at 40.01%, Mauritius at 46.08%, Australia at 46.79%, and Burkina Faso at 50.62%. In these systems, non-public institutions account for a much larger share of upper-secondary enrolment than in the high-share group.
A lower public share does not automatically mean households bear most of the cost. Governments can subsidize private schools, fund teachers, provide vouchers, contract with nonprofit providers, or regulate tuition. Conversely, a public institution can still involve household spending on transport, materials or other costs. The ownership or administrative classification of the institution is therefore different from the question of who ultimately finances education.
Regional patterns are visible, but within-region differences are large
Among observed countries, Europe has a median public share of 88.02%. North America is at 83.10% and Asia at 82.83%, while South America is at 75.01% and Africa at 69.59%. Oceania has only two matched large-country observations in the region summary, Australia and New Zealand, so its median should not be generalized to the region as a whole. These figures describe the countries with a 2024 observation, not every country on each continent.
Asia shows especially wide variation. Turkmenistan and Uzbekistan are near 100%, yet Macao is at 3.58%, Lebanon at 37.94%, and the United Arab Emirates at 39.76%. South America also contains both relatively high and low public shares, with Bolivia at 87.97% and Brazil at 84.64% compared with Chile at 35.70%. These contrasts show why geographic proximity alone is not enough to infer the public-private structure of schooling.
What a value of 100% does and does not mean
A 100% observation means that all upper-secondary enrolment captured by the indicator is in public institutions. It does not imply universal access, universal completion, zero private tutoring, or identical school governance. A public system can still contain different tracks, including general education, vocational education and specialized institutions. Administrative responsibility may also be split between central, regional and local authorities.
Similarly, a value close to zero does not mean public education is absent at every level. The indicator is specific to upper-secondary education. A country can have a large public sector in primary or lower-secondary schooling while relying heavily on non-public providers at the upper-secondary stage. Level-specific analysis is important because the public-private mix can change as students move through the education system.
Why provider type differs across countries
Several mechanisms can produce very different public shares. Some systems expanded mass secondary education mainly through state-run schools. Others historically developed strong religious, nonprofit or independent school networks. In rapidly growing cities, private providers may expand more quickly than the public system. In some countries, international schools or fee-charging secondary institutions serve a substantial segment of students. Vocational education can also alter the composition if training institutions are classified differently from general secondary schools.
The percentage cannot identify which mechanism is dominant without national context. It is therefore more useful for screening and comparison than for causal explanation. A researcher can use the map to identify unusual cases, then examine financing rules, school ownership laws, subsidy arrangements, tuition policies and demographic trends to understand why a country sits at a particular point in the distribution.
Important limitations when comparing countries
First, the dataset contains 82 observed countries and economies for 2024 rather than complete global coverage. Countries without a reported observation are not zeros and should not be treated as if they had no public enrolment. Second, small states and territories can disappear from a world map because low-resolution boundary files do not contain separate polygons for every statistical unit. Their numerical values remain part of the rankings and summary statistics.
Third, international categories improve comparability but cannot erase institutional differences. A school can be privately managed but heavily publicly funded, or publicly owned but given substantial autonomy. The public-institution share therefore does not capture the full relationship between ownership, management, regulation and finance. Country profiles and education-system documentation are useful when interpreting extreme values.
Fourth, a single year is a snapshot. A country may be moving toward more public provision, expanding private capacity, reorganizing vocational education or changing classification practices. Trend analysis requires multiple years. The 2024 map is best used to compare the structure of systems at one point in time, not to infer whether the public share is rising or falling.
Indicators that add context
The most useful companion indicators are upper-secondary gross and net enrolment ratios. They show how broad participation is, while ETOIP.3.PU shows where enrolled students study. Completion rates and educational attainment add a second dimension by showing whether students finish the level and how much education adults have ultimately completed. Out-of-school rates identify the population that never appears in the denominator of the public-share indicator.
Finance indicators are also important. Government education expenditure, household education spending, public transfers to private institutions and teacher compensation can show whether a system with a low public share is still strongly supported by public money. These measures help separate institutional ownership from financing responsibility and make cross-country comparisons more meaningful.
Data and calculation method
The source is the UNESCO Institute for Statistics indicator ETOIP.3.PU, Percentage of enrolment in upper secondary education in public institutions, both sexes (%). The reference year is 2024. The supplied official dataset contains 82 country or economy observations, all numeric. No missing country was converted to zero. The mean, median, quartiles and ranking tables in this article are calculated directly from those 82 observations.
For the map, ISO3 country codes were joined to a low-resolution world administrative boundary layer. Sixty-eight observations matched directly to polygons. Fourteen mostly small states or territories did not have a matching polygon in that boundary file. The map therefore summarizes the broad spatial pattern, while the tables preserve exact values for every observation in the dataset.
Frequently Asked Questions
Does a 100% public share mean every teenager is enrolled in upper-secondary education?
No. It means all recorded upper-secondary enrolment in that observation is in public institutions. Participation of the full age group is measured by separate enrolment-rate indicators.
Does a higher public share indicate better education outcomes?
Not by itself. The indicator describes provider type, while learning outcomes, completion, access and finance require additional measures.
Are countries missing from the map treated as zero?
No. Some small states and territories do not have separate polygons in the low-resolution boundary layer. Their observed values remain in the tables and summary statistics.
Related Articles
Green Map creates custom-edited map images using open geographic data sources such as geoBoundaries, Natural Earth, OpenStreetMap, and government open data. These maps are edited visual materials, not raw data files, and are provided for education, documents, presentations, and graphic reference.