UNESCO Institute for Statistics (UIS) data for 2024 show a very wide spread in the number of pupils repeating Grade 2 of primary education. Among the 101 available countries and territories, India is highest at 385,016, followed by Madagascar at 259,015, Malawi at 206,706, Ethiopia at 170,246, and Rwanda at 161,572. The median is only 969, highlighting how far the largest observations sit above the middle of the distribution.
The UIS definition of the number of repeaters refers to pupils enrolled in a grade who study the same grade again in the following school year. The concept can include pupils repeating the grade more than once or repeating after transferring schools. The indicator used here is an absolute both-sexes count for Grade 2 of primary education, not a repetition rate.
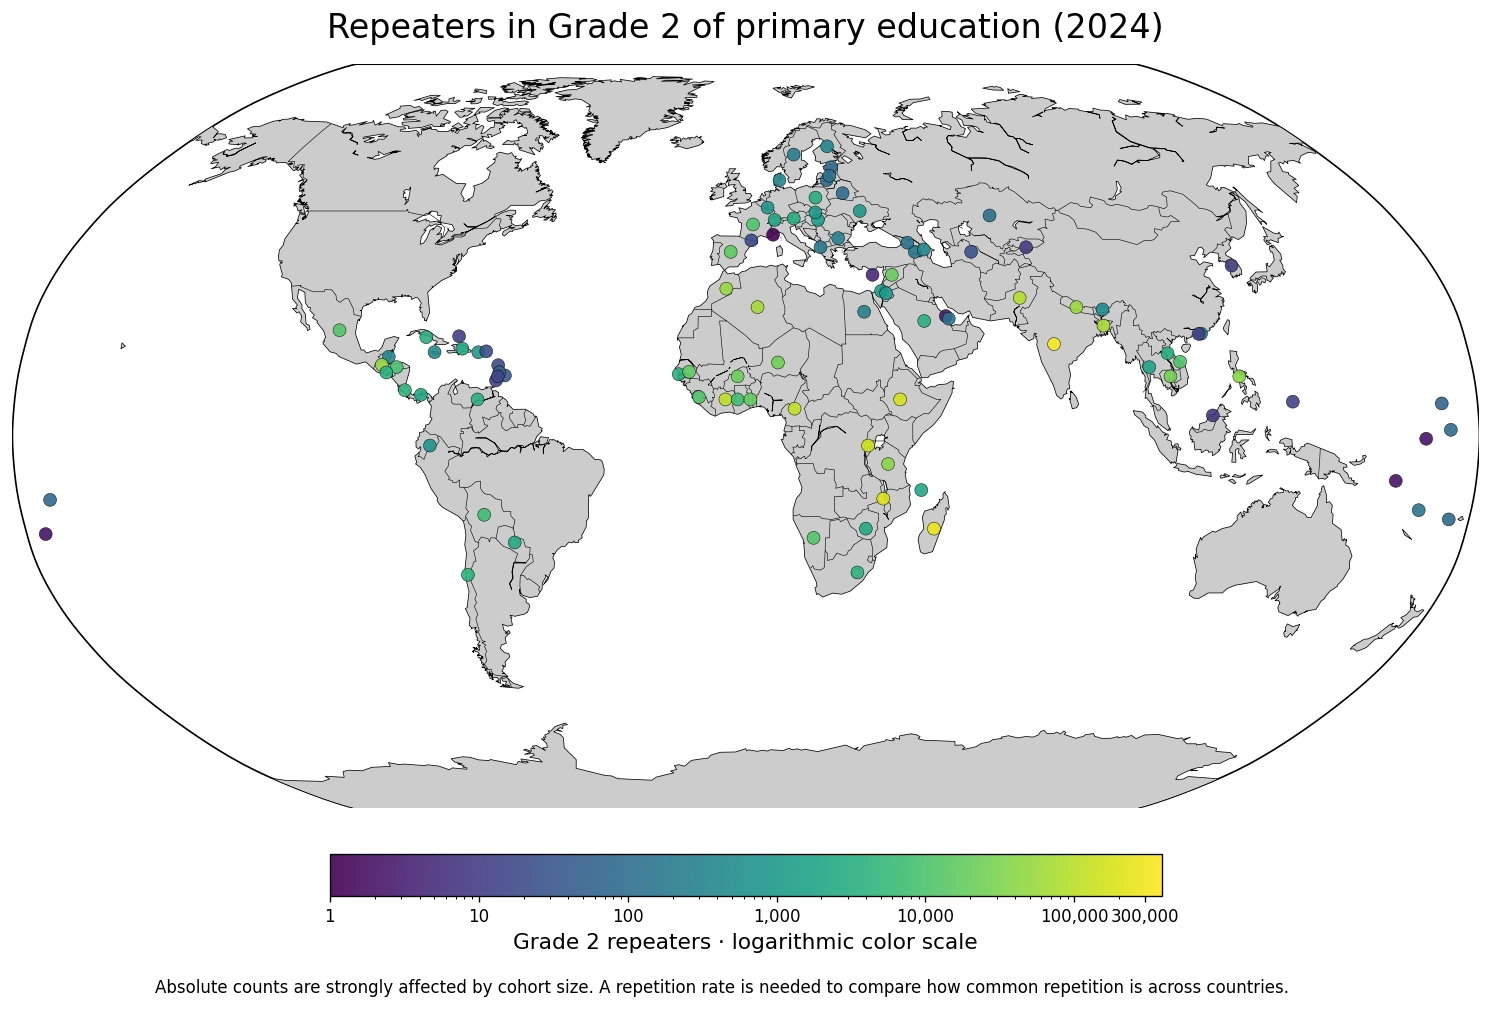
Table of Contents
India, Madagascar, and Malawi account for about 39% of the observed sum
Adding the 101 supplied observations gives about 2,174,564 repeaters. That is not a world total because countries without a 2024 observation are not included. Within the observed set, India, Madagascar, and Malawi account for 39.1% of the sum. The top five observations account for 54.4% and the top ten for 75.7%.
Large counts appear particularly in South Asia and Sub-Saharan Africa. India, Pakistan, Bangladesh, and Nepal are prominent in South Asia, while Madagascar, Malawi, Ethiopia, Rwanda, Cameroon, and Côte d’Ivoire appear near the top in Africa. This identifies where absolute counts are large, but it does not establish where grade repetition is most prevalent relative to enrolment.
| Rank | Country or territory | Grade 2 repeaters in 2024 |
|---|---|---|
| 1 | India | 385,016 |
| 2 | Madagascar | 259,015 |
| 3 | Malawi | 206,706 |
| 4 | Ethiopia | 170,246 |
| 5 | Rwanda | 161,572 |
| 6 | Cameroon | 115,946 |
| 7 | Côte d’Ivoire | 114,158 |
| 8 | Pakistan | 91,933 |
| 9 | Bangladesh | 73,125 |
| 10 | Algeria | 67,407 |
| 11 | Nepal | 55,969 |
| 12 | Morocco | 52,141 |
| 13 | Guatemala | 50,899 |
| 14 | Philippines | 41,754 |
| 15 | United Republic of Tanzania | 38,991 |
Absolute counts are not repetition rates
The number of Grade 2 pupils differs enormously across countries. Even with the same probability of repeating, a country with a much larger Grade 2 cohort will tend to record more repeaters. A small country can have a tiny absolute count even when repetition represents a noticeable share of its pupils.
The separate UIS repetition-rate-by-grade indicator compares repeaters with the relevant enrolled cohort from the previous school year. That rate is the more direct measure for asking where repetition is common. The current count is more useful for asking how many pupils are affected and what scale of support may be required.
Thirteen observations are at or above 50,000
13 observations are at or above 50,000 repeaters, while 14 fall between 10,000 and 49,999. 3 are between 5,000 and 9,999, and 20 between 1,000 and 4,999. At the other end, 28 observations are below 100, including 8 below 10.
| Grade 2 repeater count | Countries or territories | Share of observations |
|---|---|---|
| Below 10 | 8 | 7.9% |
| 10–49 | 11 | 10.9% |
| 50–99 | 9 | 8.9% |
| 100–499 | 17 | 16.8% |
| 500–999 | 6 | 5.9% |
| 1,000–4,999 | 20 | 19.8% |
| 5,000–9,999 | 3 | 3.0% |
| 10,000–49,999 | 14 | 13.9% |
| 50,000 or more | 13 | 12.9% |
The middle half of the observations runs from 84 to 11,105, with a median of 969. The mean is 21,530, more than twenty times the median, because a relatively small number of very large observations pull the average upward. The distribution is therefore strongly right-skewed.
Grade 2 captures an early stage of pupil progression
Grade 2 sits near the beginning of primary education, so repetition at this stage may occur in a different context from repetition in later grades. School adjustment, early literacy and numeracy, entry age, attendance, and access to learning support can all be relevant to early-grade progression.
The count itself does not identify the reason a pupil repeated. It cannot tell us whether repetition followed unmet learning standards, attendance problems, administrative rules, age-related issues, or another cause. Those explanations require country-specific evidence and additional indicators.
Repeaters are not the same as out-of-school or dropout pupils
A repeater remains enrolled in the education system and studies the same grade again. An out-of-school child is not enrolled in the relevant level, while a dropout leaves school and may not return. These statuses can interact in pupil-flow analysis but they are not interchangeable.
A country can have relatively few out-of-school children while still recording substantial grade repetition, or the reverse. A fuller view of progression would examine entry, promotion, repetition, dropout, and re-entry together. This dataset isolates only the number of pupils repeating Grade 2.
A large repeater count is not a direct ranking of education quality
Repetition is relevant to internal efficiency, but an absolute count does not establish why pupils repeat or whether a system is high- or low-quality. Promotion rules, automatic progression, assessment policies, remedial instruction, class size, enrolment scale, and limits on the number of repetitions can differ substantially across countries.
One system may deliberately require pupils who have not mastered foundational material to repeat, while another may promote pupils and provide catch-up support in the next grade. Comparing system performance therefore requires repetition rates plus learning outcomes, attendance, dropout, teacher resources, and policy context.
The smallest counts are concentrated in small countries and territories
Monaco records 1 repeater. Bahrain, the Solomon Islands, Nauru, and Tonga record 2 each; Cyprus has 4, Brunei Darussalam 8, and Kyrgyzstan 9. Turks and Caicos Islands has 11, while Macao and Palau have 12 each.
| Low-count order | Country or territory | Grade 2 repeaters in 2024 |
|---|---|---|
| 1 | Monaco | 1 |
| 2 | Bahrain | 2 |
| 3 | Solomon Islands | 2 |
| 4 | Nauru | 2 |
| 5 | Tonga | 2 |
| 6 | Cyprus | 4 |
| 7 | Brunei Darussalam | 8 |
| 8 | Kyrgyzstan | 9 |
| 9 | Turks and Caicos Islands | 11 |
| 10 | Republic of Korea | 12 |
| 11 | China, Macao Special Administrative Region | 12 |
| 12 | Palau | 12 |
| 13 | Grenada | 14 |
| 14 | Saint Vincent and the Grenadines | 15 |
| 15 | Dominica | 18 |
These tiny counts can reflect low repetition, but they are also strongly shaped by the size of the Grade 2 population. A country with only a small cohort will naturally have fewer repeaters in absolute terms than a country educating millions of primary pupils. Rates are needed for a prevalence comparison.
Grade 2 and Grade 6 counts should not be treated as the same cohort measure
Even within the same UIS repeater framework, Grade 2 and Grade 6 describe different points in the education pathway. A country can have high repetition in the early grades and lower repetition later, or the reverse, depending on promotion policy, dropout, cohort size, and curriculum demands.
A grade-by-grade progression analysis would compare repeater counts and rates across multiple grades while also following enrolment and promotion flows. This article stays with the 2024 Grade 2 cross-section and does not infer a full primary-school progression pattern from one grade.
One low-count observation illustrates why the denominator matters
The Republic of Korea records 12 Grade 2 repeaters in the supplied 2024 dataset, placing it near the low end of the 101 observations. That figure alone does not establish Korea’s repetition rate or rank the education system. The Grade 2 enrolment denominator and national promotion rules would be needed for a meaningful prevalence comparison.
All 101 observations use the same 2024 reference year
Every row in the supplied dataset is dated 2024, which avoids mixing observations from different years. This improves the comparability of absolute counts across the included countries and territories. Coverage remains incomplete, however, and countries without a 2024 value are not assigned zero.
Administrative education statistics can have different reporting schedules and availability across countries. The rankings, observed sum, mean, and median in this article therefore describe the 101 supplied observations, not a complete world total. No missing country value is imputed.
Data scope and source
The analysis uses 101 national-level 2024 observations from the UNESCO Institute for Statistics official API indicator 21502, titled ‘Repeaters in Grade 2 of primary education, both sexes (number)’. The unit is the absolute number of pupils repeating the grade.
The observed range is 1 to 385,016, with a median of 969. The observed sum across the 101 rows is about 2,174,564, but it is not presented as a complete global total. The map uses a logarithmic color scale and does not convert missing observations to zero.
The main takeaway
India records 385,016 Grade 2 repeaters in 2024, followed by Madagascar at 259,015 and Malawi at 206,706. Those three observations account for 39.1% of the observed sum. Because these are absolute counts, cohort size has a major effect on the ranking. Use the count to understand the scale of pupils repeating Grade 2, and use a repetition rate when the question is how common repetition is relative to enrolment.
Frequently Asked Questions
How does UIS define a repeater?
A repeater is a pupil who was enrolled in a grade and studies the same grade again in the following school year. The definition can include pupils repeating more than once and those who repeat after transferring schools.
Does a larger repeater count mean a higher repetition rate?
No. Absolute counts depend on the size of the Grade 2 cohort. A repetition rate uses the relevant enrolled cohort as the denominator and is better for comparing prevalence.
Are Grade 2 repeaters the same as out-of-school children?
No. Repeaters remain enrolled and study the same grade again, while out-of-school children are not enrolled in the relevant education level.
Related Articles
Green Map creates custom-edited map images using open geographic data sources such as geoBoundaries, Natural Earth, OpenStreetMap, and government open data.
These maps are edited visual materials, not raw data files, and are provided for education, documents, presentations, and graphic reference.